All Activity
- Past hour
-

when I open the AI visualizer, the dialog box is blank?
MHBrown replied to grant_PD's topic in AI Visualizer
Ok, I'm jumping through all the hoops. I even realized that I had to add AI to my Workspace, despite the VW site saying it was "automatically adding in SP4." That is not even close to true. OK, so it is now in my menu. I try to use it. It says I have to "Enable this feature with VSS." I have already updated my VCS to 13.4.2742, but now I'm getting this new hoop to jump through called VSS. I clicked my only option: "More Info" which took me to some sort of VSS site which had no information as to how to proceed. OK, here is the deal. When you guys figure out how to add this feature so that it works in the same way as, say, the rectangle tool, CALL ME. This absurdly useless tool has wasted an hour of my life I will not get back. What a huge disappointment. MH Brown - Today
-

User origin and internal origin not coincident in new drawings
dvdvarch replied to dvdvarch's topic in Architecture
Thank you Shorter, you caught all my issues! As you have imagined my problem is mainly in placing correct and quick elevation annotations and in correct import/export. I am going to apply all your suggestions and let you know how it goes, thank you! Davide -
 @Jeff Prince Thanks that looks like a workable solution. I'll have a play and learn loads while i do...👍
 -
It was about 10 years ago that I asked for this.
-
 Lotus577 joined the community
 -
 Hello, Have you sold both of your licenses? hoet.holdings@gmail.com
 -
Hello, Did you seel all of the VW licenses?
-
HOET joined the community
-
Can you add GCode (or any slice file) import support for Vectorworks? Sometimes when working on 3D files and going off of what I have available, sometimes I want to modify a 3D Printer model and only have a GCode file, wanted to know if GCode importing support could be added. Mentioned this to Ryan during the open house.
-
We fight this all the time with LED walls and TV symbols. It's very frustrating to have to add an extra surface to prevent this issue.
-
ooooh, that worked! thank you!!
-
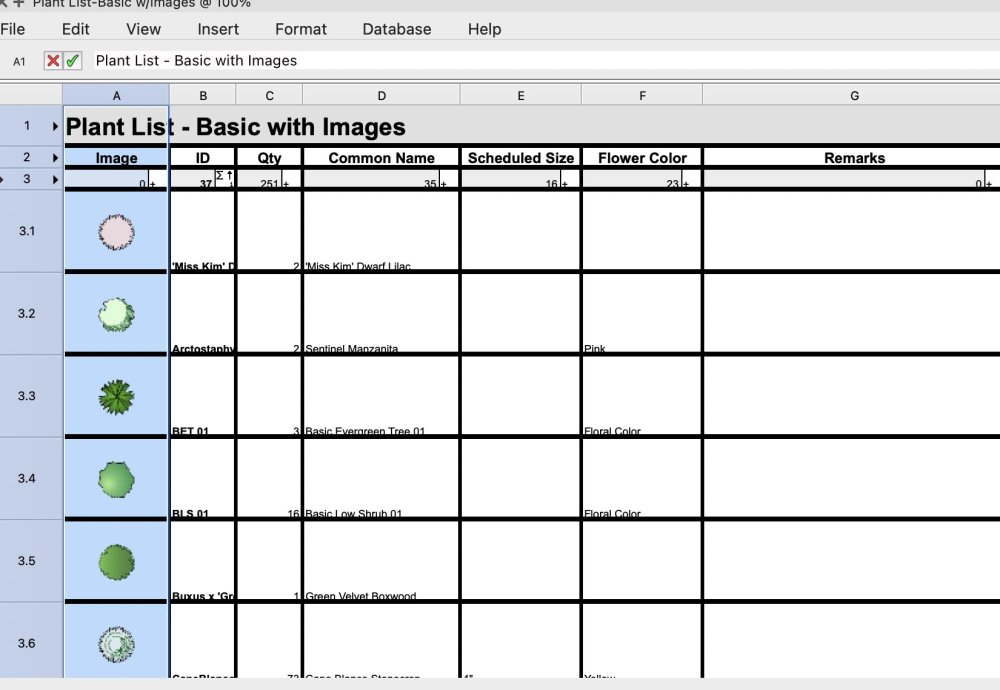
Click on cell 3A. It should say: =RUNSCRIPT(120, 'Landmark Schedules/WSLandscapeAreaPlantImage.py') That's how your symbol image is inserted if you want to make a custom plant list.
-

Lighting Elements incredibly dim between shaded and final quality
Jeff Prince replied to Cal.Scenic's topic in Entertainment
Change the lighting settings for Shaded mode. There is an overall brightness setting that may be effecting things. -
When I choose the column it says, "Plant List - Basic with Images".
-
Yes, either autocorrect got me or my plans to cook dinner.
-
You don't need a titleblock in the Design Layer, what you need is a consistent grid references related to your map, not paper. So, place a grid on a design layer, open a viewport to that design layer to create your overall map. For the detailed areas, you can snap to the grid and draw a shape to make a new viewport from... any enclosed grids will appear in the enlarged viewport. If your version of Vectorworks includes the Gridline Tool, use that because it will handle the annotation for you and change scales automatically... it's pretty nice! If your VWX doesn't have the Gridline Tool, you can add annotations to your grid in the viewport annotations. Anything you draw in Vectorworks can have a record attached, so you could make a grid ID record and attach it to any line your draw. This would enable you to use a Datatag to report the line's GridID and place it wherever you want in the Viewport annotations. This could be helpful if you were making a grid from say Bézier curves or shapes other than lines. If I did a lot of this kind of thing and did not have the Gridline tool, I would build a template file that had a grid with records attached and just reuse it on each project. Attached is an example demonstrating both approaches. grid locator example.vwx Hope it helps... Oh, and another possible solution from the archives involves using Space objects. The instructions here are still valid, but the examples have been deleted for some reason...
-
 jonbarkeruk joined the community
 -

Add further columns in 'Navigation - Sheet Layers' Palette
HLJ replied to MartynHowes's question in Troubleshooting
Did anyone ever get an answer to this? It would be extremely helpful as we are getting our drawing numbers to automatically update with the latest revision number, but we can't find a way to get the sheet number to append the revision number - or display the revision number in a separate column -
Try and create one of the Preformatted Reports for plants that include Image in the name and look at how they are set up. Tools:Reports:Create Report. Then click the Preformatted Report radio button at the top and choose from the list.
-
I know we have fought this before, but I am too lazy/busy to track down that thread right now. There is a problem in worksheets where if you use a value from a database header row in a spreadsheet cell calculation and then try to use that spreadsheet cell later in the database header row the value will default to zero and the calculation will fail. So in a very simple database with Space.Area in column A starting at row 4, you can't just put a formula of =A4 into A1 and display the summed value of all the spaces. As soon as you try and set the next column in the database to =A4/A1, the calculation will fail. In this case if you only care about the total area you can fake it. In my sample worksheet, put a formula of =Area(PON='Space') in cell A1. Then the column B formula of =A4/A1 will work. You would actually want to also include all of the criteria from the database rather than my simple PON=Space which sums the area of every space object. If you wanted to use the more sophisticated Space.Gross Area or Space.Net Area, I think you are out of luck. I don't know of a way to SUM those values by criteria. HTH
-
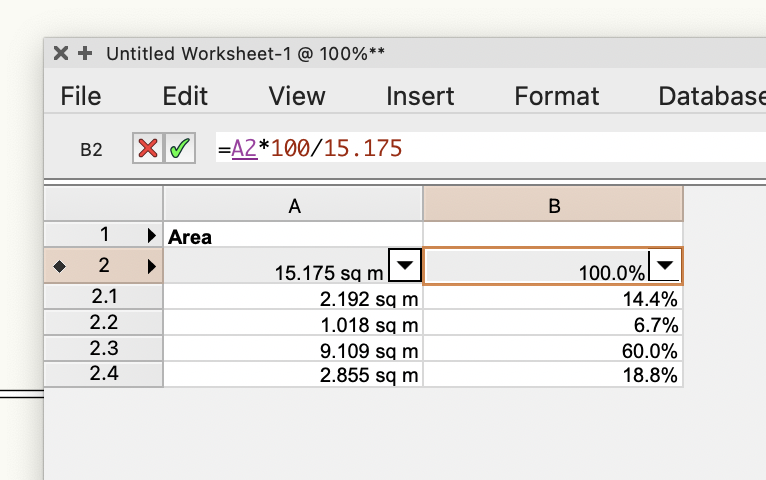
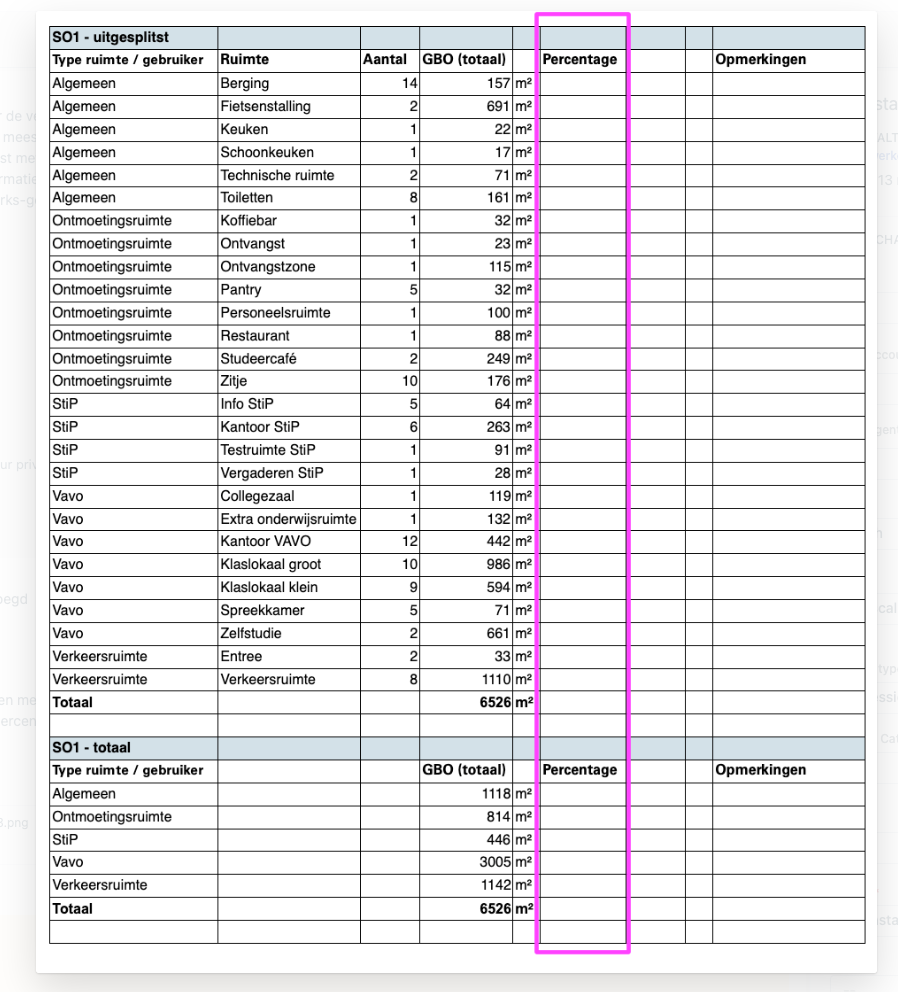
It should work. You need to put =[GBO (Total)]*100/6526 as the formula in the 'Percentage' column. Like this: Or am I misunderstanding you?
-
The seating tool is amazing, but did not work in this venue. Below this picture is a short video explaining the seat placement process of this venue as it is an irregular ellipsoid shape.

-
 Pedro Oliveira joined the community
 -
You probably meant the ‘seating’ tool.
-
I know this is basic, but cannot figure it out! I'm trying to create a custom report that includes the plant symbol. I have tried adding "image detail," "image misc," and image plant form, all to no avail.
-
No, I don't think this works, because the sum of the areas is in a data row, and then you get the repetition of what is in the data row in all cells below it.
-
 Hey y'all. i was wondering if you had any insights into why my model is giving me such dark spaces when I transition from Final Quality to Shaded. I've included a screenshot where you see the final quality being rendered in the middle versus the shaded quality in surrounding it. Any insights? There are currently 5 lighting objects with 3 overheads at 70% and 2 under lighting at 30%. I'm operating on windows, latest release.
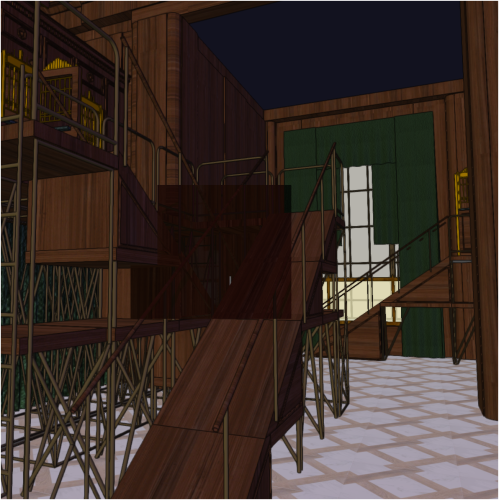
-
Thanks, Do you suggest putting a title block over the drawing in a Design Layer and the creating the viewports from that? Would I then still get the grid numbers and letters on my Detail Viewport or just the lines of the grid?
-
I think you would have to manually enter a formula such as =A2*100/[sum of areas] in column B. I don't think there's a way to do it automatically in a database i.e. without entering the sum of all the areas manually. But let's wait to hear what the worksheet experts have to say.