Search the Community
Showing results for tags 'worksheet'.
-
I am working on a renovation project that I have molded in 3D both the proposed and the existing using walls, roofs & slab styles. I want to collate the material date from the new element but not the existing. I have tried to attach a record to the walls, roofs & slabs that I want to be included in the take off, but can find a way to get this to come thought in the worksheet. I had set the critera must have the record, which then shows the number on elements that has the record assigned to them, but no material date come though. Any help would be appreciated.
-
Hello there... I have a worksheet listing all the windows in my project. What I want to do is to sort it by layer, using my layer stacking order (or story level) to do it. Of course I could use "=L" and sort it by name, but them I get something like 1º FLOOR.... 2º FLOOR... and only them... GROUND LEVEL. Is there a way out without changing "GROUND LEVEL" to "0 GROUND LEVEL"? That you mess with other worksheets I have... Thanks, VW 2014 Felipe.
-
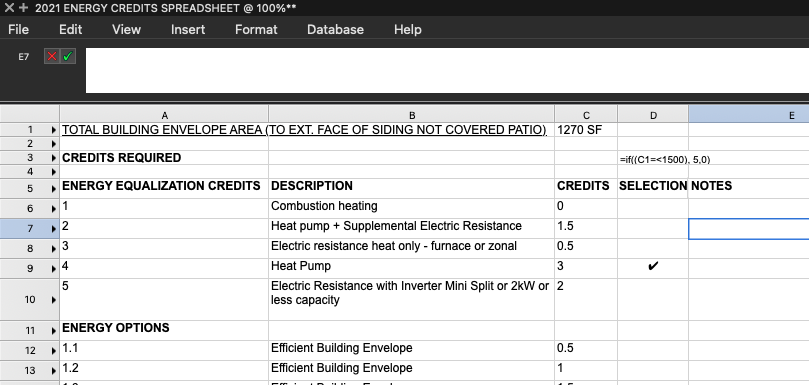
I'm working on an energy code worksheet and having trouble working out the if-then statement function: Basically, I want the worksheet to automatically say how many credits I need based on the area of the building. The area is shown in cell C1. In cell D3 I would like a formula that says: if the value in cell C1 is less than 1500 then display 5 (if the area is less than 1500 sq ft we need 5 energy credits), if the value is between 1500 and 5000 then display 8 (we need 8 credits for a 1500 - 5000 area), if the value is greater than 5000 then display 9 (for 5000 or greater areas we need 9 credits). I started with the if((logical_test), value_if_true,value_if_false) syntax: =if((C1=<1500), 5,0) but I'm definitely getting something wrong, it just shows the formula instead of a result. Does anyone know where I'm going wrong? Thanks, Kit
- 4 replies
-
- worksheet function
- worksheets
-
(and 1 more)
Tagged with:
-
Hi all, I am trying to get a total weight load of a hanging position Autoplot seem to be well liked by many for this but I have some items that display the weight load in gram event though the header is KG thus i was trying to use a position summary to get fixtures counts with load and also opening the Hanging position to select all the truss elements to paste the HP name in the truss position name field. So if this works out properly, i can make a worksheet summarize by position name and length with total count However, it appears empty when i put it on a worksheet Any idea why so?
-
Version 1.0.4
882 downloads
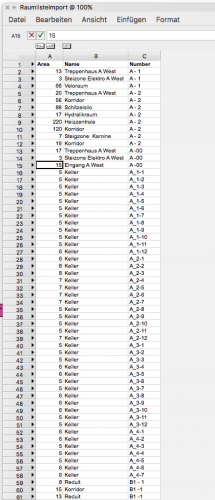
This Marionette Script creates multiple space objects from worksheet data. A very nice and time saving Marionette script to automate a routine peace of work. Please consider, that the the script takes the area column and calculate the square with that. If you have a language settings with comma instead of points for decimal seperator, the calculation will fail. Use points as decimal character or eliminate decimal places in your list -
Hello, Is there a way to show today's date in worksheet cell with spreadsheet setup? We are using this functions: =FORMATFIELD('Title Block Project Data'; '...') to get some data from title block border ... but would be great if we could add today's date too .... to the header of the worksheet layout with list of drawings (database part) as a main part of worksheet. I guess it doesn't have to be connected to title block border data, but all we need to get today's date displayed + so that it automatically updates to correct date. Any help much appreciated.
- 2 replies
-
- worksheet
- title block sheet data
-
(and 2 more)
Tagged with:
-
Is it possible to use conditional formatting on worksheets? Example 1: If a cell in a line meets a certain criteria I want the line to be highlighted blue Example 2: If a Boolean value is true, I want the text to be bold Example 3: If a record format number value exceeds a specific set amount, it is highlighted in red
- 6 replies
-
- worksheet
- formatting
-
(and 1 more)
Tagged with:
-
Hey, I'm currently trying to make a worksheet that displays lot areas with their numbers. I want to also display a building footprint on a separate column that is still within the same row as the area based on the respective lot numbers. Both the lots and the building footprints are spaces but they are on their own classes "Building Footprint" & "Lots". What I'm struggling with is that I can't seem to add more criteria to the columns to display AREA based on the class that the object is on. I've tried the code lines: =AREA(CLASS('Buildable Footrpint')) =AREA(CLASS='Buildable Footprint') But neither of these work. The second code line returns the value #OPCODE?. I've attached an excel spreadsheet with the general idea of what I am trying to achieve. The overall criteria for the database is: =DATABASE(INVIEWPORT & (INSYMBOL & (INCLSUBX)) & (PON='Space')) Thanks for the help.
-
Hello, we are trying to find a way with Pythenscript to Refrence VW-Worksheets a bit flexibel. We are having different Worksheets. We want to Refence one Worksheet with another Worksheet and trying to find out a way that Worksheetname for Reference can be flexible. At the moment with VW-Ref Function, the Worksheetname ist fixed and needs tobe changed if the Worksheetname has been updated. We also try to Run Python-Script in Vectorworks but not able to find out a way, how to retrive a PS result in a Worksheet. We are using this Function: =DATENBANKDURCHSCRIPT(120; 'Landschaft/Script.py') but unfortunately can not see what ist the output. We tried to find a Solution to List all our current Worksheet in some kind of Meta-Worksheet. The Python Script should iterate these objects and we would like to process the results within the RunScript Worksheet-Function but without success so far 😐: def list_all_tables(): # Eine leere Liste, um die Handles aller gefundenen Tabellen zu speichern table_handles = [] # Erste Objekt im Dokument h = vs.FActLayer() # Durch alle Objekte im Dokument iterieren while h != vs.Handle(0): # Überprüfen, ob das aktuelle Objekt eine Tabelle (Worksheet) ist if vs.GetTypeN(h) == 47: # 47 ist der Objekttyp für Worksheets in Vectorworks # Das Handle der Tabelle zur Liste hinzufügen table_handles.append(h) # Zum nächsten Objekt übergehen h = vs.NextObj(h) # Alle gefundenen Tabellenhandles an die Tabellenschnittstelle übergeben for id, h in enumerate(table_handles, start=1): vs.WSScript_AddHandleId(h, id) # Die Funktion aufrufen, um alle Tabellen aufzulisten list_all_tables() We would be very grateful for any tips or information 😃
-
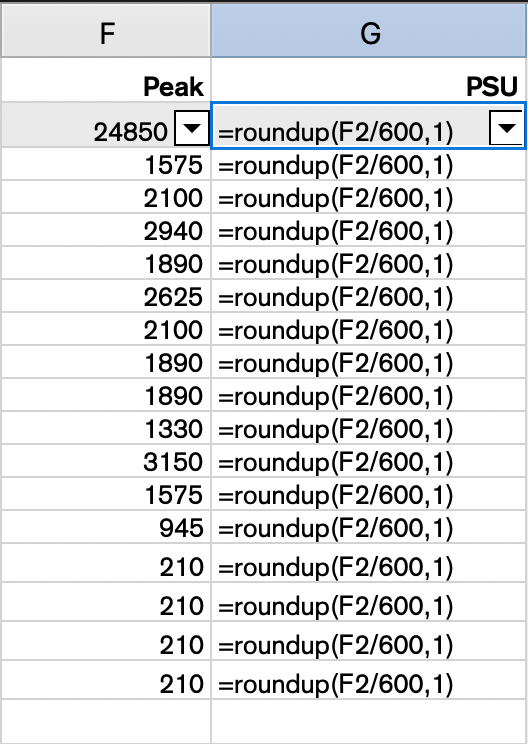
Hi I have a column with decimal values representing power consumption, in watts. In the next column I would like to know how many of my 600w power supply units I have to allocate. So I need to round up, but I cannot seem to make it work, it just writes out the formula indicating that something is not right. =ROUND(F2/600, 1) works , but rounds anything under 600 to zero. the worksheet function is documented as follows: roundup(number, digits) Rounds the specified number up to a specified number of decimal digits. =roundup(2.345, 2) returns 2.35 If I use the formula from the example, I get the same result, it just writes out the formula Any ideas? Cheers F
-
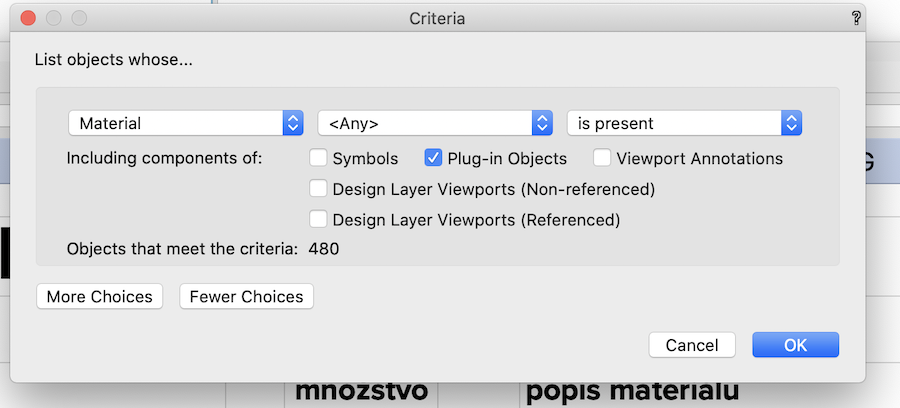
Anyone having difficulty to list in database worksheet materials that are part of wall or roof style components? I am able to generate list of <any> is present materia just those that are part of slab styles....? Any idea? Thanks.
-
Version 1.0.0
118 downloads
This example shows, how to create a record format with fields from an external csv or text-tab file with marionette. This example maybe needs the following know how which is not automatically is handled by the script: 1. Save Text with excel, open office or any other application as separated text file or tab separated text file. 2. Setup the "import txt" node-popup with the needed text encoding. Try utf-8, Latin1, macLatin_2 or other encoding to handle umlauts or special character issues. 3. The Exmaple just checks the first line of the text-file and creates record fields from them 4. The path to the text-input in the attached example is related to the document path. Save first your Vectorworks document. Or use an absolute path input. 5. No warranty or charge for this script, play first on a new file or on the attached file. I whish you success with it -
Recalculating a referenced worksheet when using design layer referencing breaks the referenced design layers. Vectorworks 2024 files are attached and a brief description. Bug Submitted. Vectorworks 2023 this wasn't an issue as worksheets were not referenced but replaced if on a referenced design layer import with the same name. Master File.vwx Referenced Worksheet.vwx Description.pdf
-
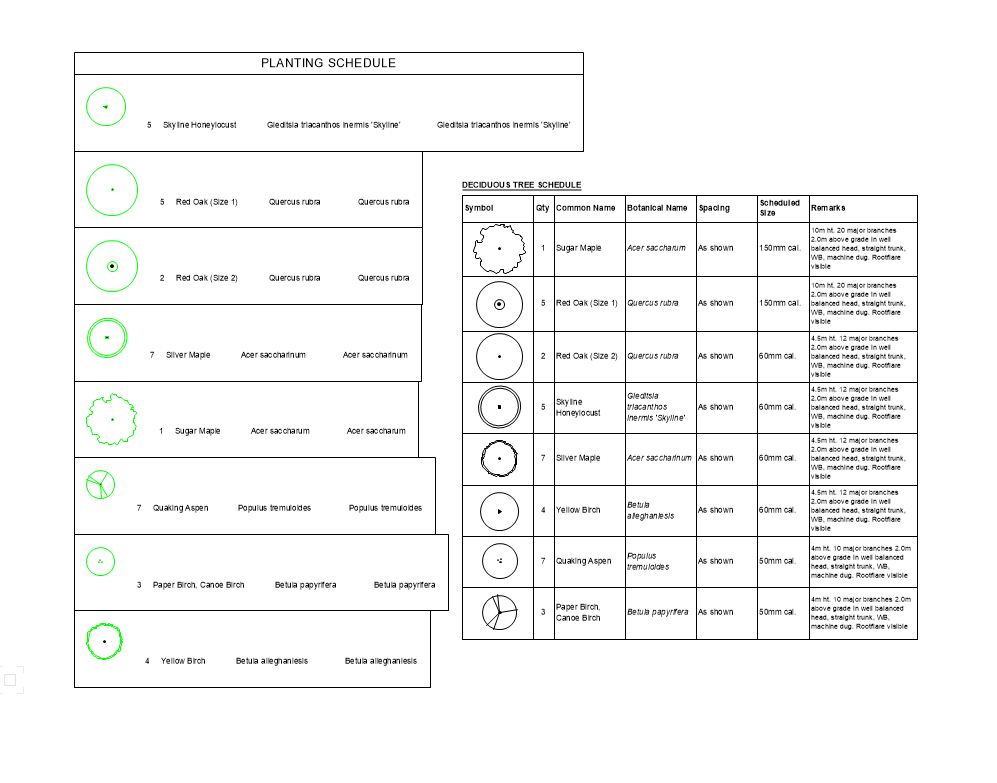
I'm experimenting with moving our planting schedule/legends from worksheets to graphic legends. I'm having an issue with the legend maintaining its size and the symbols aligning all on the center. What settings am I missing? Is it possible to manually adjust the list order? similar to how keynote numbering works? Based on the attached screenshot (the right image) can graphic legends achieve this? and are they ideally supposed to replace worksheets for this level of data? is there a way to connect the symbol with the correct lineweight and viewport setting into a worksheet? I know there is the image function... but it appears broken with not an accurate line weight. The current worksheet looks good. and is achieved by adding individual plant viewports and dragging them into place.. which becomes a tedious movement exercise prone to error whenever that sheet is updated.. I'm at a bit of a loss on how to speed up this documentation and looking for a few answers or recommendations on what is the best practice. thanks in advance
- 3 replies
-
- graphic legend
- worksheet
-
(and 1 more)
Tagged with:
-
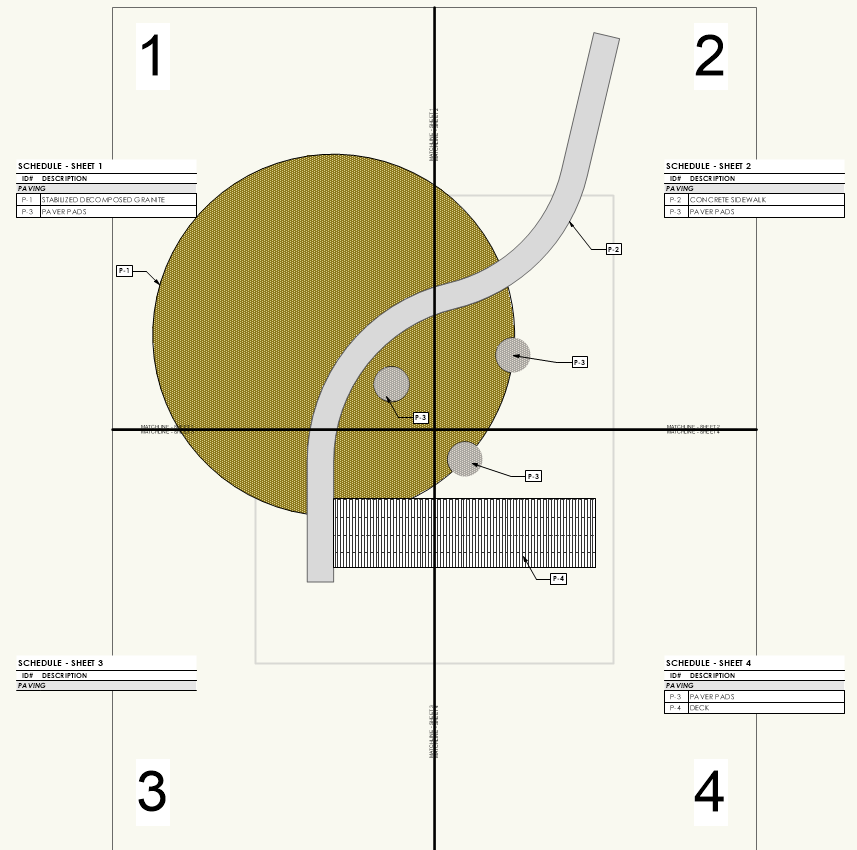
Alright VW Friends, we need some help troubleshooting a particular workflow that has become problematic. The challenge... How do you create a legend that is specific to the items being identified by Data Tags within a given viewport using Records and Data Tags? Because this is a technical question, I'm going to have to get into the weeds a little with our particular challenge. We have grown particularly fond of using specific custom record formats, coupled with data tags, to more easily manage callouts/keynotes in a drawing. It is very easy to create "Master" legends that summarize specific information in a variety of ways for all "similar" objects across a drawing/file using isolation techniques like class, record format, layer, etc. The difficulty lies in using the same record information to query a subset of those objects that appear in specific viewports, and exclude those that do not appear. In the landscape architecture world, it is not uncommon to have projects where improvements span multiple sheets and/or viewports. These are typically separated by match lines. In the image below, we have a simplified scenario where improvements are divided into (4) different viewports... Notice that there are (7) objects in the drawing, each attached with the same record format and identified using the fields ID# and DESCRIPTION. The large circle, which is actually clipped into two objects by the serpentine "sidewalk", exists in all (4) of the viewports. In the attachments to this post are exports of each sheet layer as an individual image where it is possible to see that data tags, placed in the annotations of each viewport, can easily identify the objects by their ID#. I've also attached the VW file used to create this example. QUESTION: Now...how do you populate each of the unique worksheets with the items identified by the data tags (or even those that are clearly visible in the viewport)? The goal, given this example, is to provide legends (worksheets) that should include items as follows: Sheet 1 P-1 P-2 P-3 Sheet 2 P-1 P-2 P-3 Sheet 3 P-1 P-2 P-4 Sheet 4 P-1 P-3 P-4 You will also notice that the legends (actually worksheets in VW) do not correctly indicate the objects that are visible...or even those that have Data Tags. Sheet 3 doesn't include any...this is because our methodology, up until now, has been to use the Location...is within criteria in each unique worksheet to query the objects that fall within shapes that represent each viewport (gray dashed squares). For example, Schedule - Sheet 1, is querying ALL objects with 1) Record attached, and 2) Location is within Shape 01 Schedule - Sheet 2, is querying ALL objects with 1) Record attached, and 2) Location is within Shape 02 Schedule - Sheet 3, is querying ALL objects with 1) Record attached, and 2) Location is within Shape 03 Schedule - Sheet 4, is querying ALL objects with 1) Record attached, and 2) Location is within Shape 04 The problem arises because the Location...is within criteria only successfully queries objects where the Center Point falls within the identified Object. This is why Sheet 3 doesn't return anything but should include P-1, P-2, and P-4. There are technically two P-1s in this viewport because the large circle is being clipped by the serpentine path, but both of their respective center points fall outside of the Shape 03. Similarly the center of P-2, the serpentine sidewalk, is in Shape 02; and the center of P-4, the rectangular deck is in Shape 04. We have various workarounds to try and remedy this situation using this "Location Based" workflow, but they are needlessly complicated and result in errors that are difficult to track down and timely to troubleshoot. They are not worth mentioning and the goal of this post is to try and find another, better way. It seams to me that a solution might already exist, but as someone who knows VW quite well, I have struggled for a long time to figure out what it could be. A solution that does work, but we want to avoid at ALL costs is...clipping the objects by their specific viewports so that each object is firmly located "within" each specific viewport. This is a terrible method because it destroys all sense of greater geometry, creates more opportunity for error, and does not facilitate easy revisions if geometries require editing. I could think of two solutions, but both are NOT CURRENT functionality within VW that I am aware of: Query Data Tags and Report Their Linkage - The problem with our workflow is that it is querying the objects...not the data tags. It is possible to place the correct data tags on each sheet, regardless of where the object's center is, and it is possible to build a query/report of specific data tags on a given sheet layer. What IS NOT possible is to link the query of a data tag to the data of the object it is tagging. Intersection Criteria - If, instead of the only location based criteria being available being either "Is Within" or "Is Not Within", potentially adding an "Intersects With" option could mitigate the issue of an objects center point driving the query results. This is functionality common to many GIS software programs and it is one that I think could benefit a lot of use cases... Calling all helpful users to help figure out the best workflow for this @Eric Gilbey, PLA @bgoff @rowbear97 @Tony Kostreski @Vlado @Pat Stanford VW Sheet Legends and Data Tags.vwx
- 9 replies
-
- landscape architecture
- matchline
-
(and 3 more)
Tagged with:
-
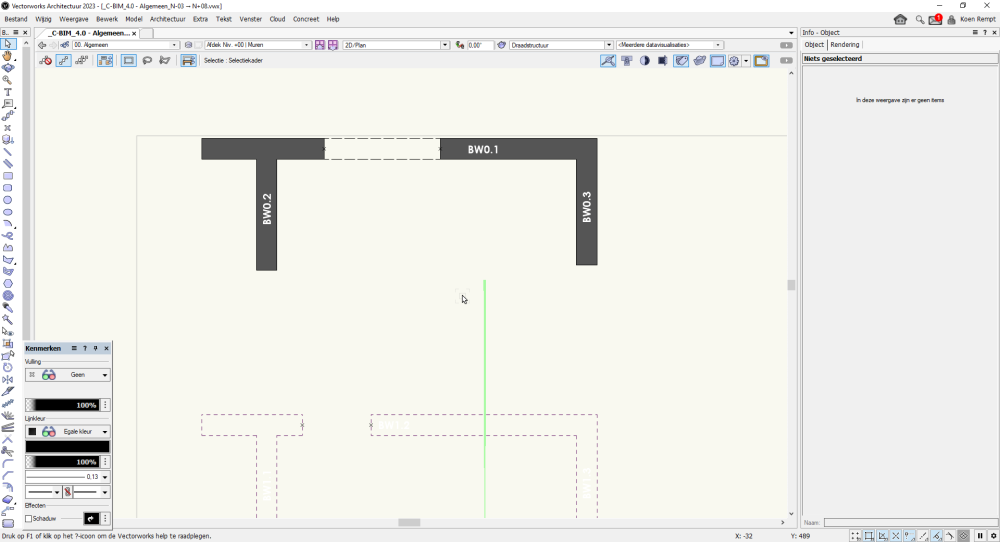
Hello, Is there a way to get de name of the wall where my door is inserted into a worksheet? In the example below my opening should return "BW0.1" so i can easily count the openings in all concrete walls. If not posible with a normal function i am a bit familiar with worksheetfunctions so that could maybe be an solution but this makes the worksheets realy slow so i try to avoid them as much as possible. Thanks a lot! 😄
-
We have window schedule (worksheet database type) reporting dimensions in feet and inches but would like to have it also in metric units as cm, m...Is there formula to do the convert? We have looked into worksheet functions and found 'ToUnit' but not luck so far to make it work. Primary file units are feet and inches. Thanks for any advice. Pavol
-
Has anyone worked out a way to add comment text to a worksheet cell where there's already math going on in that cell> e.g.: =($W$3*O16)*2 {W3 is type ModA, '2' is a kludge} I have tried (text) [text] {text} "text" !text and it just disables the function. Not being able to document complex worksheets is a pain and very unprofessional of VW to build such a thing. Also is there a way to view or export a worksheet to see which cells have links to other cells? Are either of these situations possible in newer versions of VW? System is VW2018.
-
I have about ten classes each of which includes a number of hexagons (ranging from one to about forty, and created using the Regular Polygon tool). VW does not retain Regular Polygon as a criteria object though so how do I count them in Worksheet? If it matters all hexagons are the same size 346m² A script would only be useful if the answer is written back to the worksheet, or another worksheet. I only use VW's workshet function so only looking for worksheet solutions, I've not had fun or success using the DB thing - and basically don't trust it not to profoundly f&^% up my drawings.
-
When I'm doing plant orders I like to colour cells once I know an order is complete for that particular plant. I do everything in worksheets as have never found the plant database thing useful to how I work. Doing this manually is tedious: 1 select cell 2 right click 3 format 4 select format tab 5 dropdown 6 solid 7 Select colour 8 Ok I do not yet work with Marionette but have seen a few work nodes that mention colouring worksheet cells, but haven't found anything like this.
- 3 replies
-
- marionette
- worksheet
-
(and 1 more)
Tagged with:
-
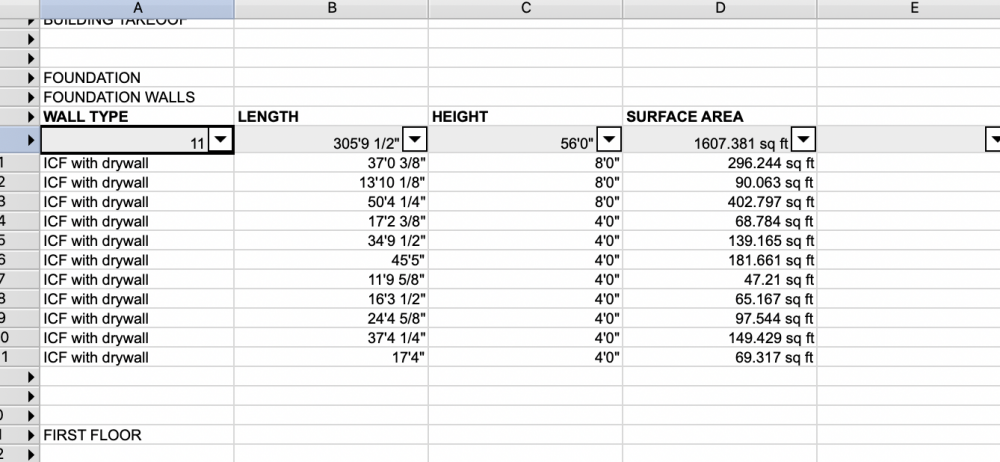
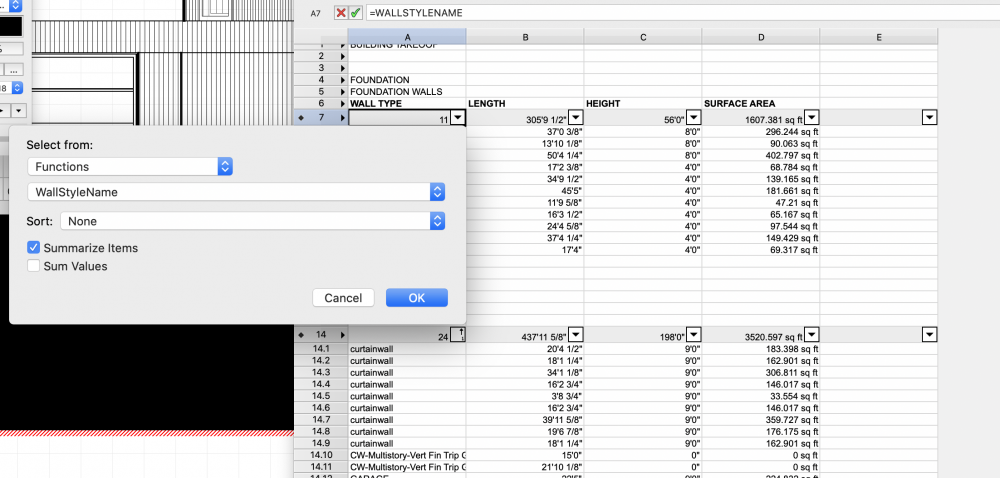
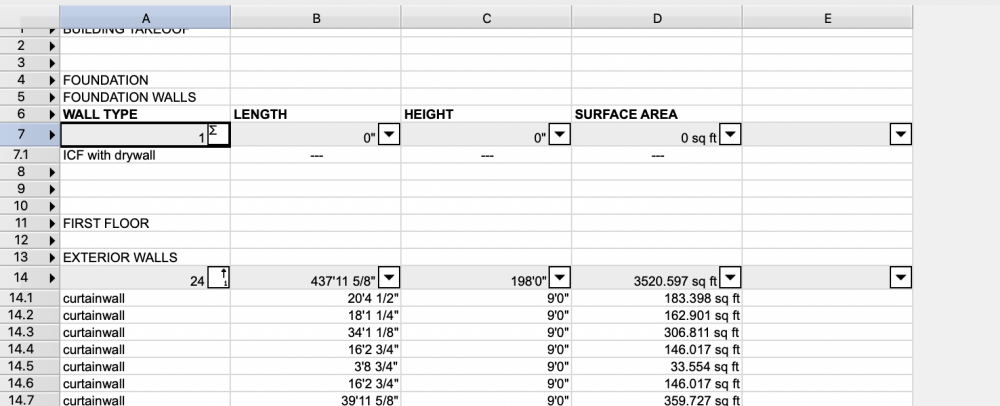
Hello all I am new to worksheets and have been following a tutorial to set one up for building takeoffs of my project. I have started with the walls and have been able to create the worksheet with no issue except when I try to summarize the walls based on wall type. When hit summarize all of the data no longer shows, so it doesn't provide a Toal wall length or area for the summarized wall type. See the attached images below Does anyone have any idea what step I am missing? Thank you
-
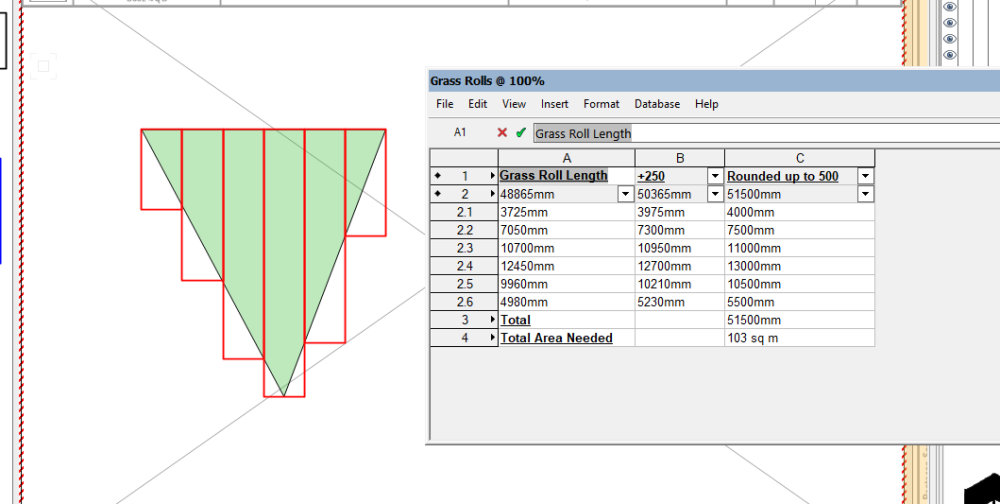
Hi, I have been looking into using worksheets to show the lengths of rolls of grass needed for plans that we are working on. We usually just show the grass rolls as red rectangles overlaying the shape of the grass we want to cover and use the dimension tool to show the length, but due to needing to now include additional information, it makes more sense to show it all in a worksheet. I have attached an image of the space below and the worksheet showing the length of each roll, moving from left to right. Is there some way that I can label each roll with a number or letter (1-6) and show those numbers on the worksheet so it can be easily referenced?
- 2 replies
-
- worksheet
- worksheets
-
(and 3 more)
Tagged with:
-
I have a worksheet of plant counts by area - see attached. Each block of text in the worksheet is a plant label for one polygon. What I want to do is sum the totals for each species across the different label areas. I want to do the summing in another worksheet so I can send a nice tidy list to my plant supplier and planter. I have highlighted a couple of plant names to illustrate this, e.g. I want to get the total number of sophora microphylla across all labels. I imagine I need an if statement (or similar) in my other worksheet that whenever it comes across Sophora microphylla it goes across 2 columns, gets that number and adds it to a running total - I wouldn't have a clue how to do this but no doubt someone here else has with an inventory or related problem. In the final case there may be ~ 100 labels. I'm using this method as it works best for my sites and far faster and less complicated than the plant tags landscape areas, also this way I can skim backwards and forwards through the different areas in the table. I don't really want to use vectorworks’ database, but I trust the worksheet system.
-
I want to shorten and join strings like this 'Coprosma hawera ' that are in a single cell to CopHaw and have them in another worksheet cell. The case would be nice but it's not a must-have. Has anyone solved this. VW screenshot of what I want to see. Excel example enclosed below, but I wouldn't have a clue how to do this in vectorworks.
-
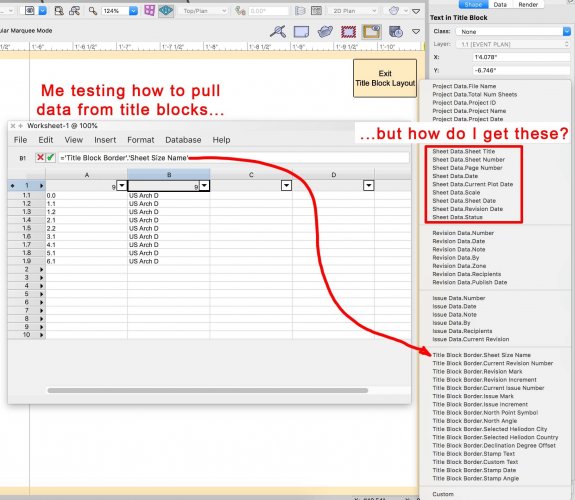
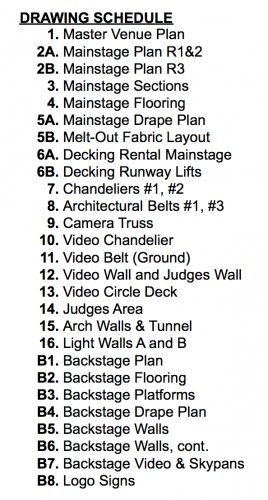
Ever since Title Blocks were revamped a couple years ago, I've been unable to create a simple Drawing Schedule (list of sheets) as a worksheet that's linked to my Sheet Layers / Title Blocks. It used to be as simple as pulling record fields from the Title Blocks, but that doesn't seem to work anymore, so I'm obviously missing something. Note that I DO NOT want to use Tools < Reports < Create Sheet List, as this creates an unlinked worksheet (an idea with I completely loathe). In my workflow I constantly re-name and re-number sheets throughout a project, so I need a worksheet that is always up to date without having to manually do anything. I see that it's possible to pull some data from TBBs, as seen in the screenshot of my test below: All I really need is 'Sheet Data'.'Sheet Title' but that doesn't seem to work? For my first column I just used =L in the column header which works fine to pull the sheet layer number. Here's an image of my simple goal, which I had in VW2017: @Nikolay Zhelyazkov @Pat Stanford
- 26 replies
-
- 2
-

-
- drawing schedule
- sheet list
-
(and 3 more)
Tagged with:


