bob cleaver
-
Posts
245 -
Joined
-
Last visited
3 Followers


Recent Profile Visitors
4,708 profile views


-
How can I adjust the Z elevation after using the 3D loci marionette
bob cleaver replied to bob cleaver's question in Troubleshooting
Is it the best practice to store the marionette script (Test Proximity and Text to 3D Loci 1.0.00) in a script folder on the favorites file ? -
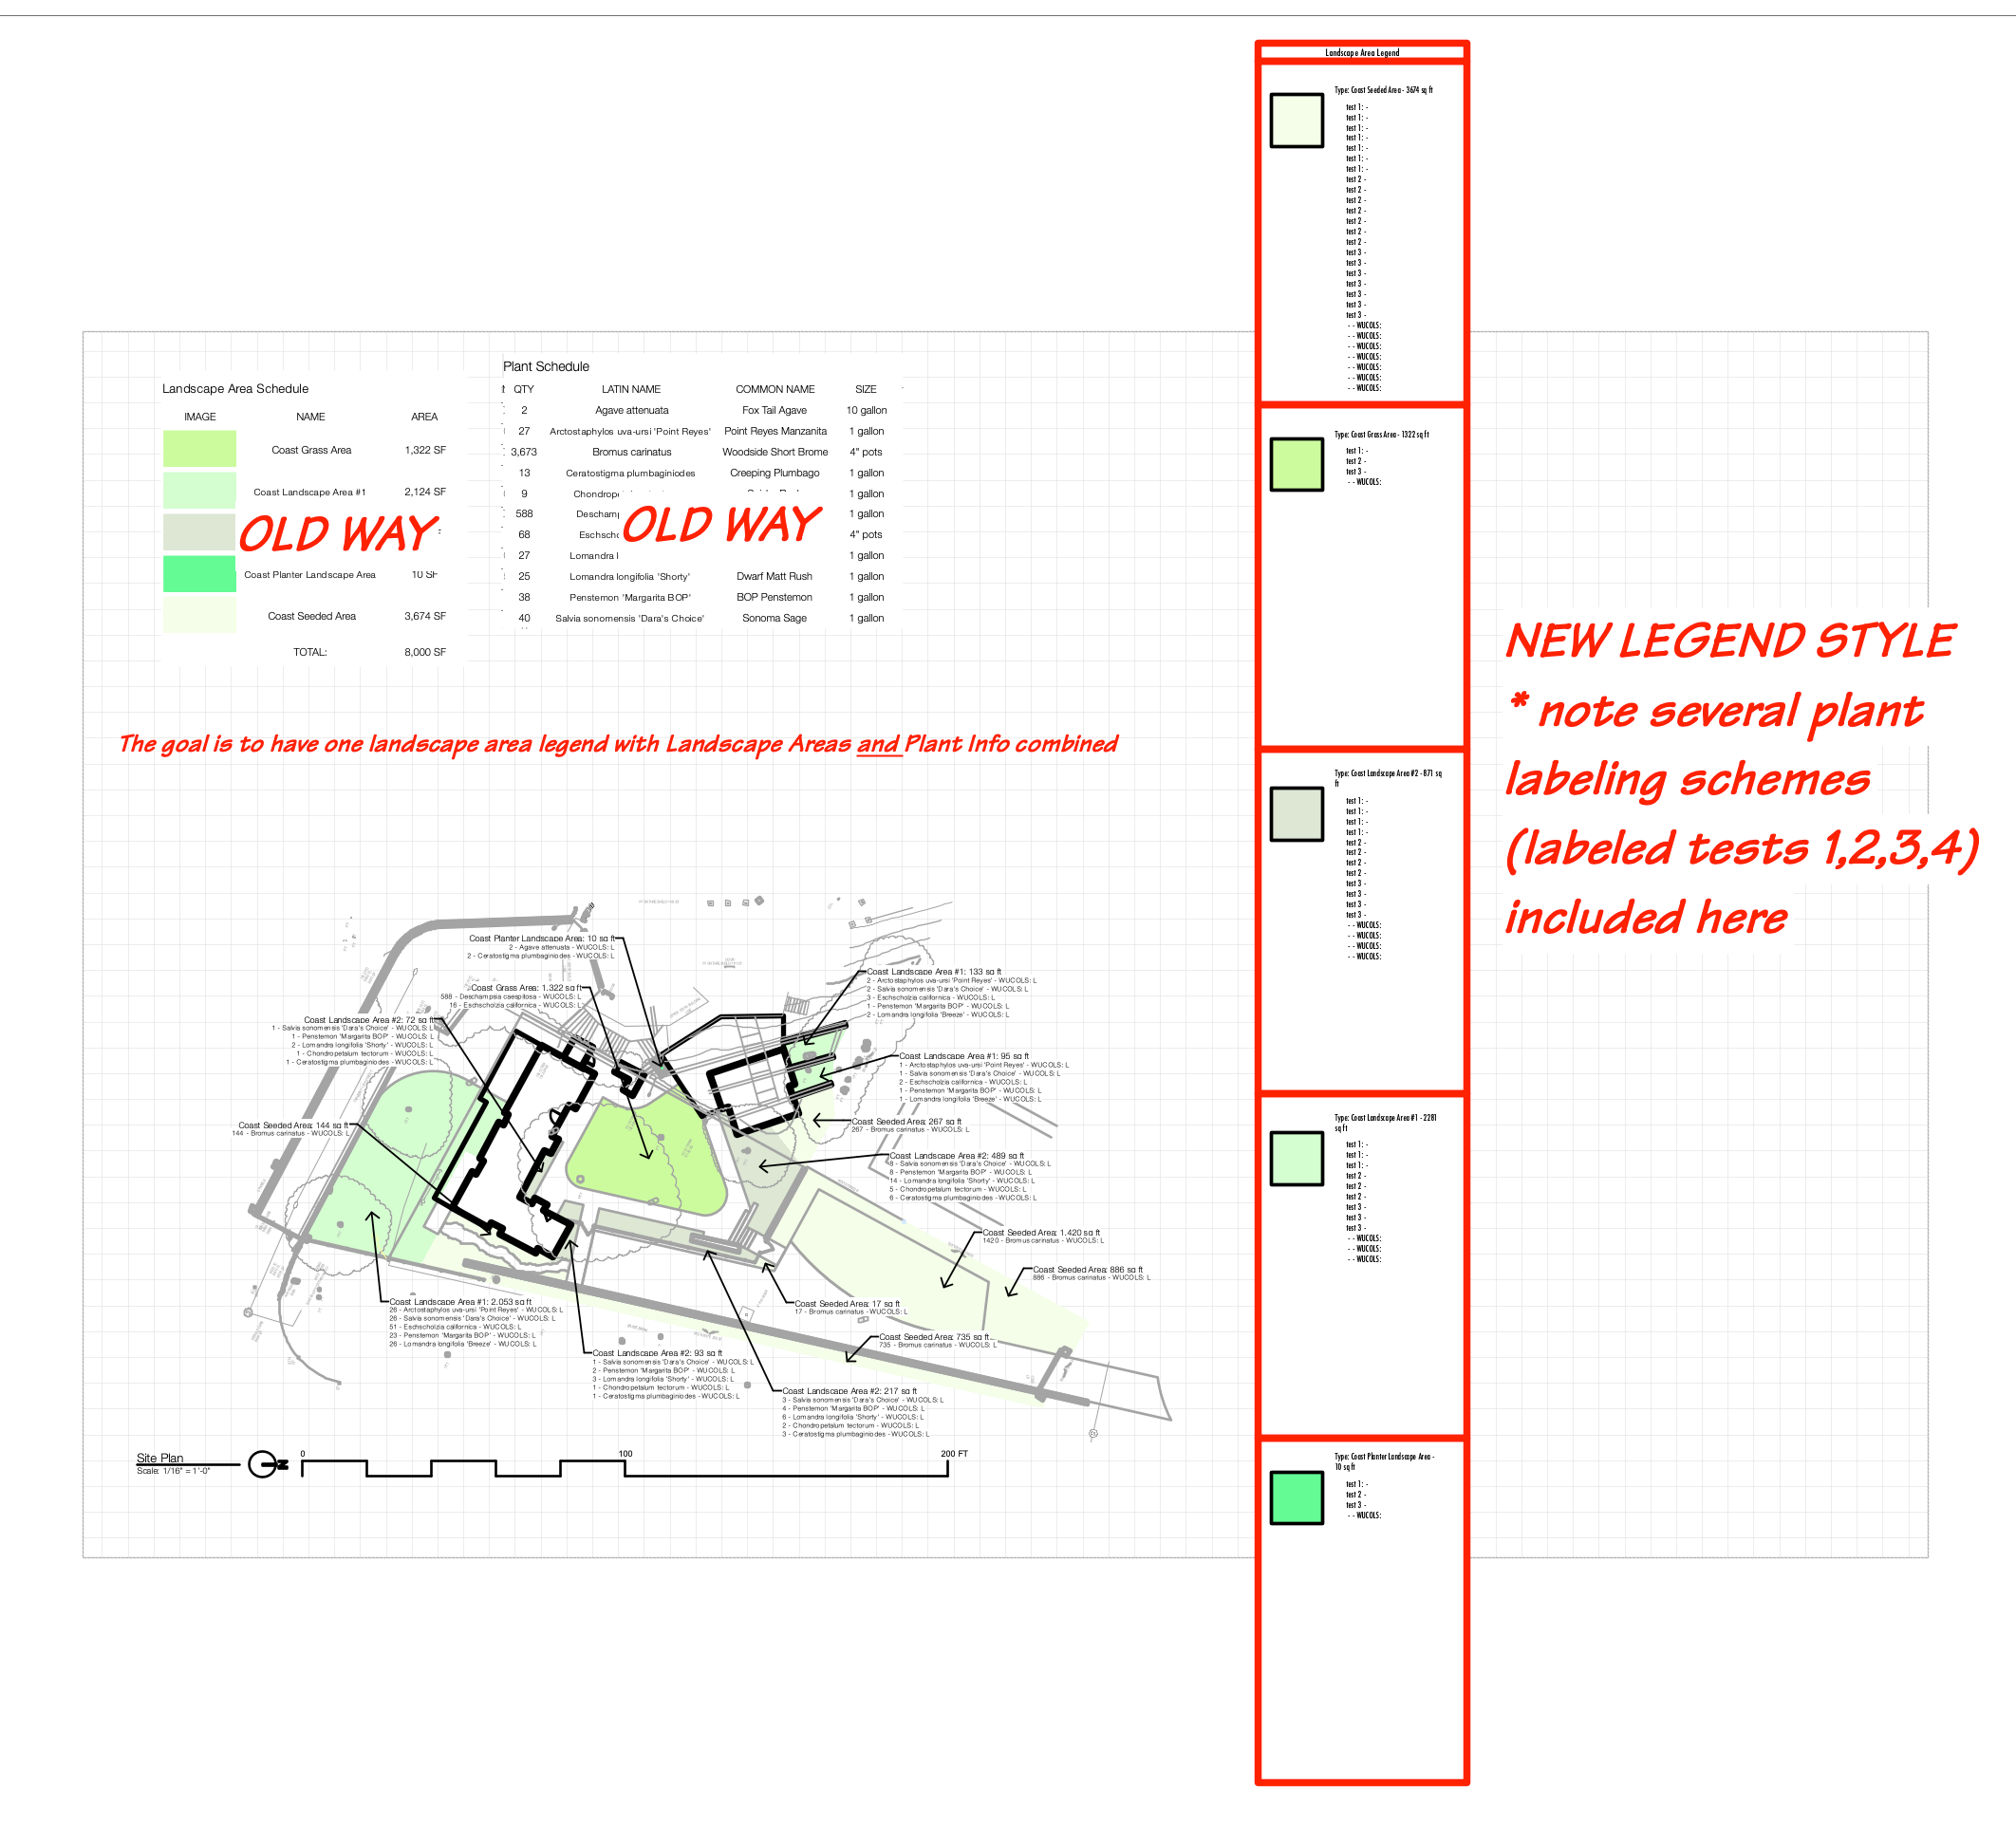
Would you consider using the wall tool for the edging and then be able get lengths for edging takeoffs. The hardscape tool will not provide lengths that are accurate as the wall tool. A future improvement from VW would be welcome.
-
Test Proximity and Text to 3D Loci 1.0.0 and the results are the Z values are in inches and they should have been in feet. What is the process to adjust the only the Z values by a factor of 12 ?
-
Test Proximity and Text to 3D Loci
bob cleaver commented on SBarrettWalker's file in Marionette - Networks
 The marionette works !! but the resulting Z values / elevations were inches and the X and Y values are in feet - Is there a Z height multiplier or ................
 -
Pull a scaled Symbol's scale into worksheet
bob cleaver replied to bcd's topic in General Discussion
I am curious why this data is needed for a worksheet. Is the scale for the objects an 'in house' info or for another purpose ? -
I have tried to use worksheet labels to summarize the length of pipe and number of emitters per control valve. I feel this would be good info for pricing construction. Separately, is there a way to color code drip tubing for each valve ? use classes ??
-
Worksheet not picking up landscape area plants
bob cleaver replied to Nic_Berry's topic in Site Design
Chapeau to Vectorworks !! -
Worksheet not picking up landscape area plants
bob cleaver replied to Nic_Berry's topic in Site Design
@Tom W.I have never clicked on the Display Data Settings field until now and WOW ! this is a brilliant workflow - thank you !! -
Recommendation: I am using the Smart Options Display to have access to 4 toolsets I am a landscape architect - the Toolsets I access: Irrigation, Dim/Notes, Softscape, and Hardscape The easy access using the shift key is working well !
-
Benson I feel like I gave you short shrift with my earlier post. You always ask great questions and always support others. In order to use the balance cut and fill appropriately, the rough grading would be for pads and add paving, building, drainage swales, mounding and site sculpting. Developing a set of tools to use to develop site modifiers would be key to making a landscape architects grading design valuable. Benson, thank you for all your efforts on this forum !
-
In California, civil engineers dominate the grading review process. Landscape architects can provide 'grading studies' but are not recognized in municipal submittals for grading. I like to provide grading studies but never develop balanced cut/fill review - the balance concept is valid but so many geotechnical considerations are required to ascertain how to provide a balanced site (is the cut valid for fill, what are the sub grade needs of paving and structures, drainage requirements such as swales and bioretention basins for retaining site water on site, etc). The details of balancing a site at a schematic deign level make balancing a challenge -
-
Understood ! it sounds like a creative script could help @Tamsin Slatter @Katarina Ollikainen your review is appreciated !
-
Thank You Pat ! Any time is appreciated I have not succeeded with this - I have tried a few different options to no avail - My next attempt was to allow ‘any’ instead or ‘all’ in the conditions filter
-
can you use an existing tool like the wall or fence tool to have lengths available for reporting.
-
A screenshot of the sheet: