


The Hamma
-
Posts
360 -
Joined
-
Last visited
Content Type
Profiles
Forums
Events
Articles
Marionette
Store
Posts posted by The Hamma
-
-
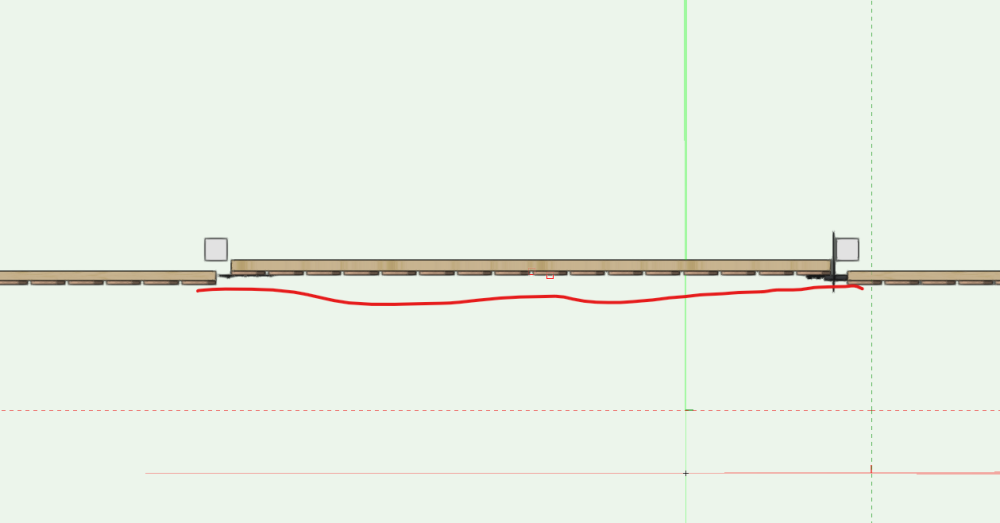
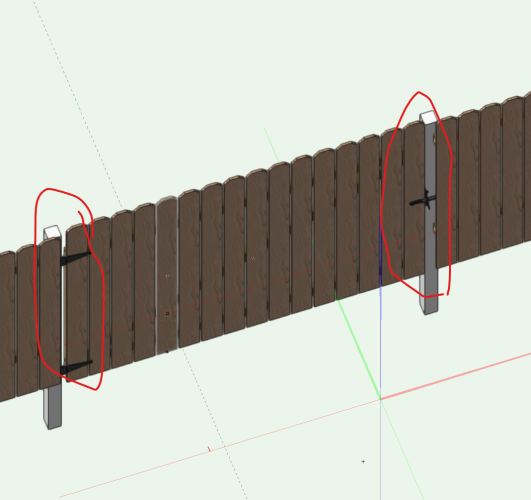
I may have missed this but I have modified a wood gate to be on the correct side of the fence but I can not make it flush out with the face of the gate or elimate the gap between the center of the post and the gate. Anyone have a way to do this?
-
@Jesse Cogswell, I just found this script and it is awesome. Just wanted to make everyone aware that besides the issues as noted by @MarcelP102 above the script also does not work well when the user origin is not the internal origin. The symbol will displace and the symbol's internal origin will also be offset.
Jesse if you figure out how to fix the origin issue please let me know as I have a drawing label aigning script that also has the same issue.
-
On 3/24/2024 at 1:08 PM, Maury Jensen said:
Did you ever get a solution for this? I'm needing to do the exact same thing you described in this post, but have not been able to find the right solution.
Sorry I gave up on this.
-
15 hours ago, martigues said:
@scottmoore I actually used yours as a starting point for mine, and created a few more commands and I made the keys in Affinity. It is a fun process once you get the hang of it.
Some keys I made by changing the command shortcut in my Workspace, but for a majority of them, I used the power search workflow. I tweaked some of the timings to where they all still work very well.Once you get a pattern going, it is easy to set up. My setup has 3 "pages". A main functions and two sub folders, one for Spotlight and one for ConnectCAD.
Try it out everyone, and let me know what you think.
My next project is setting up my iPad as a 64 key Stream Deck for an MA3 PC.
I installed this profile on my Window machine and none of the commands work but all of the instructions are correct. It appears the hotkey functions are not interchangable between Windows and Mac. If I replace the "F" hot key with a "F" it processes half of the command. I have to replace the "Return" hot key with a "Return" and it processes the entire command. Not sure why they are different.
-
2 hours ago, Mark Aceto said:
Platform-agnostic across Windows / Mac
Yes I think this should be Platform- agnostic but it is slower than the method that I just posted that uses the two plugin scripts which should also be Platform-Agnostic but I have not tested it on a Mac.
16 hours ago, The Hamma said:Here is my Stream Deck Profile for the Standard Architect Workspace. I requires that you add the two attached plugins to your workspace and set their shortcuts as shown
This version uses the names of the Commands, Tools or tool indexes rather than shortcuts except for the shortcuts for:
16 hours ago, The Hamma said: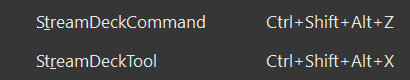
Which it uses to call the plugins and awaits the name of the tool which is sent from Stream Deck
Menu command call (note if there is not a chunk number you must add 00 to the end of every command, if there is a chunk number enter 01 for 1 and 10 for 10)
Tool Name Call
Tool Index call
-
 2
2
-
 1
1
-
-
Link to the my stream deck profile that I posted.
-
Here is my Stream Deck Profile for the Standard Architect Workspace. I requires that you add the two attached plugins to your workspace and set their shortcuts as shown.
Feel free to re-arrange as you see fit.
 v
v
-
1
-
 1
1
-
-
Thank you.
1 hour ago, MullinRJ said:Hello David,
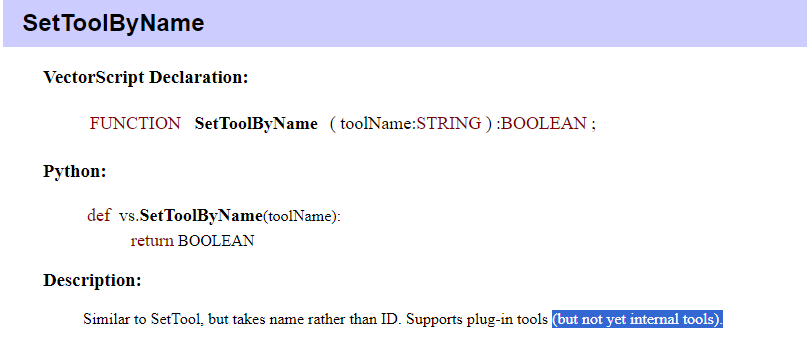
I found constants for the Slab Tool (-248) and the Wall End Cap Tool (-355). I did not find constants for the Door or Window tools, but those two can be called with CallToolByName() or SetToolByName(), as Pat mentioned.
-
On 1/12/2024 at 2:49 PM, Pat Stanford said:
B1:=CallToolByName('Door Tool');
B1:=CallToolByName('Door Tool');works.
Ok I was wrong about "Window Tool" and "Door Tool" being internal commands, but the other two "Slab Tool" and "Wall End Cap Tool" do not have pugins and can't be called.
-
On 1/12/2024 at 7:58 PM, SamIWas said:
I was getting excited to write my own shortcut selector for my StreamDeck since the native shortcut system is almost full. But I can't do it if it won't actually select the tools.
This is actually what I’m working on. I have written two, scripts that I use to call the functions from stream deck with a shortcut. It calls the script and then has user input for the tool name. This is where I have stream deck, enter the name of the tool. Or the index. Which then is executed by the script.
my scripts are attached.
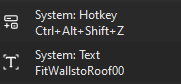
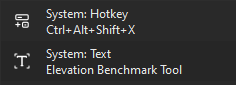
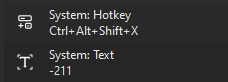
I am using control+shift+alt+X for the tool shortcutAnd control+shift+alt+Z for the menu shortcut
If I ever finish my stream deck profile, I will upload itPROCEDURE StreamDeckCommand; {Input the command name with the index at the end of the name. Use two digits for the index name. ie. for 1 use 01 for 0 use 00. Print command would be "Print00", Font Size 4 command would be "Font Size01" and Font size 144 would be "Font Size17"} VAR SDstring,SDStrInt:STRING; SDLen,SDInt:INTEGER; BEGIN SDstring:=StrDialog('Command to run',''); SDLen:=Len(SDstring); SDStrInt:=Copy(SDstring,SDLen-1,2); SDInt:=Str2Num(SDStrInt); SDstring:=Copy(SDString,1,SDLen-2); if SDstring <> '' THEN DoMenuTextByName(SDstring,SDInt); END; RUN(StreamDeckCommand);PROCEDURE StreamDeckTool; {Either input the tool name or the tool index} VAR Istool,SDstring:STRING; Result:BOOLEAN; BEGIN SDstring:=StrDialog('Command to run',''); Istool:=Copy(SDstring,1,1); if SDstring <> '' THEN BEGIN IF Istool = '-' THEN Result:=SetToolbyIndex(Str2Num(SDstring)) ELSE Result:=SetToolByName(SDstring); END; END; RUN(StreamDeckTool); -
Looking at the Vectorscript reference it appears that SetToByName does not support internal tools and some of the "internal tools" do not have and index.
Is there any way to set the current tool using a script to those "internal tools" that do not have an index?
Tools that are internal without indexes are but not limited to:
"Door Tool""Window Tool""Slab Tool"
"Wall End Cap Tool"
@Pat Stanford@Jesse Cogswell@MullinRJ
-
4 hours ago, Wood said:
Very clever!
Anybody with some fresh stream deck profiles willing to share?
I am working on building a complete profile for my highly customized Architect workspace. The problem is that my space uses many custom keyboard and stream deck doesn’t make it easy to change a command from a hot key command to a multi action. It would be better if there was a way to invoke a command in a quicker way than using the "F" (Quick Search window) function then I would program every function using said quicker way.
-
On 11/14/2023 at 3:32 PM, jbtroost said:
If I can be of any help in beta testing the Meta-version of the Nomad app, please let me know!
Me too!
-
Perfect! Thank you.
-
- Popular Post
- Popular Post
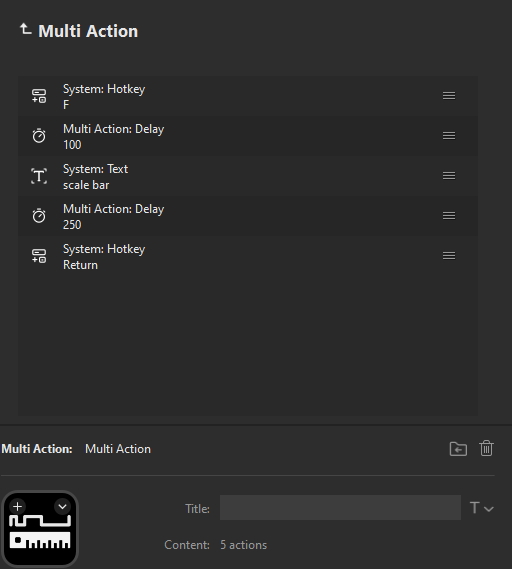
FYI I was able to create a Stream Deck command to run any command of your choice from the Stream Deck.
I did this by creating a five step multi action using the "F" (Quick Search window) function in Vectorworks.
1. Press the "F" Key
2. Delay 100 Milliseconds
3. Type the name of the command (This example is "scale bar")
4. Delay 250 Milliseconds
5. Press the "Return" key.
-
6
-
1
-
I am trying to set a worksheet database to display only (Exterior Walls)
I can't seem to get the formula right to incorporate the following
=DATABASE((T=WALL))
&
=OBJECTDATA('EXTERIOR'=1)
-
@Samuel Derenboim Would you mind sharing the table that you show above?
-
Here’s a file with a bunch of AWI Millwork profiles
-
3
-
-
4 hours ago, Gadzooks said:
Any chance this will work on 2018?
It appears to work fine in 2018. 2018 version is attached.
-
1
-
-
- Popular Post
- Popular Post
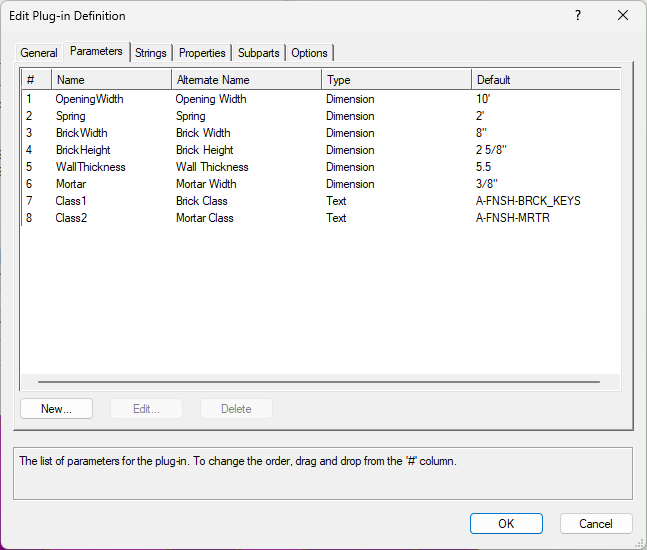
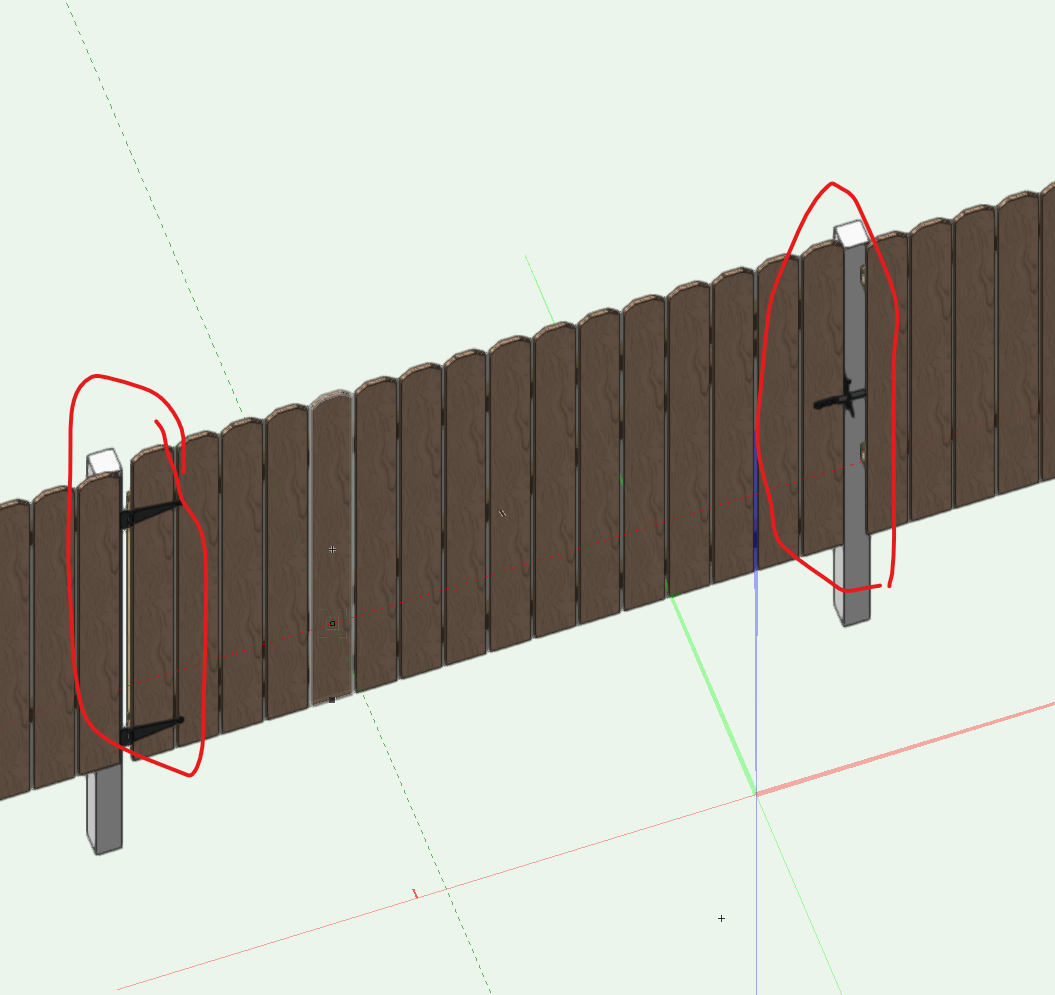
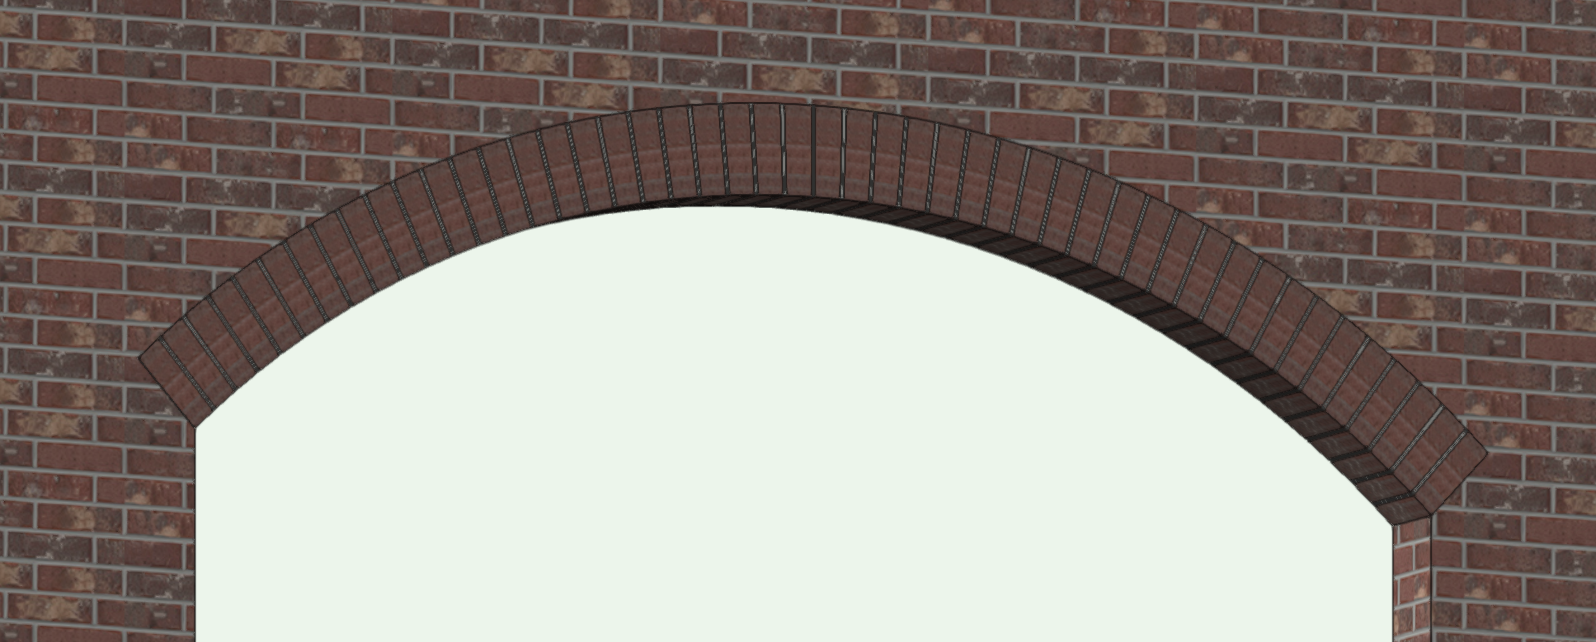
Here is a Brick Arch Tool that I made.
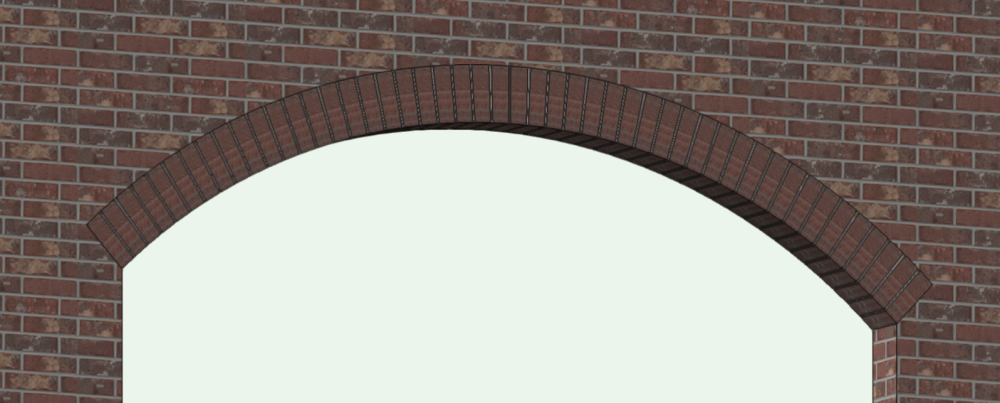
Parameters are as follows. Script will import Class1 and Class2 from the Class.sta file that needs to be located in your user or workgroup folder at "...\Libraries\Defaults\Standards"
These classes have the textures assigned. The script creates a symbol for each arch with different parameters.
-
13
-
1 hour ago, Monadnoc said:
Will this work on VW 2017 by any chance?
It did have a command that was new and did not work but it was not necessary for the fence to work. It also appears that 2017 is plagued with the same document units bug that affects 2023. This file works in 2017 but it set to use "Feet" or "Feet and Inches". If you change the document units the fence will create the wrong number of pickets. If you use another Document Unit let me know and I can convert one of the "picket and post" files above to 2017.
-
1
-
-
On 7/13/2023 at 12:43 PM, The Hamma said:
Updated 07-17-2023:
One of the rails was not using the class attributes. This error has been corrected. If you downloaded it prior please download it again. Only "Picket Fence.vso" has changed.
-
Until the bug is corrected I have attached the unit coverted files in case anyone else uses other unit standards.
Pickets and Posts Yards cm.vwx Pickets and Posts Yards km.vwx Pickets and Posts Yards Meters.vwx Pickets and Posts Yards Microns.vwx Pickets and Posts Miles.vwx Pickets and Posts MM.vwx
-
1
-
-
@Tom W. It appears to be a bug with Vectorworks. But for the meantime you can replace the Picket and Post file with the attached MM converted one attached.
-
2
-
Streamdeck integration.
in Wishlist - Feature and Content Requests
Posted
The one "above at this link" is the latest one that has not been custimized to my personal workspace. Any reason why you want me to repost it?