Pat Stanford
-
Posts
12,626 -
Joined
-
Last visited
Content Type
Profiles
Forums
Events
Articles
Marionette
Store
Everything posted by Pat Stanford
-
Mac OS Sonoma 14.4.1 makes VW2024 unusable
Pat Stanford replied to astephens's question in Troubleshooting
-
If you are doing Layer Referencing, then I believe this is the expected behavior. When the layer reference updates it deleted all data from the layer and brings in the new data. So anything you have manually added to the reference layer will be lost. You will need to add a non-referenced layer to place your objects on.
-
For the first question, there are a number of items in the Channel Parameter Record that we have no idea of HOW they are being used internally in the object. I think it is to save the data so when you switch from one type to another it is already populated correctly. And yes, it is just kind of trial and error to figure out which field has the data you need. I don't understand the last question. Can you post a small test file with a couple of objects with your different record formats and the spreadsheet that is not doing what you want and I can take a look.
-
How to show today's date in worksheet with spreadsheet setup
Pat Stanford replied to drelARCH's topic in General Discussion
Or create a single line Vectorscript: WSScript_SetResStr(Date(2,0)); In my case this was named Script-2 So I used a worksheet formula of: =RUNSCRIPT('Script-2') The parameters of the Date Function are for the Date and Time formats. For the first Parameter, 0=Full Date, 1=Abbreviated Date, 2=Short Date For the second Param 0=Date only, 1=Date & Time, 2=Time Only The date is formatted according to your operating system settings. I thought there was a way to enter a single line script like this directly into the RunScript function, but I can't make it work this morning.- 2 replies
-
- 1
-

-
- worksheet
- title block sheet data
- (and 2 more)
-
='Channel - 3D'.'__size_1' ='Channel - 3D'.'__size_1' ='Channel - 3D'.'__series_1' The field names might be different if you switch to a different Series. Easiest way to find things like this is to make a dummy report in a worksheet and add all the fields in. Find the columns that have the data you are looking for and then look in the header row for the field name.
-
Apple macOS 14 Sonoma Compatibility - Feedback
Pat Stanford replied to JuanP's topic in News You Need
1. VW2022 is still completely compatible with everything that was available when it was shipped. 2. Blame Apple. They are the ones who have changed the OS in such a way as to break older software. -
There only are if they have developed them themselves based on some need in their localized content. Anyone can extend Vectorscript by writing a VWLibrary extension. How you would do that beyond the fact that I believe it requires SDK programming is beyond me. There is a CWLibraryUniversal1.vwlibrary that is included in my version of VW. Probably due to the fact that the the Stair tool (and others) are actually CW code that has been licensed back to VW for inclusion in the base version of VW.
-
The length is stored in the Channel record. ='Channel - 3D'.'Length' The default Length, Width, Height worksheet functions will give you the orthogonal distances. Length is the X dimension, Width is Y and Height is Z. They will report on almost any object, but if the object is not aligned with the axis, it probably won't provide useful data.
-
I do not see those items in the stock VW2024. In the Miscellaneous category of the Script Editor window I do see a number of CW_ functions, but none related to matrices. I know the Computerworks (the German distributor) often prefixes their commands CW_ My guess is the CE_ is something similar and is not provided by Vectorworks directly but rather by the localizer or some other other source. CE_ may very well be Computer Express who I believe is the Swiss distributor. There is not a Miscellaneous category in the stock Function Reference documentation.
-
What function reference are you looking in? I can't find those functions in the version shipping with VW2024 nor in the on-line Developer version.
-
Maybe also look at ForEachObjectAtPoint which allows you to specify a radius rather than needing an absolute point. But I think you are correct about having to pass world coordinates not PIO coordinates.
-
Worksheets on their own can only report on objects that are not in the drawing. Being in the Resource manager is not enough. While it is possible to use a DatabaseByScript to create a database of Resources, unless you are comfortable with scripting it is not a good idea. All Sorting and Summing have to be done in the script. You can't use the usual database controls. Sorry.
-
I think the poly is "consumed" during the creation of the slab. If you need to use the poly after the slab creation I think you need to duplicate the poly first. I am not certain if the "copy" or the "original" will be the one retaining the UUID. I think when you make a copy in VW, the copy is the one that ends up selected and the original is unselected. Or maybe it is the other way around.
-
@MullinRJ Thanks for the help. I THINK I could have done this, but your explanation is so much clearer than mine would have been. And at the time, my brain would not tell me how to make the original vectors/points. Thanks for the refresher.
-
I don't think associations require Event Enabled. Unless you want something like delete tag on delete object.
-
Your file has no interiorcad objects, so I can't see if the database is selecting them properly or not. I need a file with a few samples (2-4) of objects to meet each of the two database criteria.
-
In the Debug List View Explorer, it shows that the PIO is included in Data Tag. But that may just be in the file and not how it is drawn. 😞
-
HScale2D setting the center of the scale at the point you want to keep fixed and then just set the scale factor per the difference between the current length and new length. @MullinRJWill probably chime in here soon with an easier way to do this using vectors. 😉
-
Impossible to change the size of an object with an arrow in 2D
Pat Stanford replied to Margarita's question in Troubleshooting
Yare probably in the first mode of the Selection tool, Non-Interactive Scaling. Choose the second (single object interactive scalintr) or third mode (multiple object interactive scaling).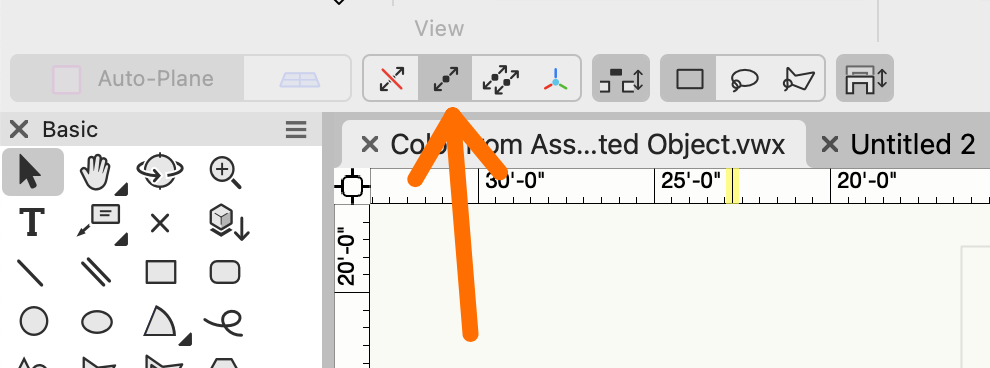
-
@SedlmeierGuenther Your are trying to use the DATABANK (Database) function in a cell in the worksheet. It does not work there. DATABASE and DATABASEBYSCRIPT will ONLY work where set from the right click menu on the row header. That is what converts the row into a database row. Re-read the thread, especially my post from February 23. That should get you the information you need. If that is not enough, then post a simplified example file here and we will try and make it work for you.
-
There are a bunch of different Surface Area options specified in the Worksheet Function Reference in the Specialized for Walls section. https://developer.vectorworks.net/index.php?title=Worksheet_Functions#Specialized_for_Wall Take a look at those and see if you can find the ones that do what you need.
-
Here is my full test file you so you can see what I did. With the three objects in classes, the DT color swatch changes based on the object. Yeah, I did not do enough testing. There is definitely a rest problem of some sort. When I edit the script then all the tags color properly. If I move either the tag or the associated object or if I Reset All Plug-ins then the rectangle switches to white. 😞 My guess is the Data Tags are closer to Symbols with Linked Text To Record than I thought. It looks like the rest of the Data Tag is making it redraw the cache of the color swatch and not actually running the PIO. The class of the rect is being switched back to None so you are getting the fill color from None. None of the easy tricks work. Maybe attach a record to the rect and store the class name there and then assigned the class from that? Sorry, out of ideas and time for the afternoon. Color from Associated Object.vwx
-
Transferring Data Between Worksheets
Pat Stanford replied to loic.jourdan's topic in General Discussion
Take a look at VLookup and XLookup in the Worksheet Function list and you should be able to get what you want. https://developer.vectorworks.net/index.php?title=Worksheet_Functions#Lookup Ask again if you still have questions. -
I think you might be able to create a PIO that could be placed inside a Data Tag that could do this. The PIO would need to: Draw the polyline to be colored. Get its parent (the Data Tag) Get the Associated Object (the Truss) Read the Truss Record.Field Change the class of the poly line to the field value. The attached code sets the class of the PIO to that of the DT associated object. You should be able to do the modifications to read the value from the Record.Field. The tricky part is that the objects in the DataTag are enclosed inside a group, kind of like the Viewport Crop and Viewport Annotation Groups, so you have to use the extra GetParent to get the handle to the Data Tag to be able to get the association. Create a Point Type PIO and paste the following code into the Script. Add the PIO to your workspace. Insert the PIO into a Data Tag. Associate the Data Tag with an Object. The PIO will take on the class of the Associated Object and use the Fill Color of that class. HTH Procedure PIOClassFromDTAssocObj; {©2024 Pat Stanford - pat@coviana.com} {licensed under the Boost Software License 1.0} {https://github.com/boostorg/boost/blob/master/LICENSE_1_0.txt} {TL/DR Use as you want, attribution for source, No warranty} VAR objHand,H2,H3,H4, recHand, wallHand: HANDLE; Rec,Fld, Obj: String; B1: Boolean; N1,N2,N3: Integer; BEGIN B1:=GetCustomObjectInfo(obj, objHand, recHand, wallHand); {Info on running PIO} H2:=GetParent(objHand); {Get Handle to object Group inside Data Tag} H2:=GetParent(H2); {Get Handle to Data Tag} H4:=GetAssociation(H2, 0, N1, N2); {Get Object Associated to Data Tag} Rect(0,0,-5',-5'); {Draw Rectangle} H3:=LNewObj; SetFillColorByClass(H3); {Set Rectangle Fill Color to ByClass} SetClass(H3,GetClass(H4)); {Set the Class of the Rectangle to the Class of the Associated Object} { Message(Obj,' : ', objHand,N3,' : ',H2, ' : ',GetTypeN(H2),' : ',H4, ' : ', GetClass(H4));} End; Run(PIOClassFromDTAssocObj);
-
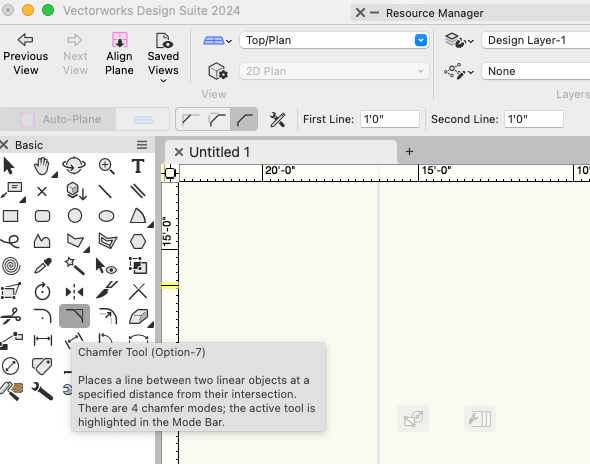
Which angles? Really hard to tell from your picture what you are trying to do. If you mean the corners of the "rectangle", then you can use the Chamfer tool using the third mode.