


Pat Stanford
-
Posts
12,642 -
Joined
-
Last visited
Content Type
Profiles
Forums
Events
Articles
Marionette
Store
Posts posted by Pat Stanford
-
-
Maybe also look at ForEachObjectAtPoint which allows you to specify a radius rather than needing an absolute point.
But I think you are correct about having to pass world coordinates not PIO coordinates.
-
 1
1
-
-
Worksheets on their own can only report on objects that are not in the drawing. Being in the Resource manager is not enough.
While it is possible to use a DatabaseByScript to create a database of Resources, unless you are comfortable with scripting it is not a good idea. All Sorting and Summing have to be done in the script. You can't use the usual database controls.
Sorry.
-
I think the poly is "consumed" during the creation of the slab.
If you need to use the poly after the slab creation I think you need to duplicate the poly first. I am not certain if the "copy" or the "original" will be the one retaining the UUID. I think when you make a copy in VW, the copy is the one that ends up selected and the original is unselected. Or maybe it is the other way around.
-
1
-
-
@MullinRJ Thanks for the help.
I THINK I could have done this, but your explanation is so much clearer than mine would have been.
And at the time, my brain would not tell me how to make the original vectors/points.
Thanks for the refresher.
-
1
-
-
I don't think associations require Event Enabled. Unless you want something like delete tag on delete object.
-
Your file has no interiorcad objects, so I can't see if the database is selecting them properly or not.
I need a file with a few samples (2-4) of objects to meet each of the two database criteria.
-
In the Debug List View Explorer, it shows that the PIO is included in Data Tag. But that may just be in the file and not how it is drawn. 😞
-
HScale2D setting the center of the scale at the point you want to keep fixed and then just set the scale factor per the difference between the current length and new length.
@MullinRJWill probably chime in here soon with an easier way to do this using vectors. 😉
-
Yare probably in the first mode of the Selection tool, Non-Interactive Scaling. Choose the second (single object interactive scalintr) or third mode (multiple object interactive scaling).
-
Your are trying to use the DATABANK (Database) function in a cell in the worksheet.
It does not work there.
DATABASE and DATABASEBYSCRIPT will ONLY work where set from the right click menu on the row header. That is what converts the row into a database row.
Re-read the thread, especially my post from February 23. That should get you the information you need.
If that is not enough, then post a simplified example file here and we will try and make it work for you.
-
There are a bunch of different Surface Area options specified in the Worksheet Function Reference in the Specialized for Walls section.
https://developer.vectorworks.net/index.php?title=Worksheet_Functions#Specialized_for_Wall
Take a look at those and see if you can find the ones that do what you need.
-
Here is my full test file you so you can see what I did.
With the three objects in classes, the DT color swatch changes based on the object.
Yeah, I did not do enough testing. There is definitely a rest problem of some sort. When I edit the script then all the tags color properly.
If I move either the tag or the associated object or if I Reset All Plug-ins then the rectangle switches to white. 😞
My guess is the Data Tags are closer to Symbols with Linked Text To Record than I thought. It looks like the rest of the Data Tag is making it redraw the cache of the color swatch and not actually running the PIO. The class of the rect is being switched back to None so you are getting the fill color from None.
None of the easy tricks work.
Maybe attach a record to the rect and store the class name there and then assigned the class from that?
Sorry, out of ideas and time for the afternoon.
-
Take a look at VLookup and XLookup in the Worksheet Function list and you should be able to get what you want.
https://developer.vectorworks.net/index.php?title=Worksheet_Functions#Lookup
Ask again if you still have questions.
-
I think you might be able to create a PIO that could be placed inside a Data Tag that could do this.
The PIO would need to:
Draw the polyline to be colored.
Get its parent (the Data Tag)
Get the Associated Object (the Truss)
Read the Truss Record.Field
Change the class of the poly line to the field value.
The attached code sets the class of the PIO to that of the DT associated object. You should be able to do the modifications to read the value from the Record.Field.
The tricky part is that the objects in the DataTag are enclosed inside a group, kind of like the Viewport Crop and Viewport Annotation Groups, so you have to use the extra GetParent to get the handle to the Data Tag to be able to get the association.
Create a Point Type PIO and paste the following code into the Script.
Add the PIO to your workspace.
Insert the PIO into a Data Tag.
Associate the Data Tag with an Object.
The PIO will take on the class of the Associated Object and use the Fill Color of that class.
HTH
Procedure PIOClassFromDTAssocObj; {©2024 Pat Stanford - pat@coviana.com} {licensed under the Boost Software License 1.0} {https://github.com/boostorg/boost/blob/master/LICENSE_1_0.txt} {TL/DR Use as you want, attribution for source, No warranty} VAR objHand,H2,H3,H4, recHand, wallHand: HANDLE; Rec,Fld, Obj: String; B1: Boolean; N1,N2,N3: Integer; BEGIN B1:=GetCustomObjectInfo(obj, objHand, recHand, wallHand); {Info on running PIO} H2:=GetParent(objHand); {Get Handle to object Group inside Data Tag} H2:=GetParent(H2); {Get Handle to Data Tag} H4:=GetAssociation(H2, 0, N1, N2); {Get Object Associated to Data Tag} Rect(0,0,-5',-5'); {Draw Rectangle} H3:=LNewObj; SetFillColorByClass(H3); {Set Rectangle Fill Color to ByClass} SetClass(H3,GetClass(H4)); {Set the Class of the Rectangle to the Class of the Associated Object} { Message(Obj,' : ', objHand,N3,' : ',H2, ' : ',GetTypeN(H2),' : ',H4, ' : ', GetClass(H4));} End; Run(PIOClassFromDTAssocObj); -
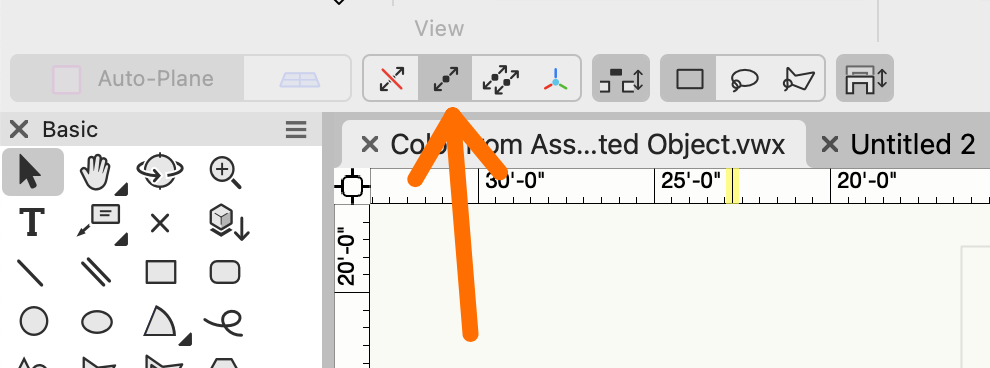
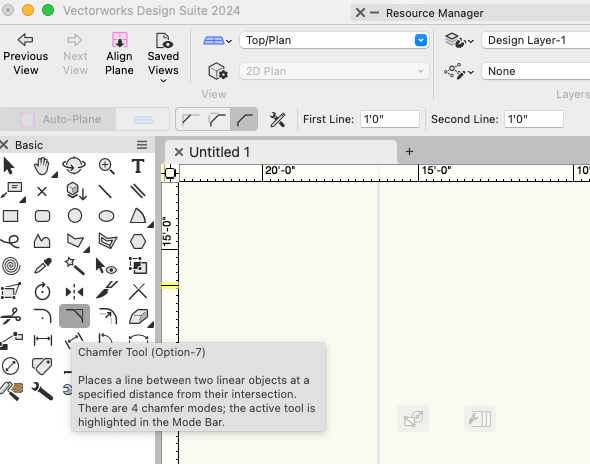
Which angles? Really hard to tell from your picture what you are trying to do.
If you mean the corners of the "rectangle", then you can use the Chamfer tool using the third mode.
-
@MullinRJ I hope your backups are current and you restore successful. 🤞
-
I can't find a way to zoom in. As I do, I get pixelation so the text can't be read. Can you please post the prompts separately so we can see them without having to play guessing games.
-
1
-
-
Sorry for the very long delay in replying.
Your can use a worksheet formula of =RunScript('Your_Scirpt_Name_Here') to cause your script to run every time the worksheet recalculates.
But you will have to have a separate script for every worksheet because I have not found a way for a script to determine the name or a handle to the worksheet that is running the script.
Put the RunScript in a cell near the top of the worksheet. If you don't want to see it, put it in a row by itself and then set the row height to zero to hide it.
HTH
-
One possibility that I have thought of in the past but never implemented is a bounding box check.
Create an array that contains the handle to the objects and the bounding box coordinates of the object.
Sort the array by the Left Coordinate.
Take the Right coordinate of the first object and compare that to the left coordinate of the other objects. As soon as you hit the first object that does not overlap you don't have to test the others.
Repeat the above sorting the array by the top coordinate and compare the top coordinates to the bottom coordinate of the first object.
You will have to come up with some way to "mark" the objects that overlap so you can go back and check for actual overlap using your & Raymonds method after you have reduced the number of combinations. Thinking about it now, I would probably use a structure for the array containing the object handle, the four bounding box points, and a DynArray of Handles to store all of the objects that overlap bounding boxes. On the first bounding box comparison run you would only store the object that overlap. Then when you do the second comparison you would only have to check the objects you already know overlap horizontally to see if they also overlap vertically.
I can probably explain more if you need more help.
And welcome to The Club. The scriptures here are pretty generous, especially with people who are trying to learn instead of just asking for a freebie.
-
1
-
-
In the Graphical Calculation section of the VS Function Reference there are a number of intersect functions (Line-Line, Line-Circle, Line-Elipse, ellipse-elipse). Convert a copy of your objects to lines and then check if any of the lines intersect.
-
1
-
-
Check which workspace you are in. It sounds like you might not be in the Spotlight workspace.
Tools Menu: Workspaces
-
You can also use the U key (American keyboard version) to toggle between the different Selection Tool modes.
-
 1
1
-
-
In VW2024, Unified View is on by default and you have to dig relatively deeply in Document Preferences:Legacy 2D pane to turnout off.
In earlier versions Unified View was in the View menu.
-
You can just go to the Worksheet View menu and make sure that Database Header is checked and you will get the sum at the top of each column.
But you have to be willing to have data show up in every column. For cells that are not summed, that will be a count of the number of items in the subrows. But it should give you the correct value for the summarization in the other columns. You may need to also check the Sum Values button in the column header.
Matrix Multiplication
in Vectorscript
Posted
What function reference are you looking in? I can't find those functions in the version shipping with VW2024 nor in the on-line Developer version.