Search the Community
Showing results for tags 'bug report'.
Found 6 results
-
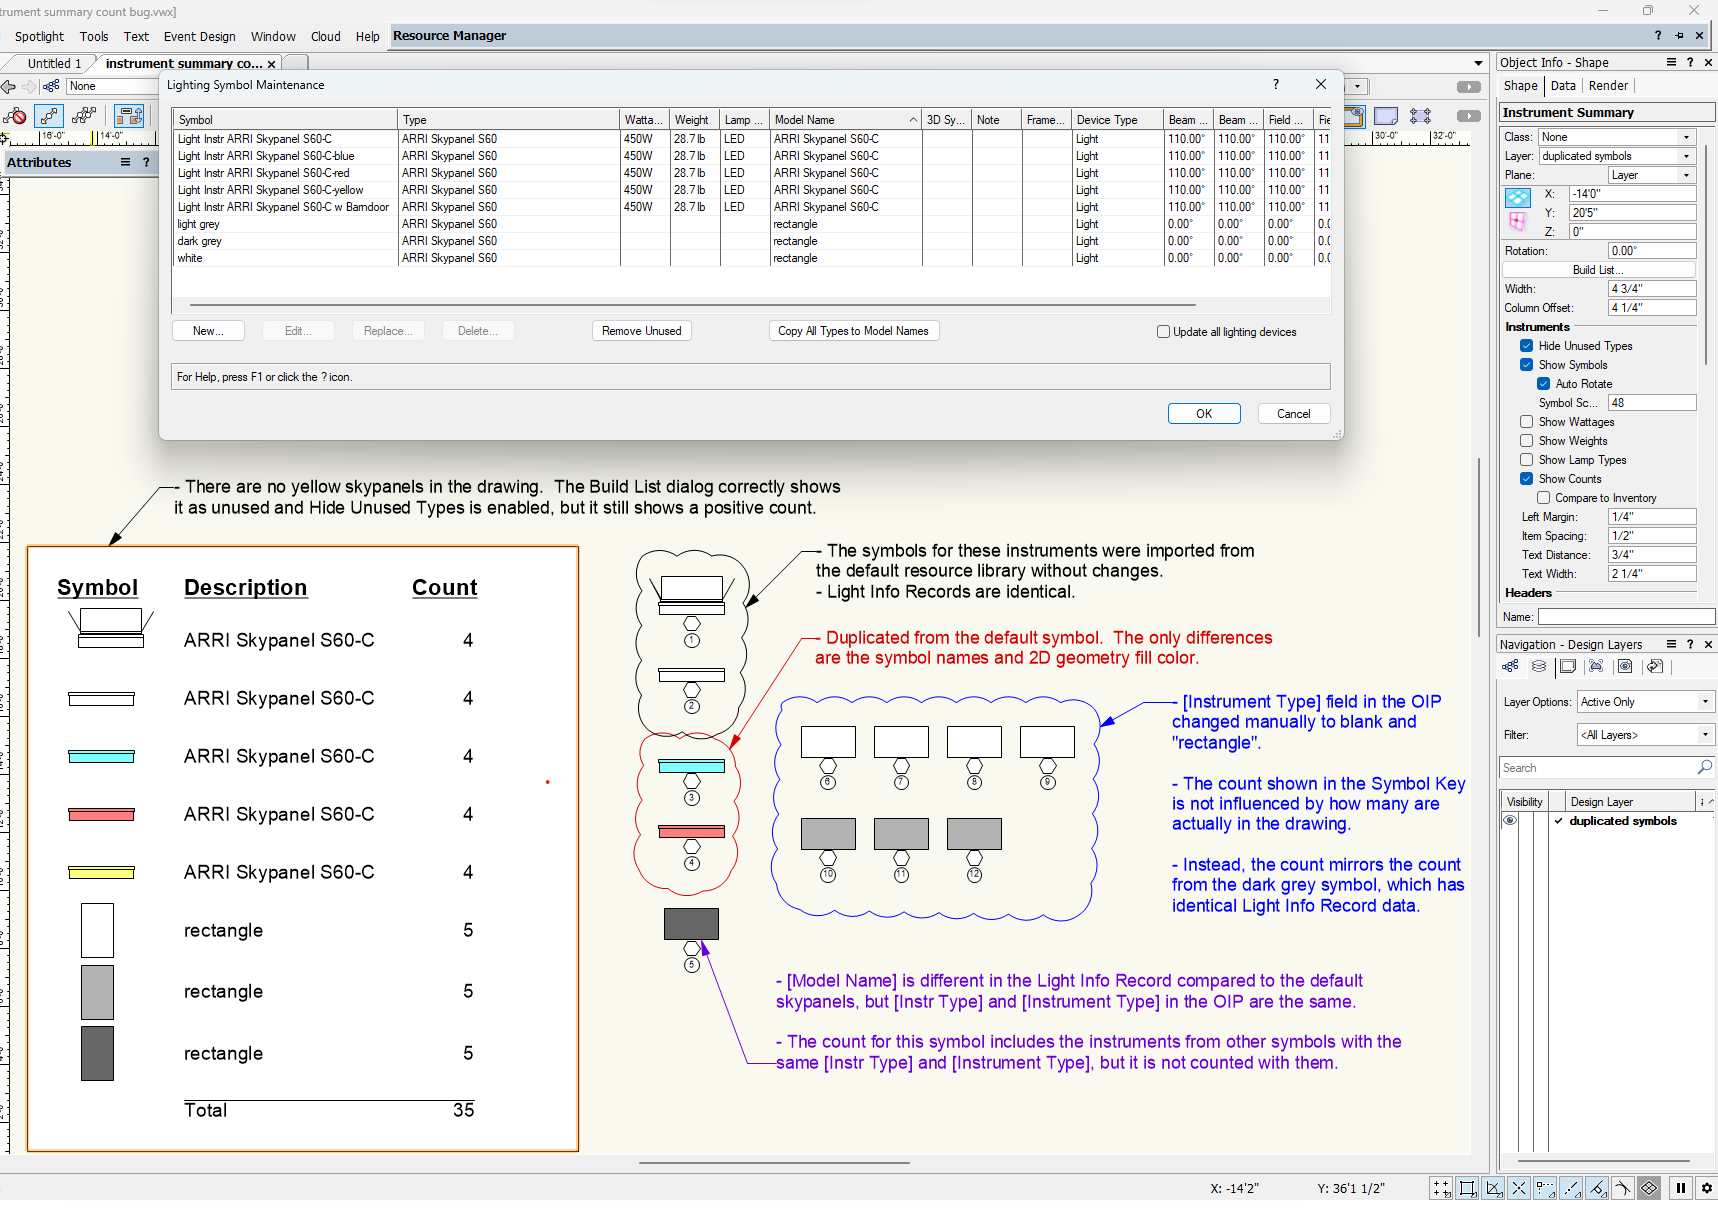
 This is an active bug in Spotlight 2023 SP6, but I've seen it for a few years. The attached file and screenshot show what's happening, so I'll try to keep the post itself as short and to the point as I can. Synopsis The Instrument Summary Tool's Show Counts function gives false results when you have multiple lighting device symbols with certain identical data in the Light Info Record (LIR) and OIP. Specifically, the [Inst Type] and [Model Name] fields in the symbol LIR and the [Instrument Type] field in lighting device OIP's are involved. Description As seen in the screenshot, There are 12 instruments in the drawing, but the counts in the Instrument Summary are wrong. The Instrument Summary list is organized by symbol name, with each symbol having a separate line and its own count. The root issue appears to be that symbol name is not the top-most criterion used for counting. This means that instruments generated from different symbols can be counted together on the lines for each separate symbol, multiplying the true number. In the demo drawing, I have four instruments generated from four discrete symbols representing Arri Skypanel S60-C's. The two black and white symbols were imported directly from the resource library, then the red, blue, and yellow versions were created by duplicating the original symbol and changing the 2D geometry color. Because the relevant fields in the LIR's are identical, they all get counted under each symbol. Note in particular that the yellow symbol is not even present in the drawing, but still shows the count for the other four due to the bug. It's worth pointing out that anyone using the two black and white skypanel symbols taken from the VW resource library will encounter this bug without having made any customizations. There are other examples in the resource library of sets of symbols with identical LIR's which will cause this bug out of the box. I created the bottom three rectangle symbols in the Instrument Summary from simple 2D geometry which I turned into a symbol, attached the LIR and copied the [Inst Type] field from the skypanel symbols, then duplicated. I included the Lighting Symbol Maintenance dialog in the screenshot to show the LIR values of the various symbols. The counting bug takes on different behaviors depending on which of the data fields match and which don't, as noted in the screenshot. The bug variations for the rectangle symbol counts come from the [Instrument Type] in the OIPs being different from [Inst Type] in the LIRs, whereas they are the same for the skypanel symbols. For the dark grey rectangle devices, the OIP [Instrument Type] matches the skypanel device OIP's, and for the white and light grey rectangles it is different. Comments FWIW I have encountered this bug numerous times through sharing files and collaborating with other users on film set lighting plots. As a team, we frequently create customized variations of the resource manager lighting device symbols, most commonly to represent instruments which are not in the resource manager, or for different accessory buildouts. It is quite easy to duplicate a symbol, tweak the geometry or colors, then begin using it without updating the LIR fields, but it is rather tedious to make sure each symbol variation has unique data in the relevant places to avoid this bug. In my experience many Spotlight users aren't familiar with the finer points of using the Light Info Record in the first place and don't know how to update it. To my mind, the ideal solution would be to fix the count algorithm so it uses symbol name as the first distinguishing criterion, as that would remove the requirement to give each symbol unique data in the LIR and OIP. Thanks as always for all the work the mods and devs put in to keep VW humming. instrument summary count bug.vwx
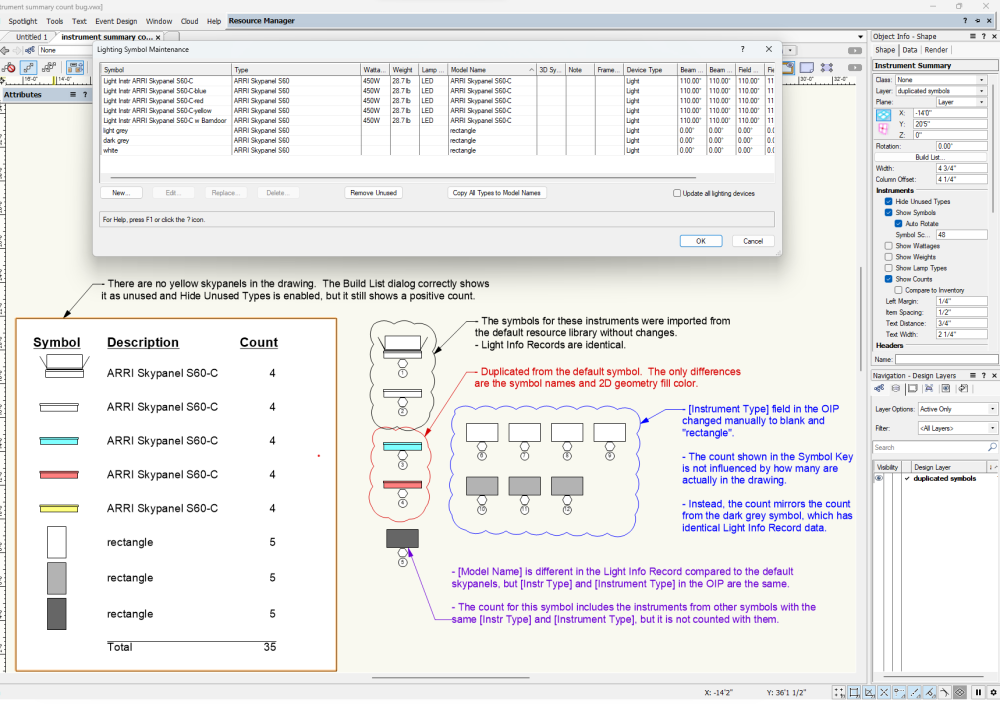
-
Using the 2D polygon tool in Inner Boundary Mode (paint bucket) on geometry within a viewport annotation layer produces faulty and unexpected results. The bug is such that the tool cannot be used properly in that situation without performing several extra steps. I originally encountered this bug while working through the VW Intermediate Concepts Course video on Viewport Annotations. The bug can be easily reproduced by following that video using the course progression file #15, which is provided at the top of that course (I am attaching a smaller and simpler file for demonstration below, and a video showing the bug in action). The videos for that course were produced using VW2019, but using VW2022, the demonstrated workflow produces the bugs described here. I tested on two separate 2022 installations and the behavior was the same on both machines (both Win 10). The bug did not occur using VW 2020. Here are the steps to reproduce using the demonstration file below: 1) On sheet layer 1, edit annotations on the viewport (the bug is more easily observed when the viewport is positioned away from the origin point). 2) With nothing selected, set the fill in the attributes palette to a hatch or tile. Most aspects of the bug occur with any fill type, but there are additional elements with those fills. 3) Activate the 2D Polygon tool with Inner Boundary Mode active (paint bucket). 4) Click inside the various faces of the viewport geometry to trigger the bug. Two different groups of buggy behaviors will result: A) Some of the polygons are created in the wrong position (at a further offset related to the offset of the viewport render geometry's origin from the sheet layer origin). These objects are otherwise normal, except when created with a gradient fill, which does not display correctly. B) Some of the polygons are created at the expected position, but display most fill types incorrectly, and cannot be moved by many of the normal methods. The type B polygon instances cannot be moved by dragging, entering XY values manually, or via the move command. Recreating them via Copy or Cut and then Paste converts them to properly functioning objects. Whether a given polygon is type A or B changes depending on the order in which they are created, so clicking on the facets of the viewport geometry in a different order can result in different bug types being produced for a given facet. The attached file and video demonstrate the bug in action. 2D poly tool - annotation layer bug.mp4 2d poly - viewport bug.vwx
-
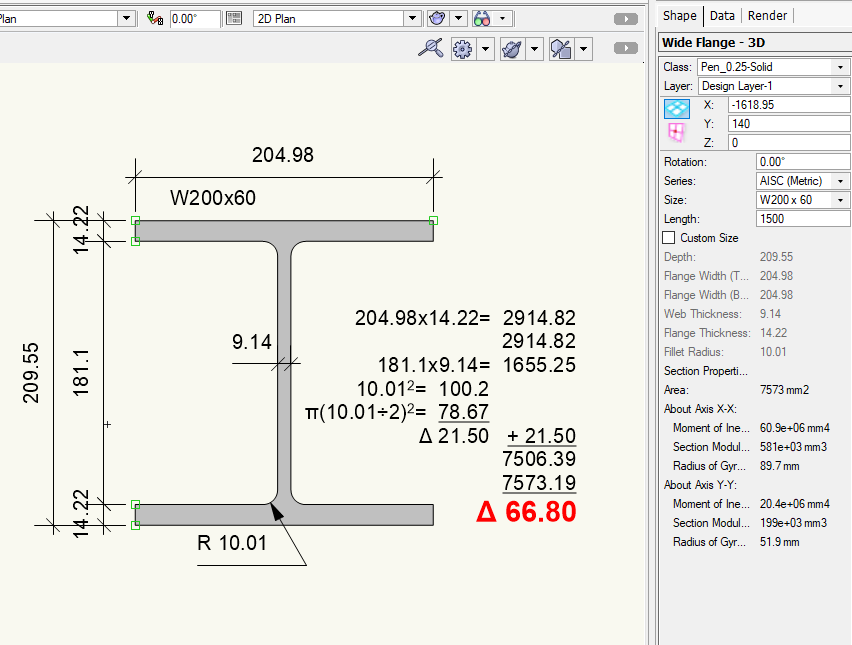
I think this has been around for some time but I never needed accurate area calculations before so I didn't take notice. The calculation of polyline areas presented in the OIP is outside of standard acceptable tolerances. I only used the WideFlange because I was attempting to calculate weight when I noticed the error and that it was significant enough to alter the weight of a beam from which cost estimates are derived here in Canada. Have I missed something???
-
 Found and duplicated a bug. 1. Edit Annotations on a drawing on a sheet layer (mine has a title block with a border as well). 2. File... Document Settings... Units... 3. In Dimensions window, change "Fraction precision" drop down to any other unit (in my case I changed from 1/8 to No Fraction). 4. Result: my Title Block Border goes crazy with scaling issues and stuff of that nature which requires a hard Ctrl+Z. Don't change unit settings when in annotative edit view. Hope this is useful. Cheers,
 -

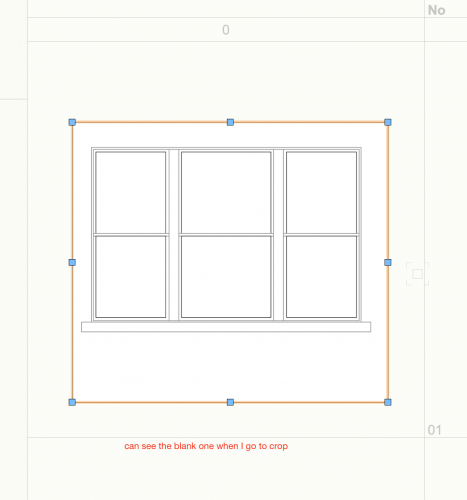
viewports of image worksheet not working on sheet layer
fabrica posted a question in Troubleshooting
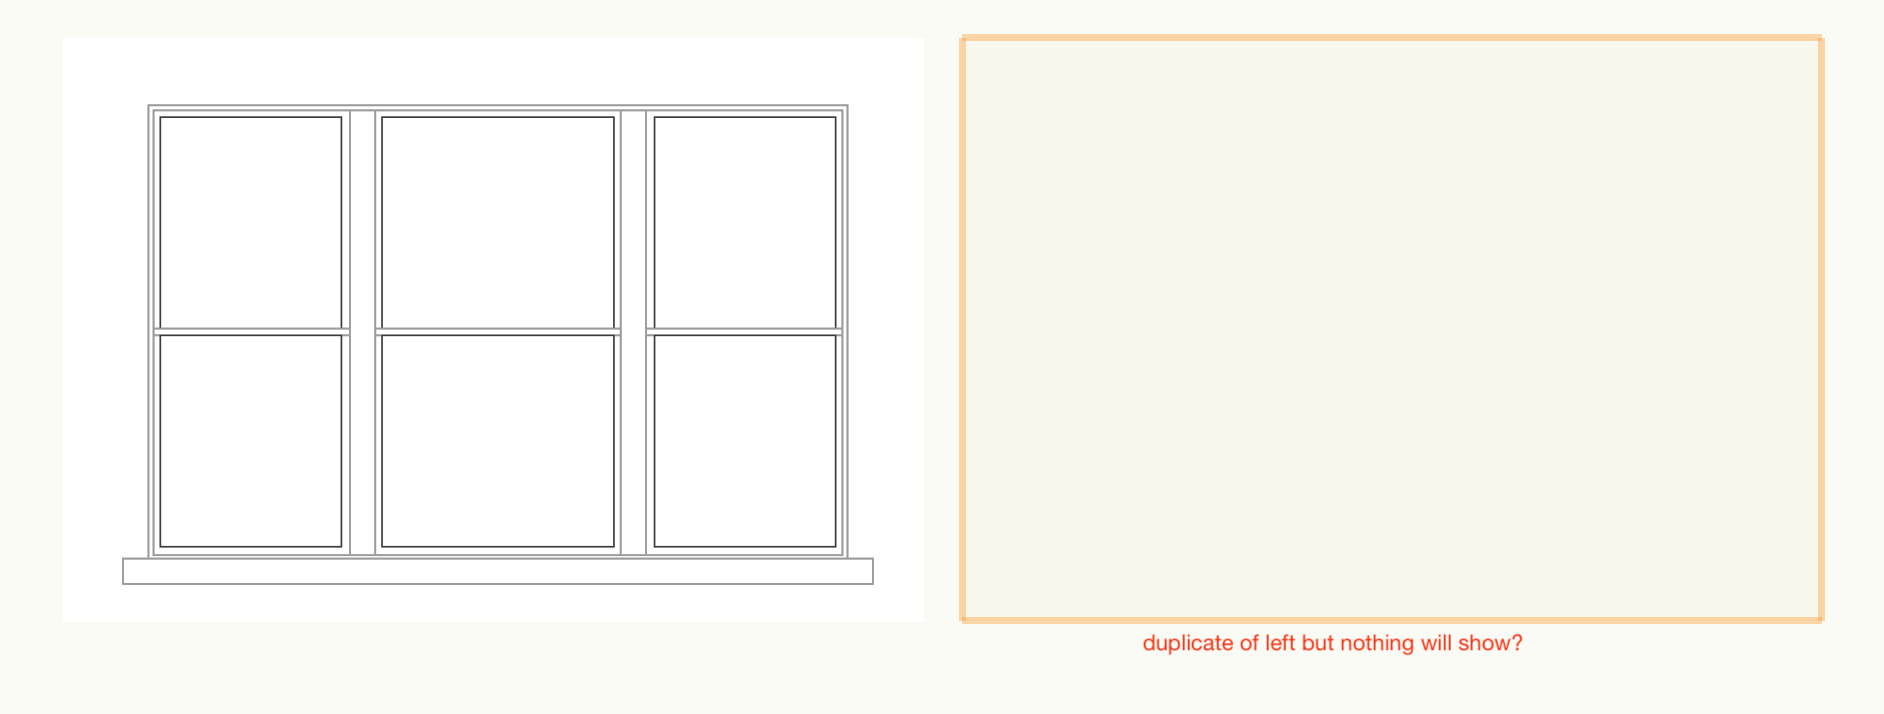
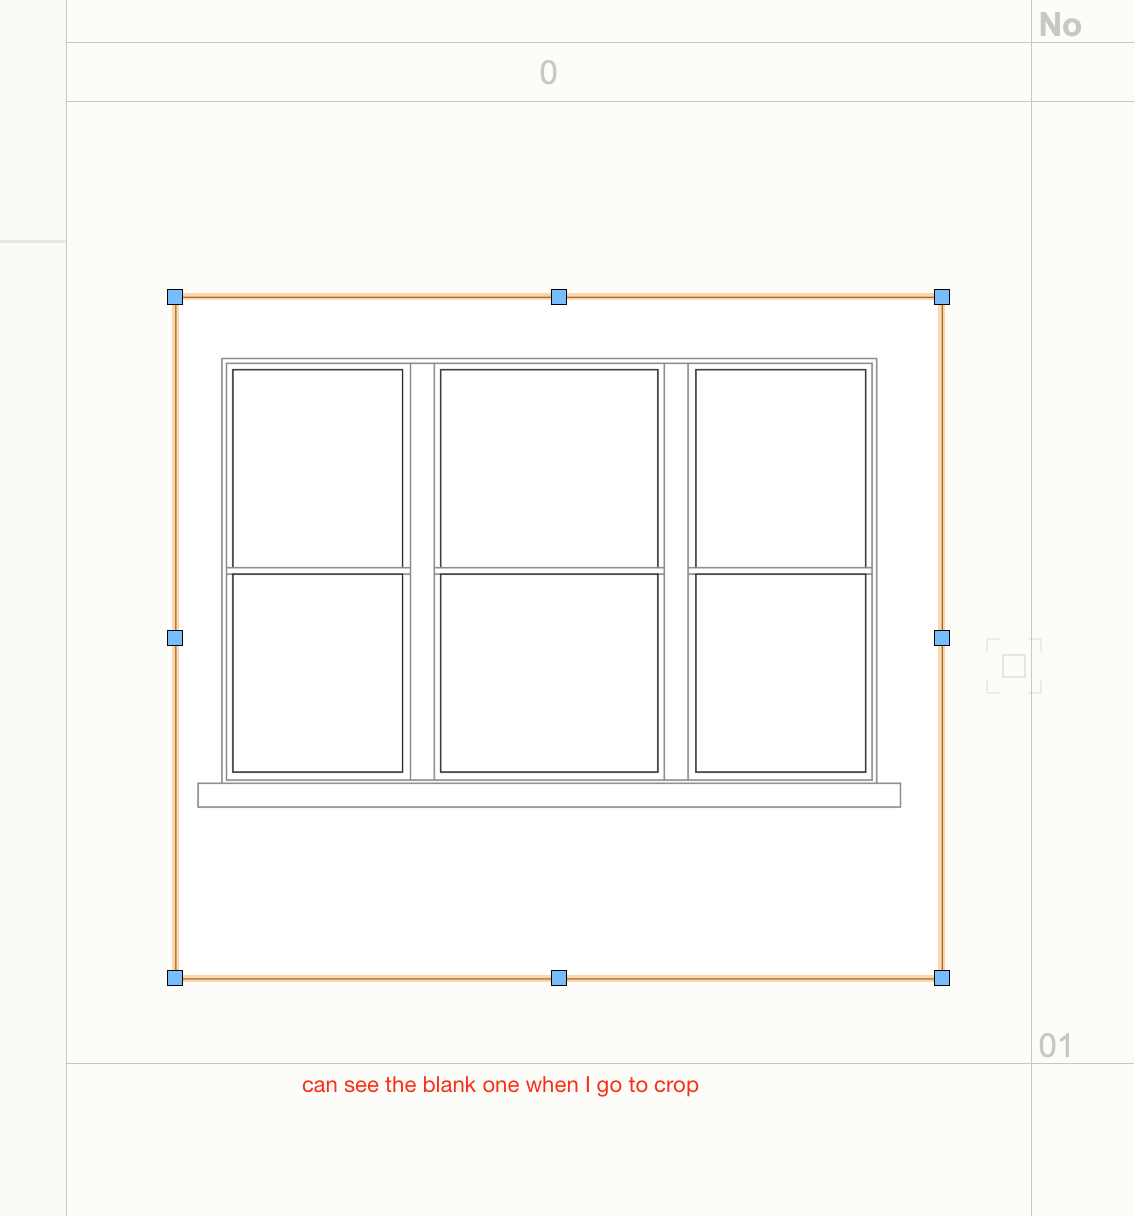
mac 11.6.1 , vectorworks 2022 sp1.1 trying to make viewports of a window image worksheet onto a new sheet layer , but any time I duplicate the first viewport the crop down to another image, nothing will show. If I right click the blank viewport and edit crop the image will show , just not on the sheet !
-
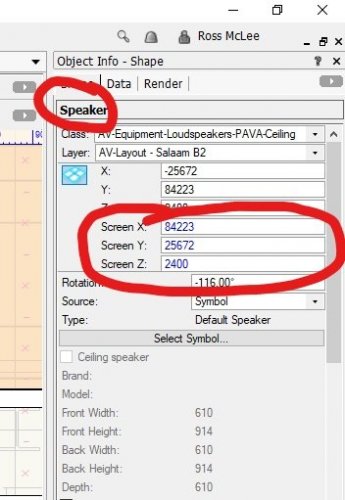
Hi guys, This may be a weird one off thing, but I noticed that when working with a video screen in my 2021 drawing and then selecting a loudspeaker, and other basic 2D geometry objects, that the OIP continued to display input boxes for the video screen object: Screen X, Y and Z values. See attached. Very odd. I'll restart VW and it will probably go away, but.... Cheers, R