Nico_be
-
Posts
154 -
Joined
-
Last visited
1 Follower

-
No, not possible. This tool is of rare uselessness. You can't even see the plants. Better to forget it and use the planted surfaces.
-
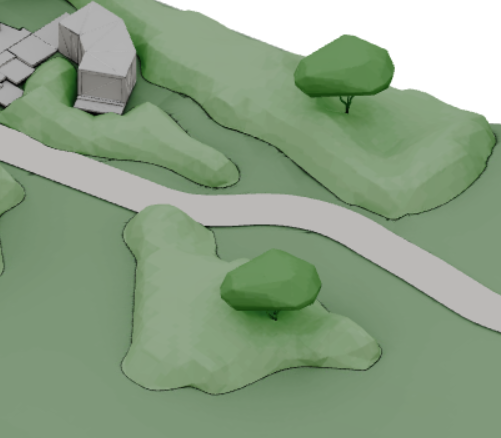
Hello, I'd like to be able to build these simple vegetation volumes with very few polygons to represent vegetated spaces. Does anyone have an idea of a good, quick method? I've tried with subdivisions, but it requires a lot of 3D manipulation, turning the plan in all directions and it's not ergonomic. My dream would be to be able to draw in plan, like a polyline, and have the volume created according to a few parameters. Here's the challenge :-)
-
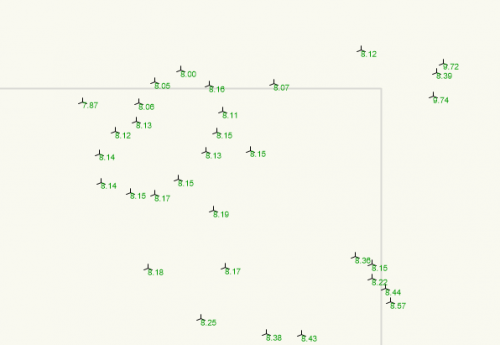 Hi, There are several possible causes... Could you perhaps attach an extract of the file containing a few points for me to test?
 -

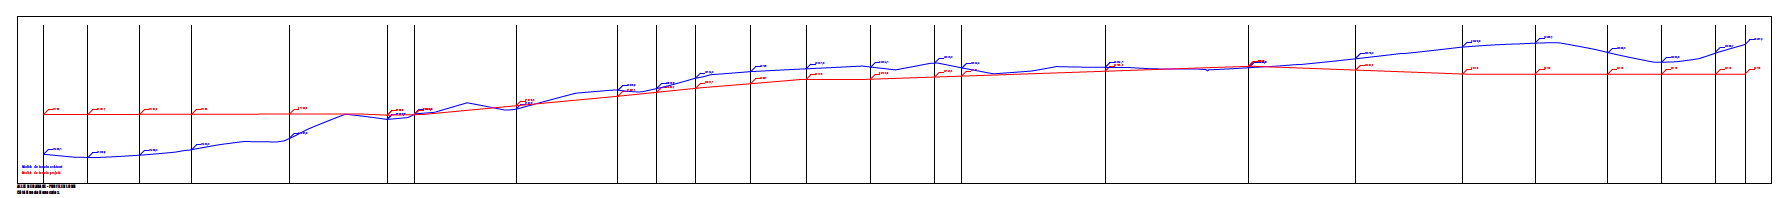
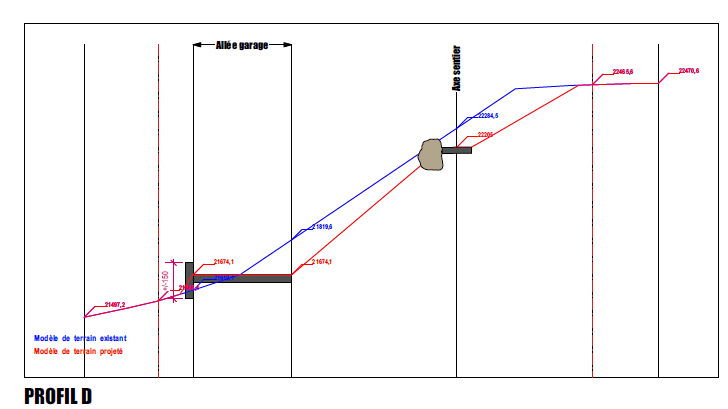
Providing existing and proposed site model elevations
Nico_be replied to Rebecca R's topic in Site Design
Hello, There is the "terrain section" command (I don't know its name in the US versions), it generates a profile with the existing and the proposed. A very basic command that it would be nice to update as already requested several times in the WishLists, but hey it's a base to work on.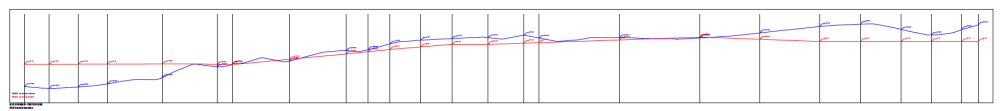
-
Graphic legend - version for non-data objects
Nico_be replied to Amanda McDermott's question in Wishlist - Feature and Content Requests
It doesn't seem to work with geometric patterns, but it does with hatches. And for plants, I can't see, it doesn't seem to work with parametric objects, it's an old plugin. -
Graphic legend - version for non-data objects
Nico_be replied to Amanda McDermott's question in Wishlist - Feature and Content Requests
Sorry, i'm still with VW203, can you export in this version? -
Graphic legend - version for non-data objects
Nico_be replied to Amanda McDermott's question in Wishlist - Feature and Content Requests
could you share here a test file? -
Graphic legend - version for non-data objects
Nico_be replied to Amanda McDermott's question in Wishlist - Feature and Content Requests
rectangles are filled e, depending on the class settings, which will be noted as the fill color and line. For symbols, you need to give the scale of each symbol so that it can be adjusted. If you get this message, the symbol is probably too large, Could you paste here a printscreen? -
Graphic legend - version for non-data objects
Nico_be replied to Amanda McDermott's question in Wishlist - Feature and Content Requests
Okay, for many years I've been using a plug-in. I think its author had made it freely available a long time ago. It does EXACTLY what a caption tool should do: you select the symbols and classes you want to caption and you can specify what you want in text. And set the number of columns, spacing etc. Because the new tool since VW2023 is not usable by me. There's no point in entering the class name as it is, I want to be able to enter the text I want. I still use this old plugin as long as it's compatible with new versions, it's much simpler. I'm attaching it here, and you need to put the files and folders in the "PLUGIN" directory and add it to the configuration. It had been developed in Belgium, I hope it will work for other versions, let me know. dieterdworks-vw-dlegend-1fb9b3fefaa7.zip -
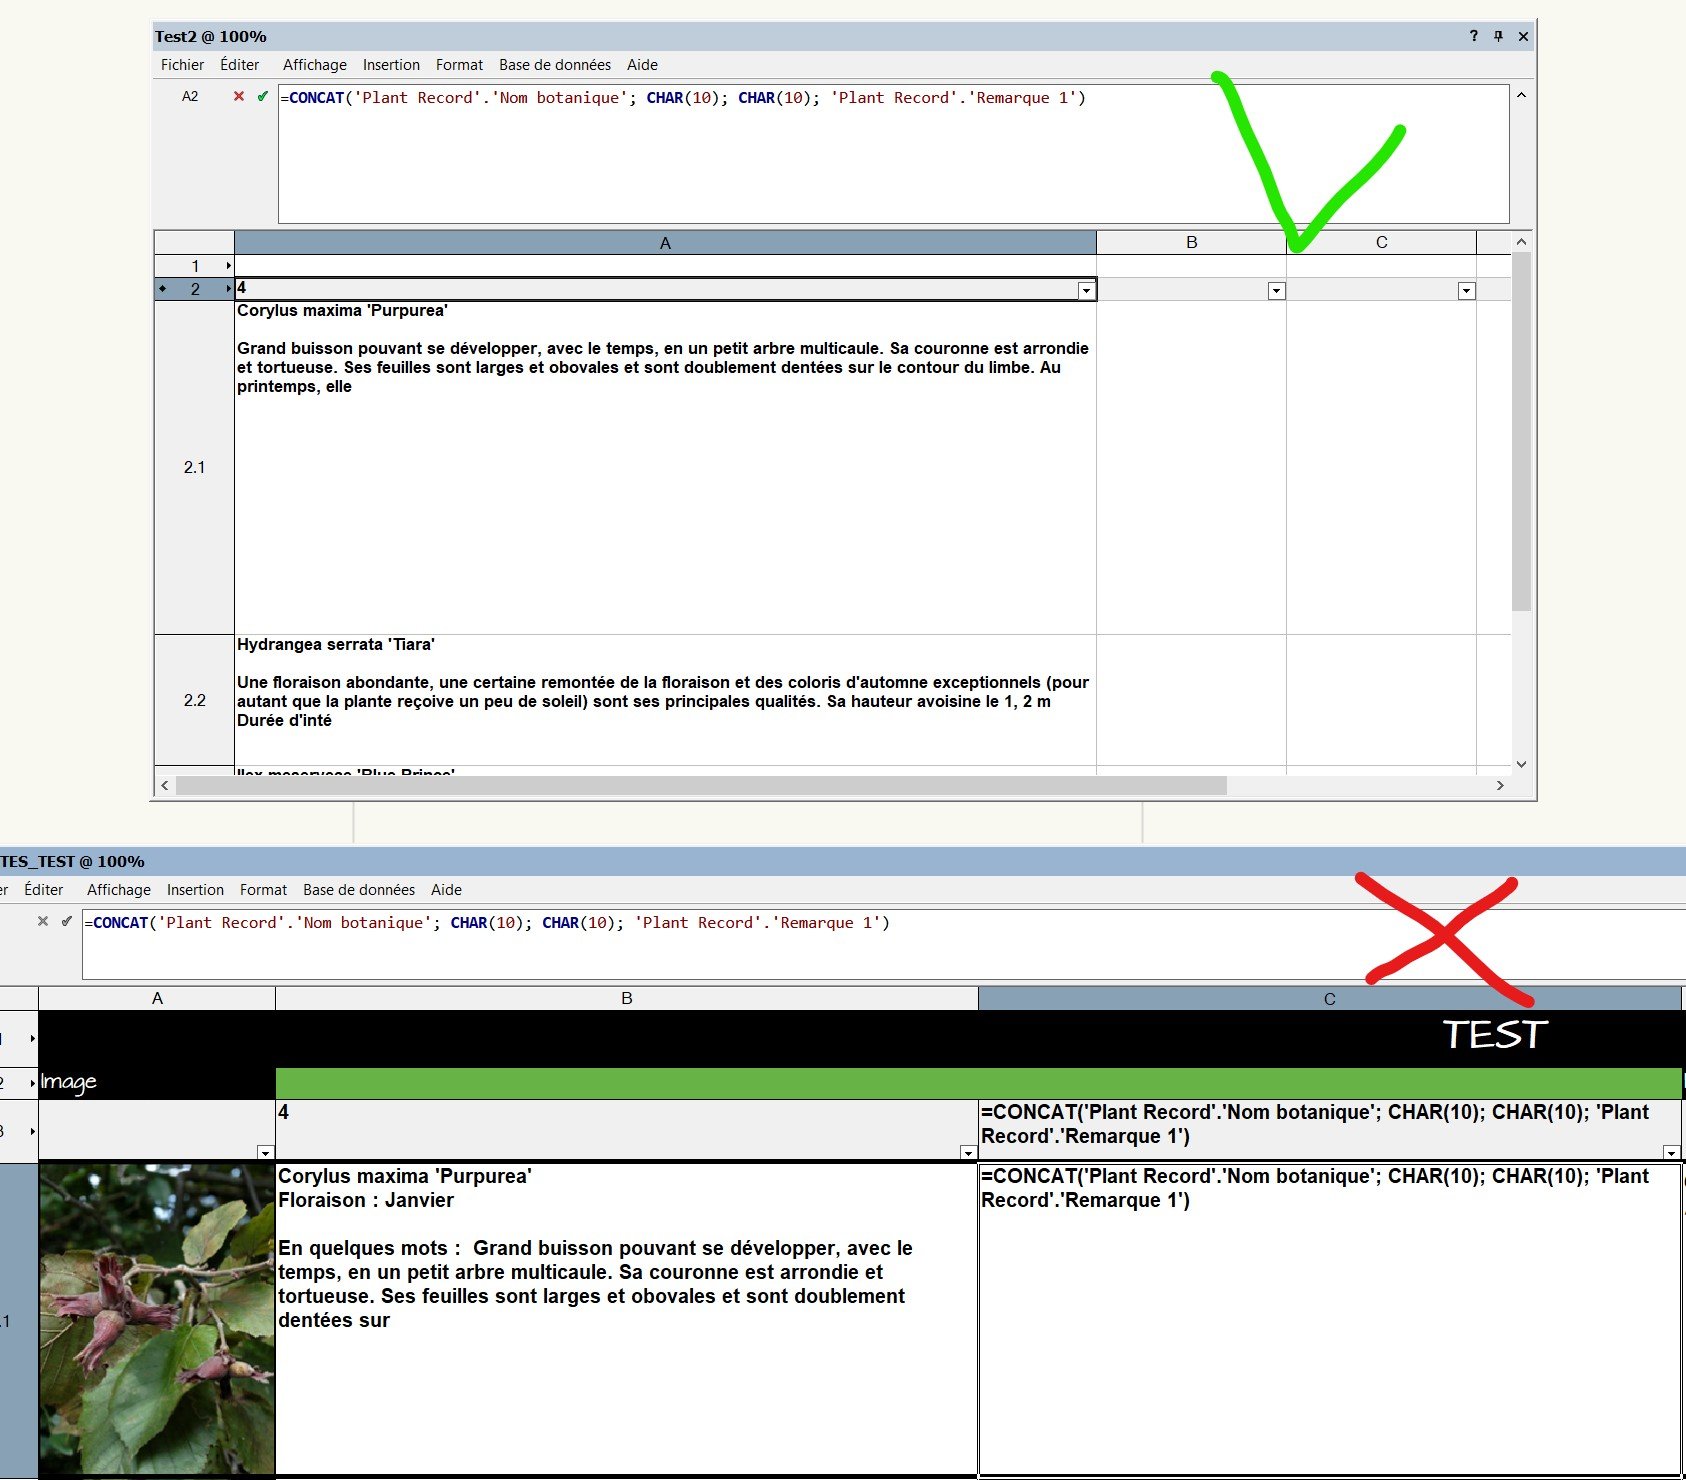
Another solution is to create a simple worksheet, with the formula =IMAGE in the first column, which will display the symbol's image. The other columns can display other plant information. There are example tables already available in the library. I'm in French so I don't know the name of the command in other language versions.
-
Several database functions in one table cell
Nico_be replied to Nico_be's topic in General Discussion
Ok Pat, I'll have a look at graphical legend, it's probably a beter idea! Thanks. -
Several database functions in one table cell
Nico_be replied to Nico_be's topic in General Discussion
Yes, that's what I've done, I've recreated a new table, I'm getting something more interesting in the formatting of the data, but there's the problem of character limitation which doesn't display all the information in the field. I can't find any information about this anywhere. The new file is attached Test tableau Copie3.vwx -
Several database functions in one table cell
Nico_be replied to Nico_be's topic in General Discussion
there seems to be a bug with the tables, the formula works in one table of the file but not in the other. It doesn't make searching any easier 🙂 But there's still the problem of character limitation. second file attached. Test tableau Copie2.vwx
-
Several database functions in one table cell
Nico_be replied to Nico_be's topic in General Discussion
Thanks for your help already! 🙂 To sum up, here's the objective: To have several fields in a single table cell, in an attempt to create a more interesting layout than a simple table. The test file is appended. in the meantime I had found the CHAR(10) trick: https://developer.vectorworks.net/index.php/VS:Chr What almost works: The CONCAT formula refers to cells in the same table. =CONCAT(D3; (CHAR(13)); 'Flowering: '; E3; (CHAR(13)); (CHAR(13)); 'In a few words: '; F3) But it seems that the number of characters is limited, as the end of the text in F3 is missing. I couldn't find any information on character limitation in the reference manual. Another problem is that I have to refer to columns in the same table, which is inconvenient for printing. I've tried referencing the data in the other table but as it's a dynamic list this doesn't work as it returns the value of the leading row only, not the list. I've tried @Pat Stanford's formula, but it doesn't work (I'm running Windows 10, so I've replaced the commas (,) with semicolons (;) ). Any idea? Test tableau Copie.vwx -
Several database functions in one table cell
Nico_be replied to Nico_be's topic in General Discussion
And yes, it works! By making a small file to send here, I redid the test and it works perfectly. I probably made a syntax error on my first try. Thanks a lot! While I'm at it: can I insert a "line feed" in a formula? I'm trying to create a more interesting layout than simple lines...