Anders Blomberg
-
Posts
196 -
Joined
-
Last visited
Content Type
Profiles
Forums
Events
Articles
Marionette
Store
Everything posted by Anders Blomberg
-

Split option for worksheets in sheet layers
Anders Blomberg replied to Marco Zavagno's question in Wishlist - Feature and Content Requests
I'm getting some really frustrating results here. See attached video. Some issues: One of the worksheets in a viewport only appears when zooming out. One of the worksheets in a viewport only appears when adjusting the crop to include the heading. I've tried exporting to 2021 and have the same issues there. Anyone recognise this? Skärminspelning 2021-12-07 kl. 14.55.56.mov -
Split option for worksheets in sheet layers
Anders Blomberg replied to Marco Zavagno's question in Wishlist - Feature and Content Requests
Thanks @Jesse Cogswell! I had a go at it with some worksheets and it's really simple and intuitive to use, great job! But I had an issue where I summed the items on the last line so I'll probably end up using @Amorphous - Julian method. Still wish VW would integrate this basic feature though.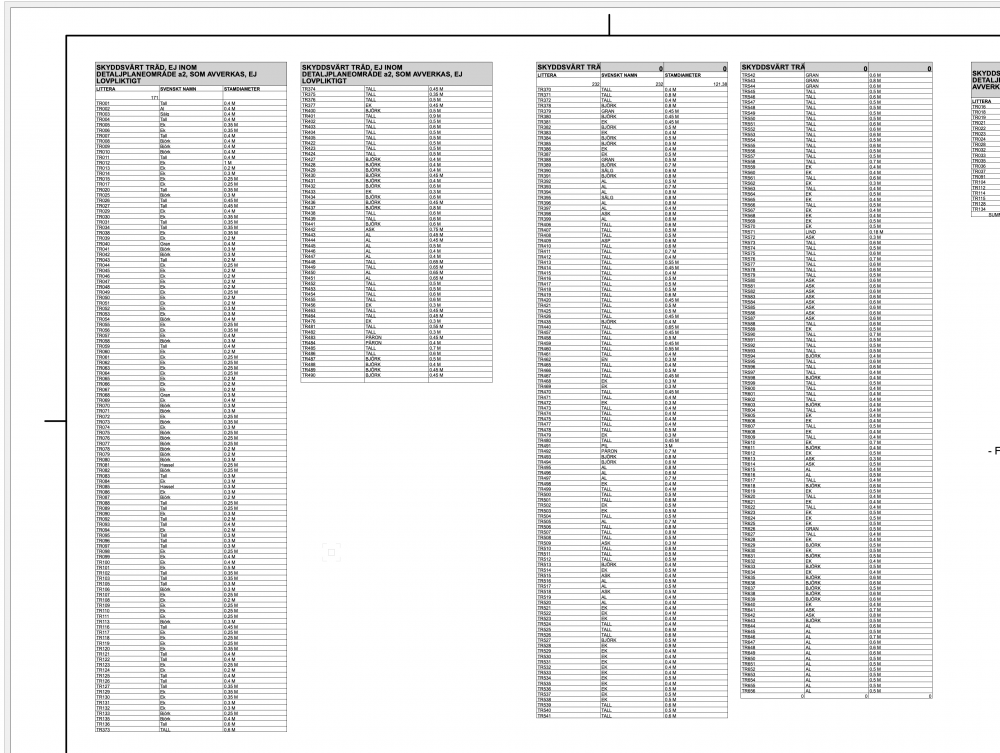
-
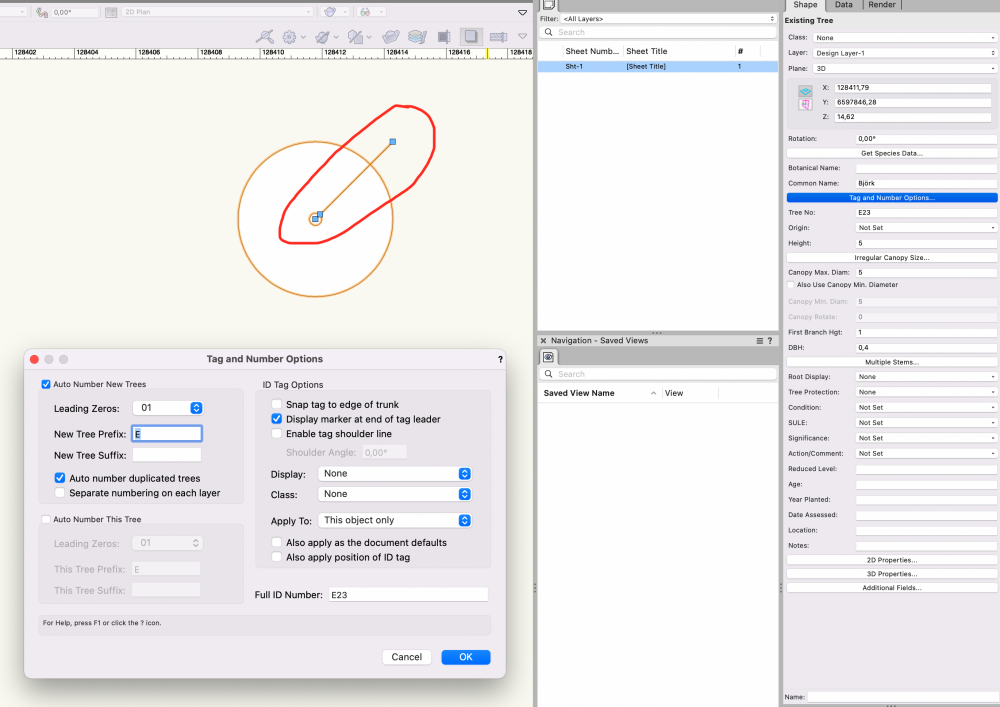
I'd prefer to use data tags instead of the built in tags for my existing trees as they're more flexible and I can add them on the sheet layer instead of the design layer. But silly enough I can't seem to remove the leader for the existing tree tag even if I've removed the tag and shoulder line. How do I delete/hide the leader line? On a side note, is it possible to renew the auto numbering of my trees after deleting a few of them?
-
Split option for worksheets in sheet layers
Anders Blomberg replied to Marco Zavagno's question in Wishlist - Feature and Content Requests
I was just searching for a way to do this. Would be hugely helpful, and surprising it's not possible at the moment. Even the dinosaur that is AutoCAD does this. I'm currently working on a large site where the table of existing trees is too long for the page size. -
Location filter in worksheets only works for some walls
Anders Blomberg posted a question in Troubleshooting
As described in the header and the second half of the following thread. We assume it's a bug. -
Quantity take-offs per property?
Anders Blomberg replied to Anders Blomberg's topic in General Discussion
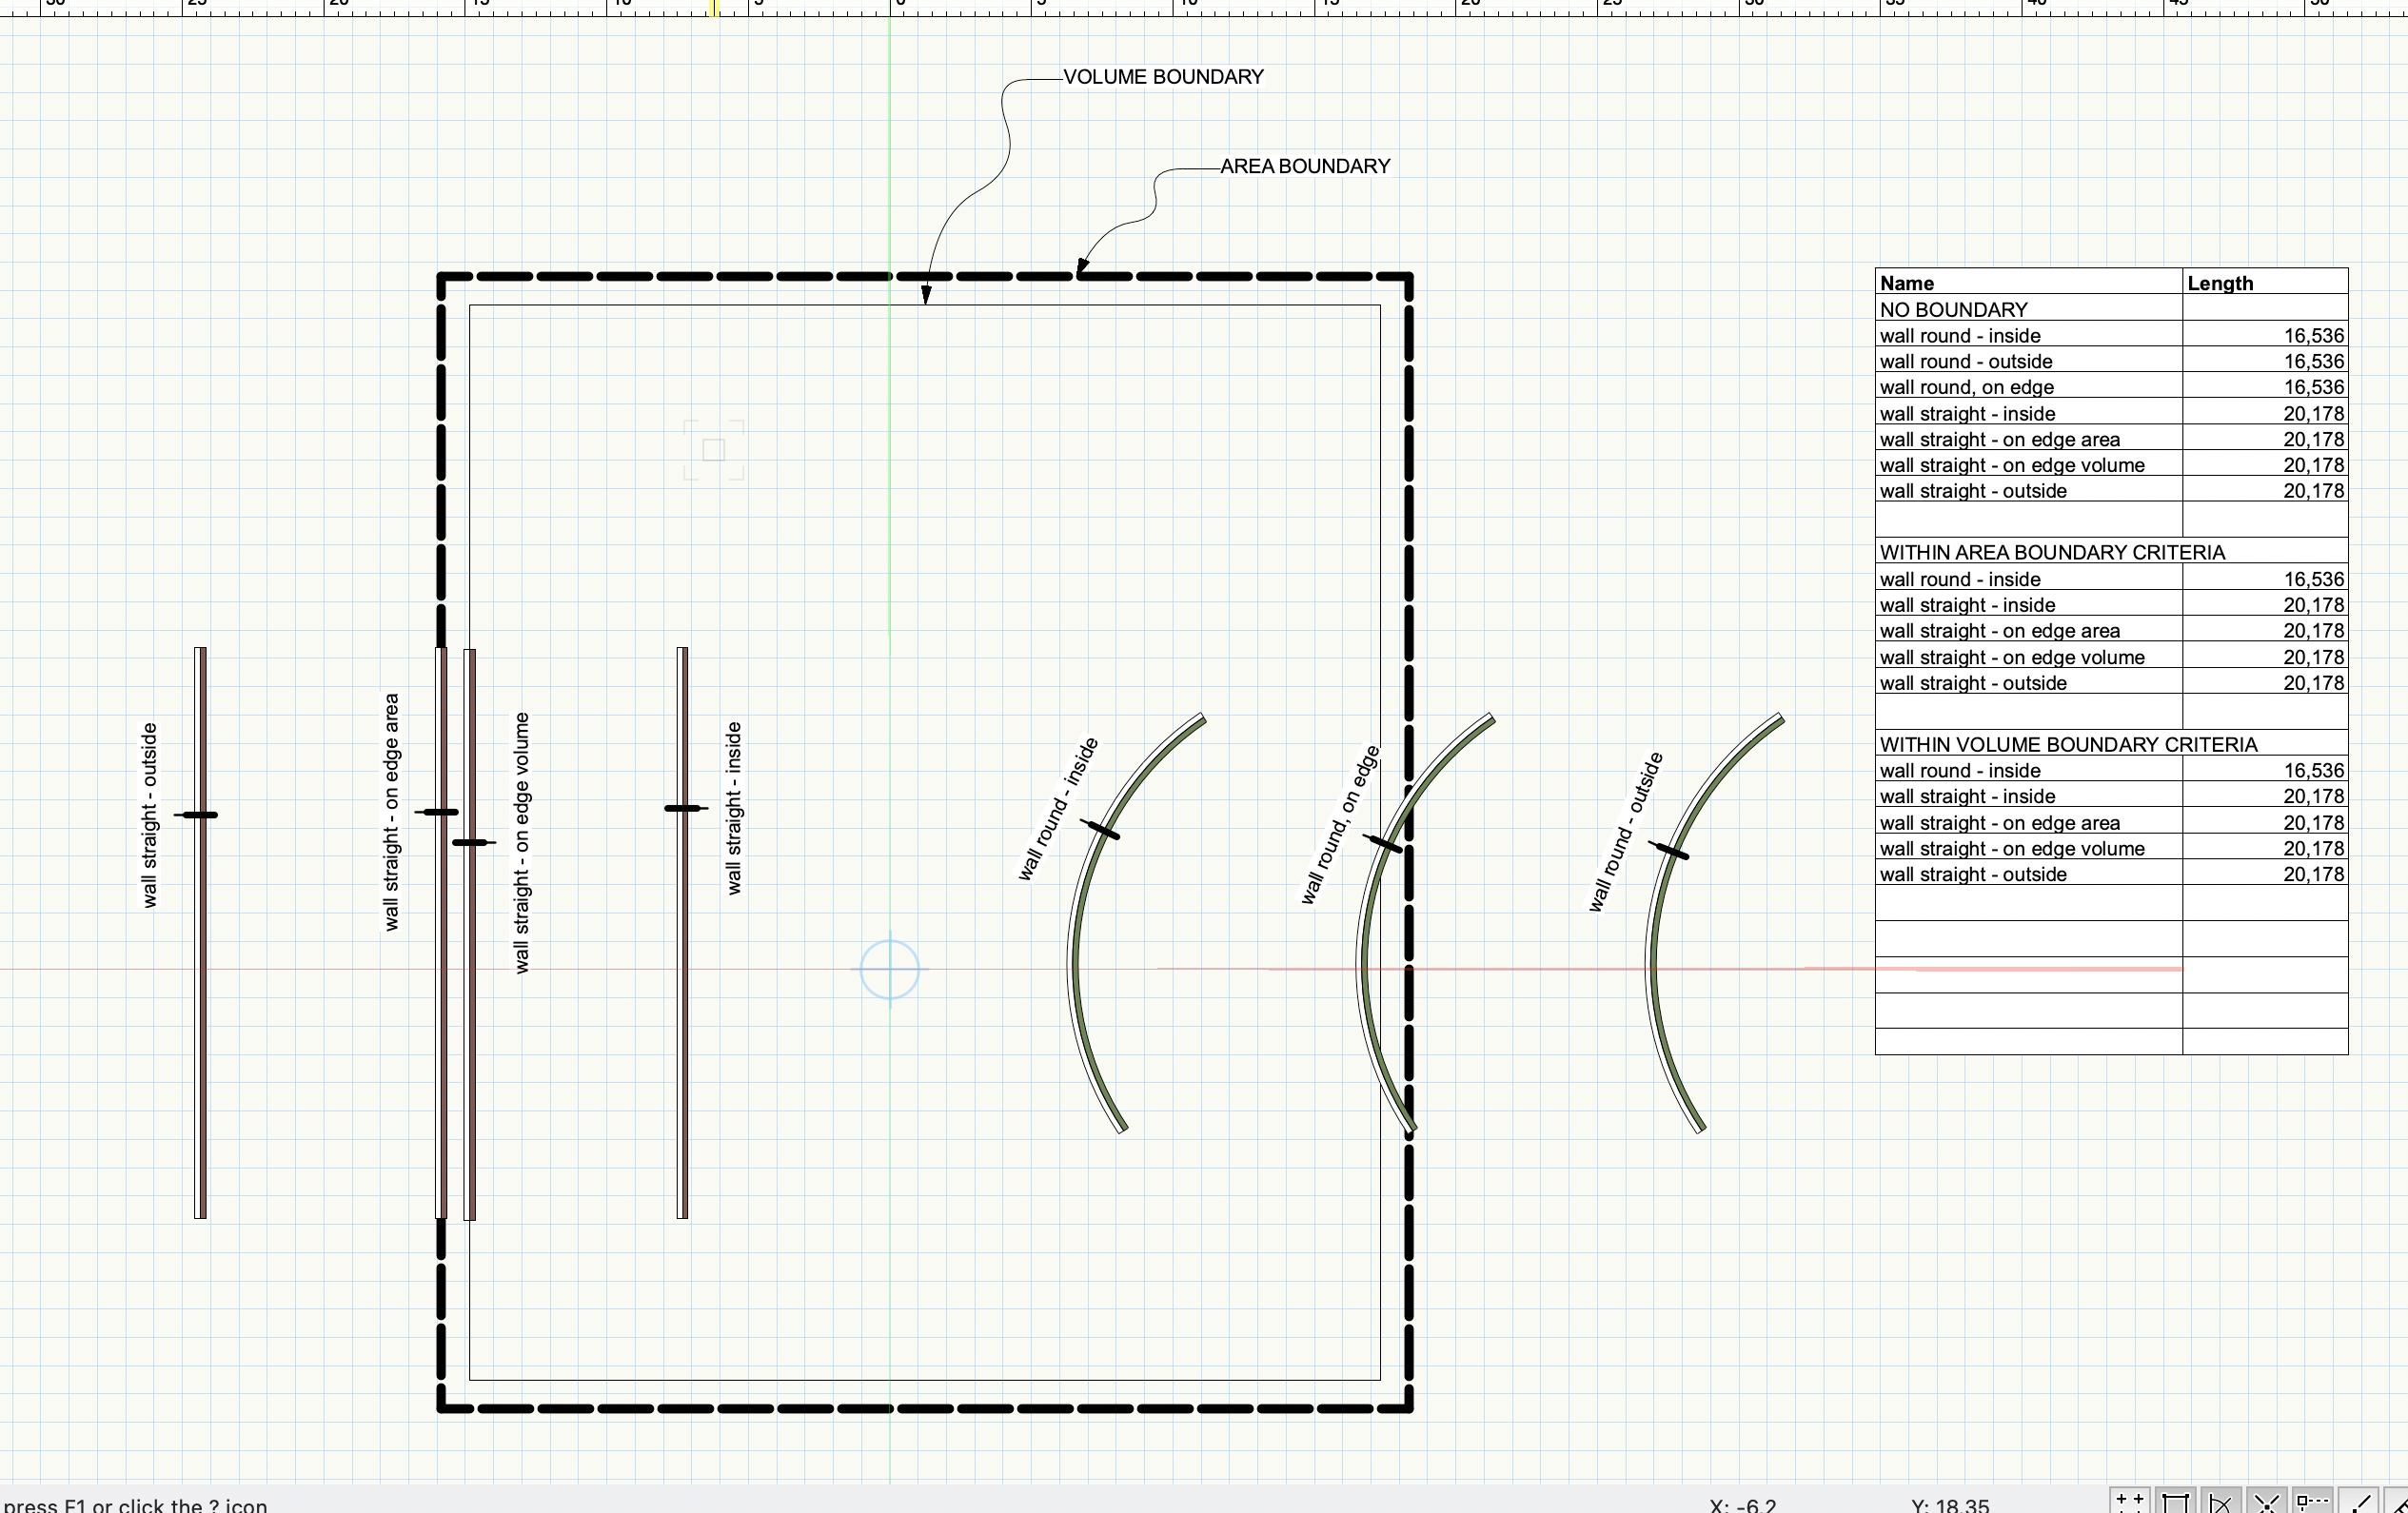
So this is a new feature for 2022 I believe. Which makes it really weird that the straight and round walls behave differently with the location filter. I guess they're still separate types under the hood somehow. Anyone at VW read this? Can we look forward to a solution? -
Quantity take-offs per property?
Anders Blomberg replied to Anders Blomberg's topic in General Discussion
@Pat Stanford Thanks for the suggestion. I made a trial file, attached here, and I'm still seeing some strange behaviour, although inconsistent with the issues in my project file. In the trial file I can actually filter out round walls on or outside the location boundary, no matter if it's an area or a volume boundary. In this file though, all straight walls still appears in the worksheet, no matter if they're located within or outside the boundary. Strangely this is the opposite behaviour from my project file where I don't get any straight walls at all in the worksheet. Boundary trial.vwx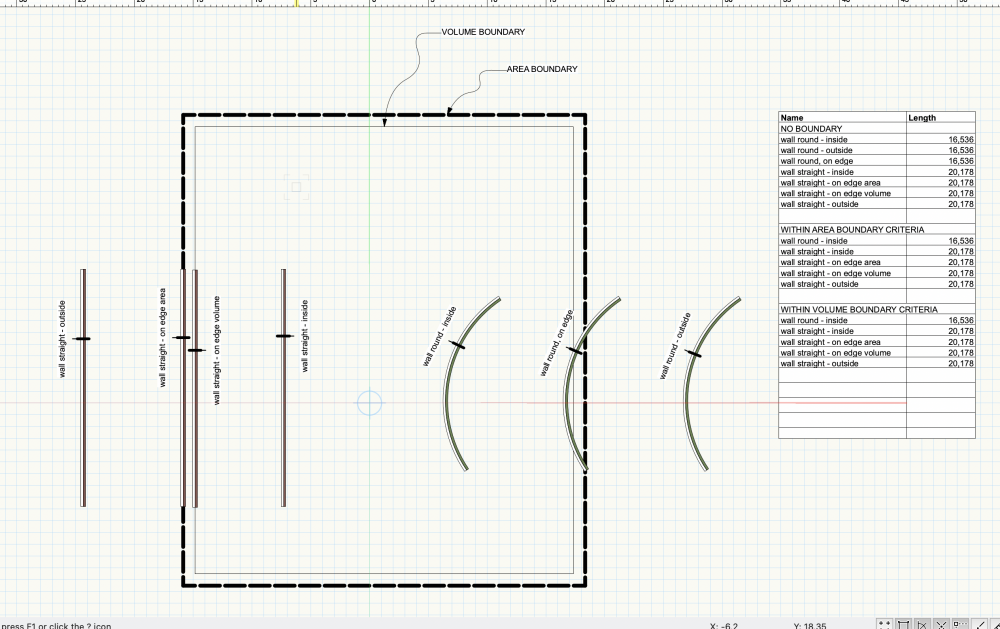
-
Quantity take-offs per property?
Anders Blomberg replied to Anders Blomberg's topic in General Discussion
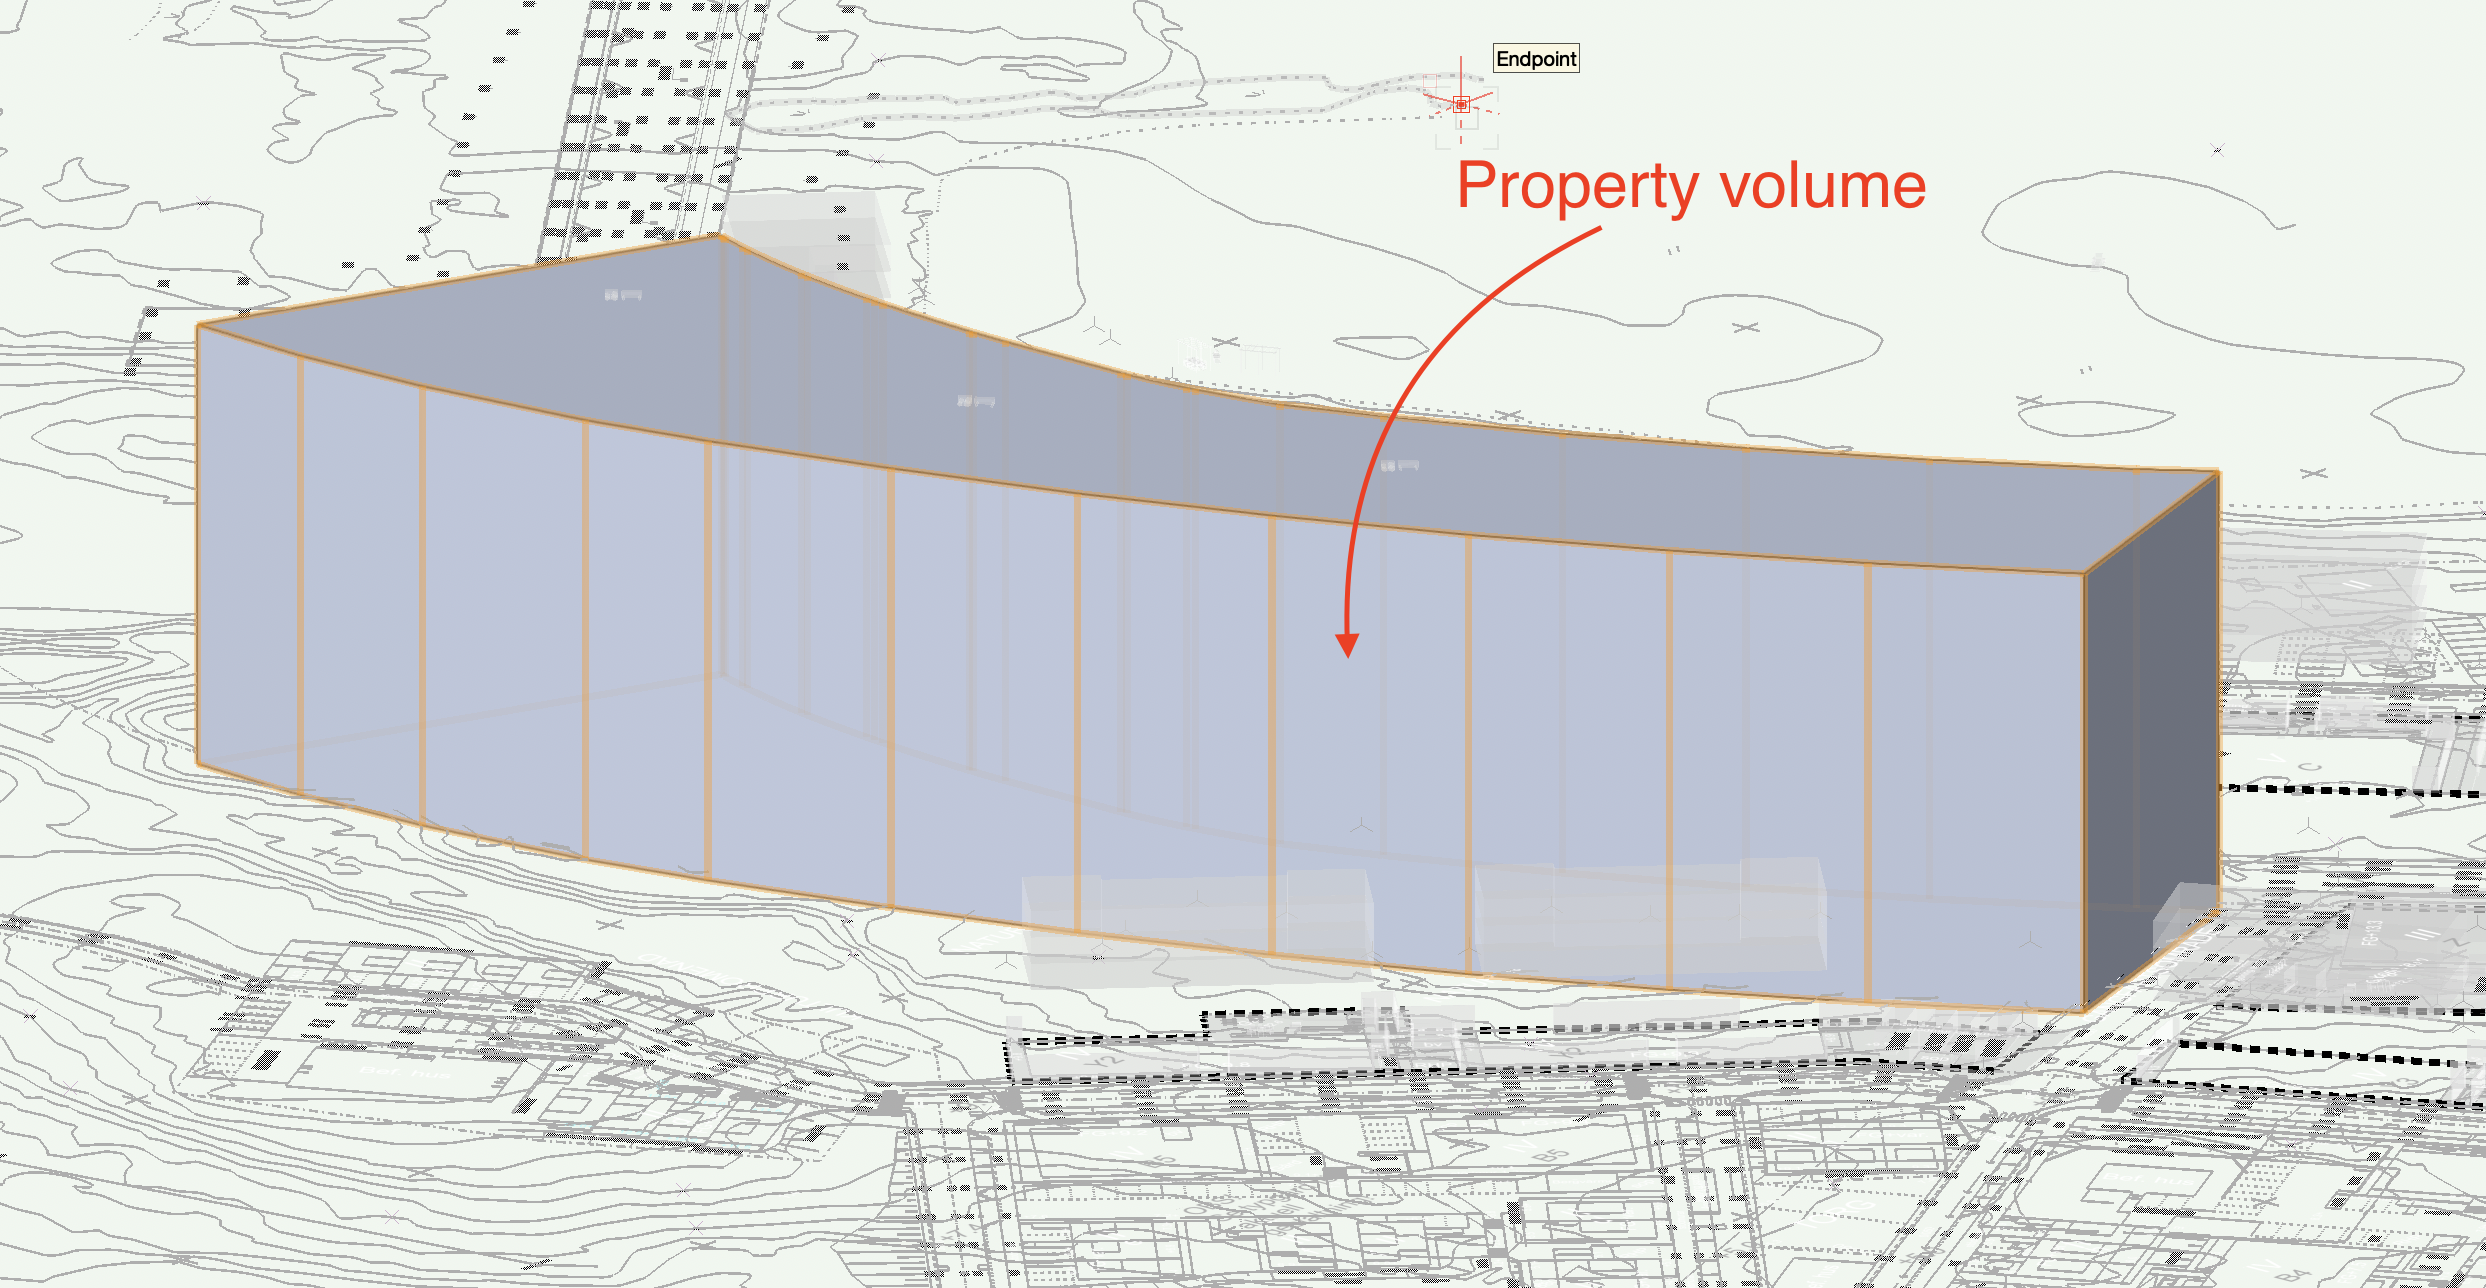
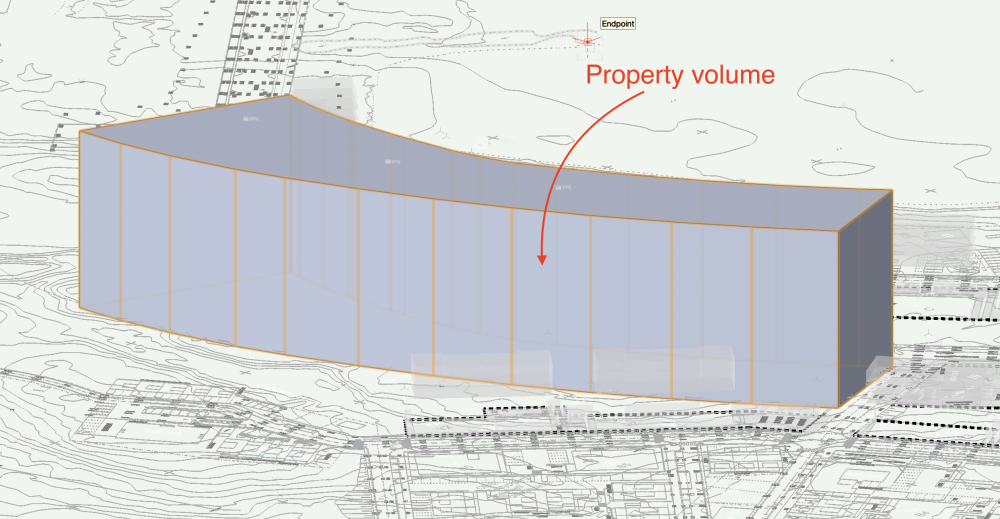
@JMR I did try to create a volume as a bounding box for the property, I also made an offset to start the volume at Z=-1 to make sure the walls are completely within the volume without touching the boundaries. This still yielded the same result with only the rounded wall.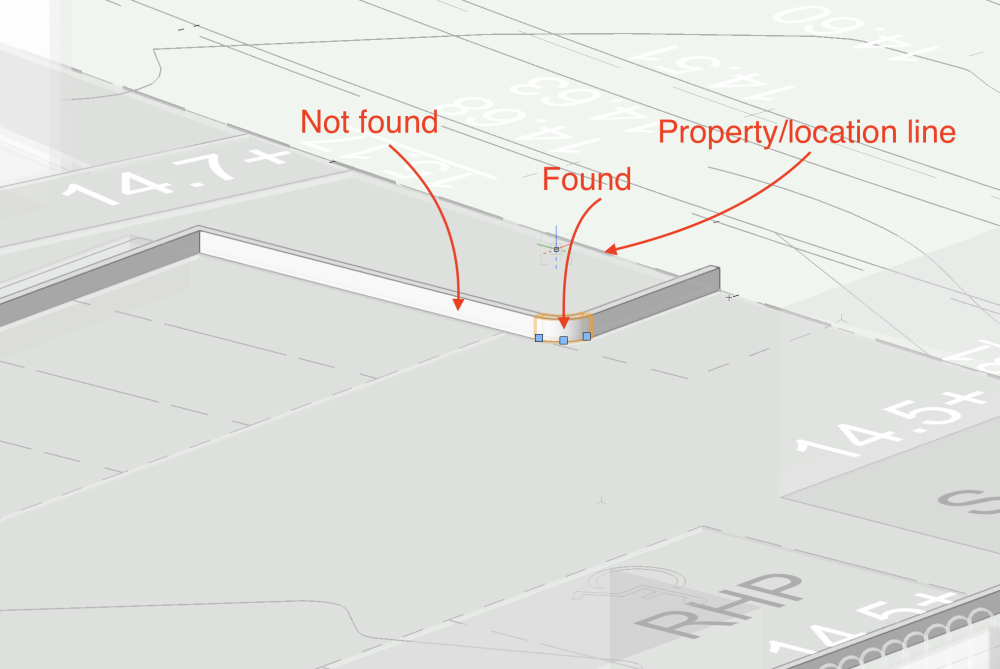
-
Quantity take-offs per property?
Anders Blomberg replied to Anders Blomberg's topic in General Discussion
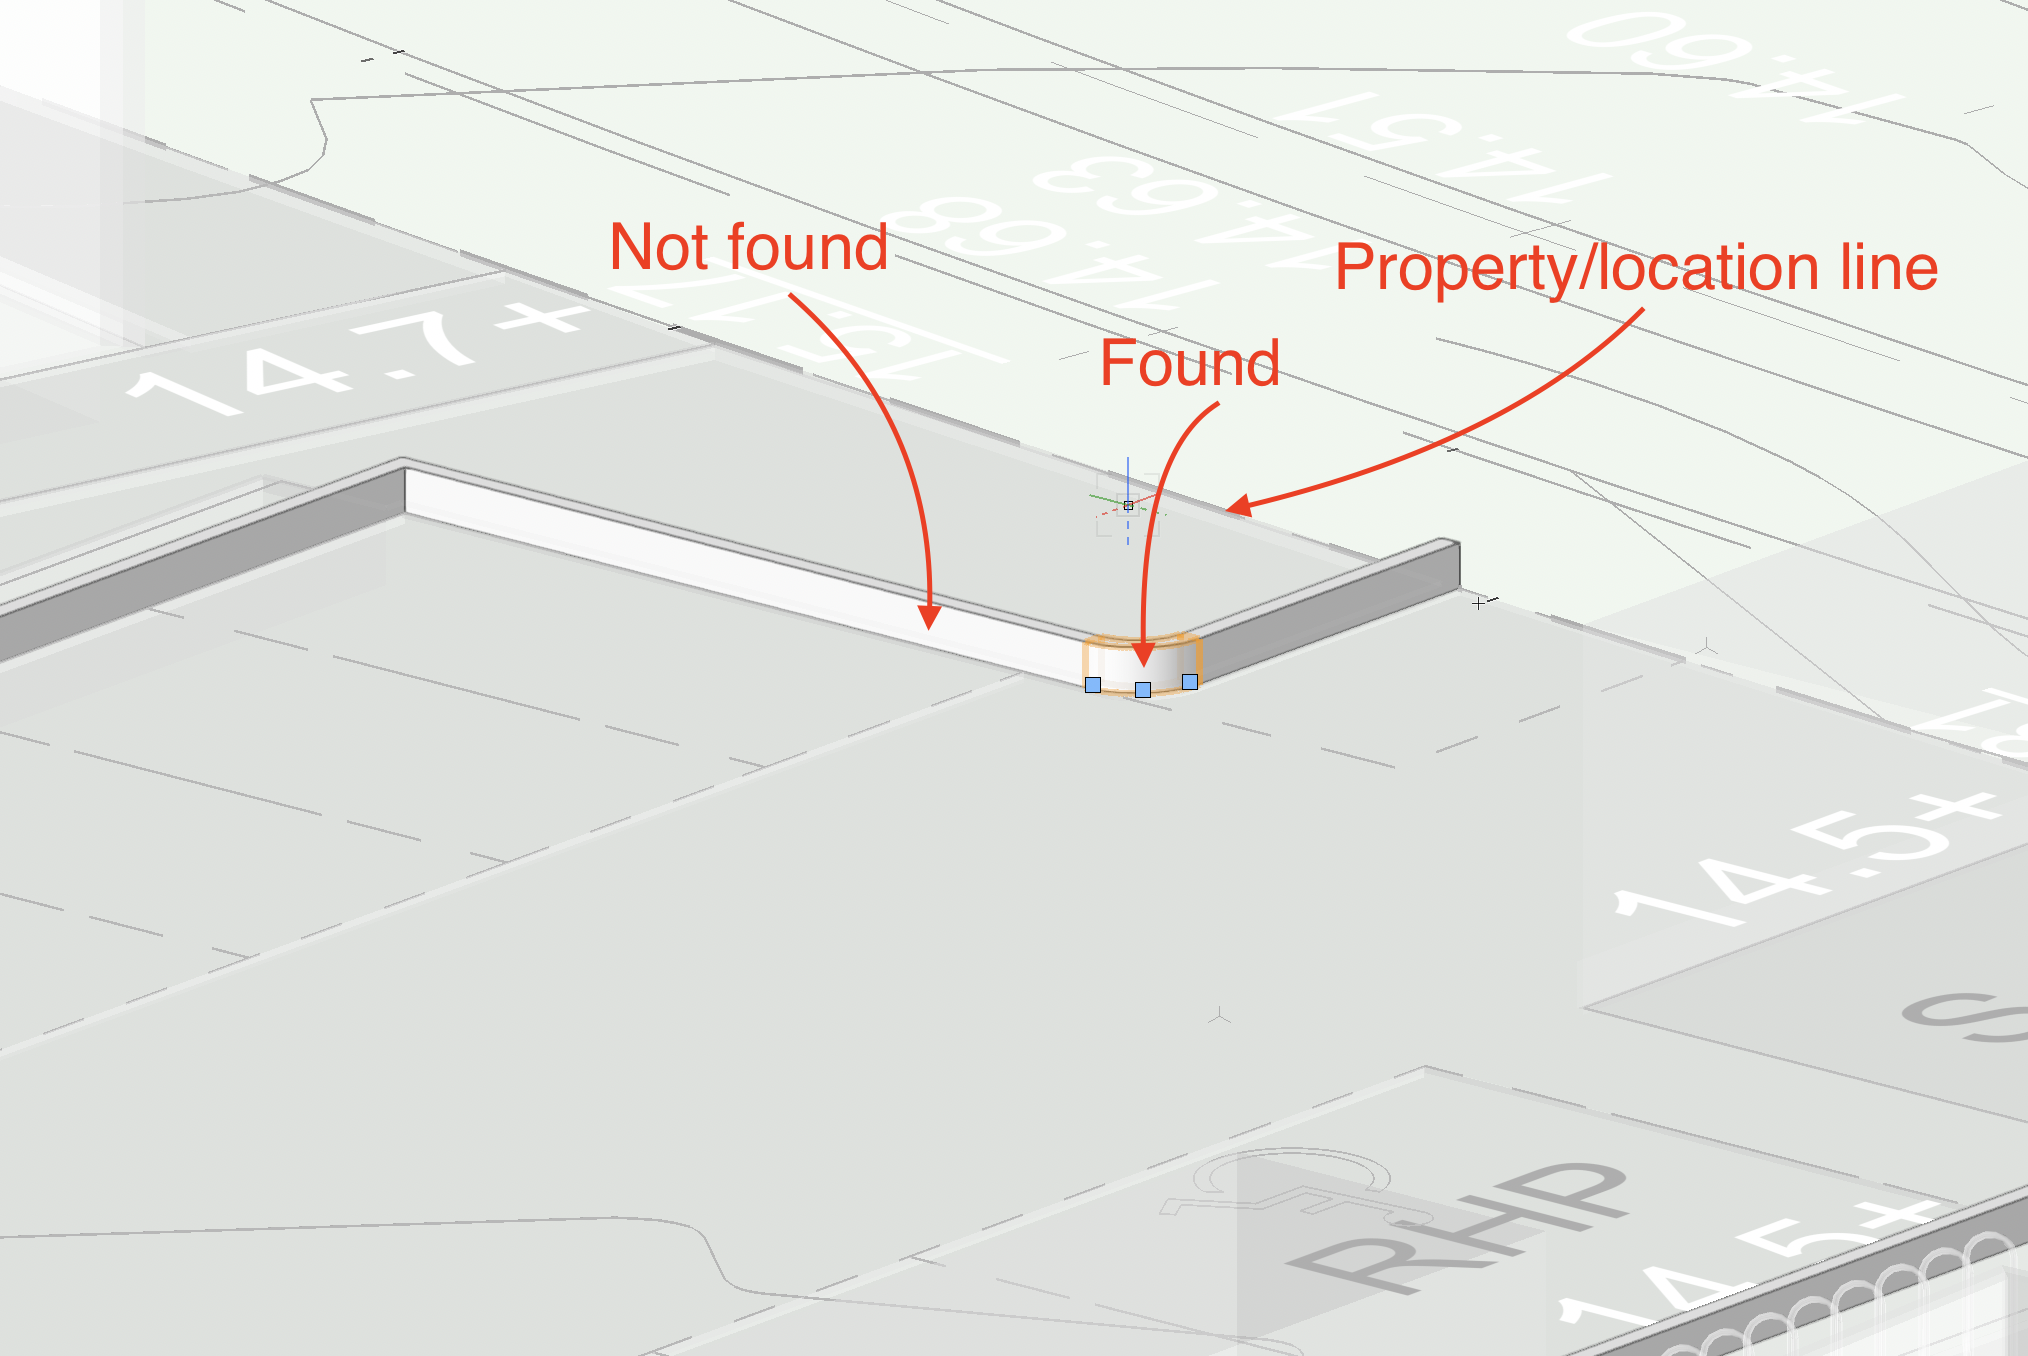
@JMR@Pat Stanford So this worked like a charm for plants and landscape areas, but when setting the criteria to walls I weirdly only got the few rounded walls I have in the model. When removing the location criteria the worksheet picked up all walls properly. Any idea as to why this strange behaviour is happening?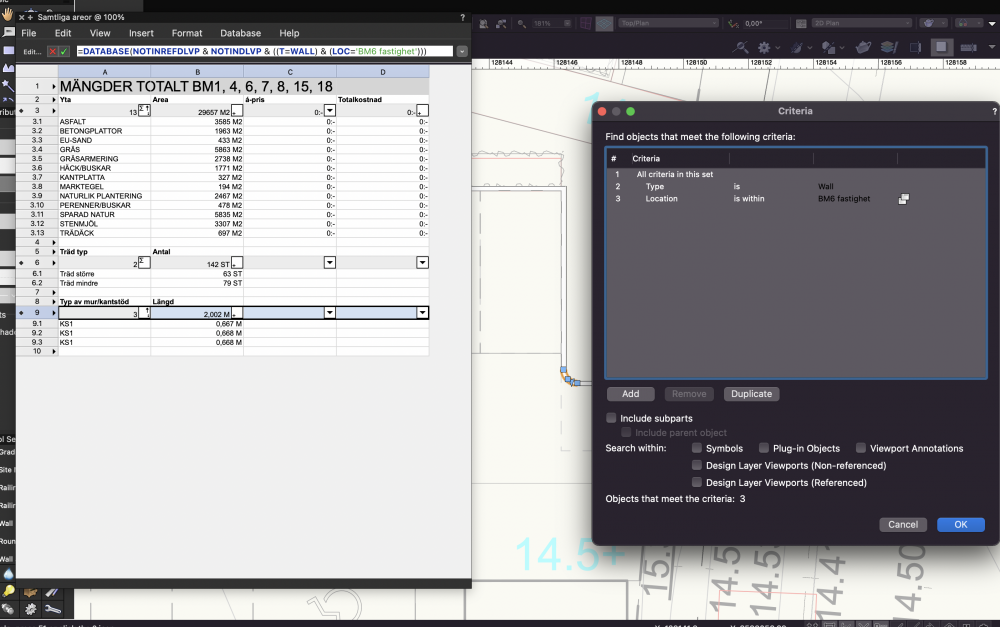
-
Quantity take-offs per property?
Anders Blomberg replied to Anders Blomberg's topic in General Discussion
Wow, very Cool! Seems to work the way I was hoping for! Sometimes VW really delivers! EDIT: I had it set up all wrong but figured it out so now I got it exactly like I wanted. HUGE thanks @JMR!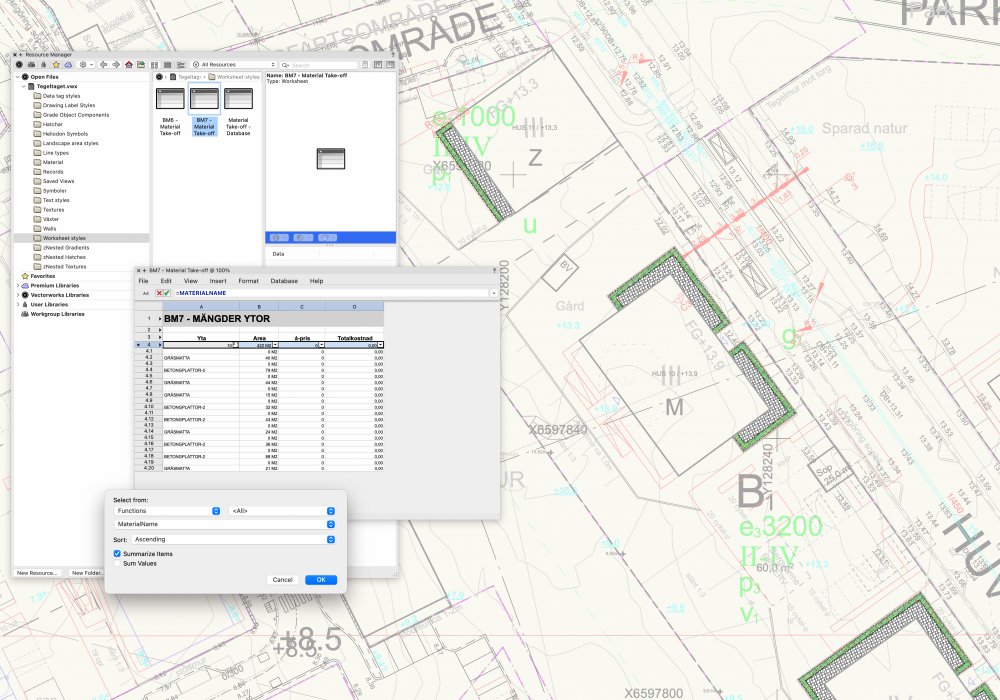
-
Quantity take-offs per property?
Anders Blomberg replied to Anders Blomberg's topic in General Discussion
I'll have a go at dividing up the layers. So I ran into another problem. The worksheet returns an empty layer for every landscape area. It also won't "sum items" and won't return the name of the landscape area correctly. Any ideas of what I'm doing wrong here?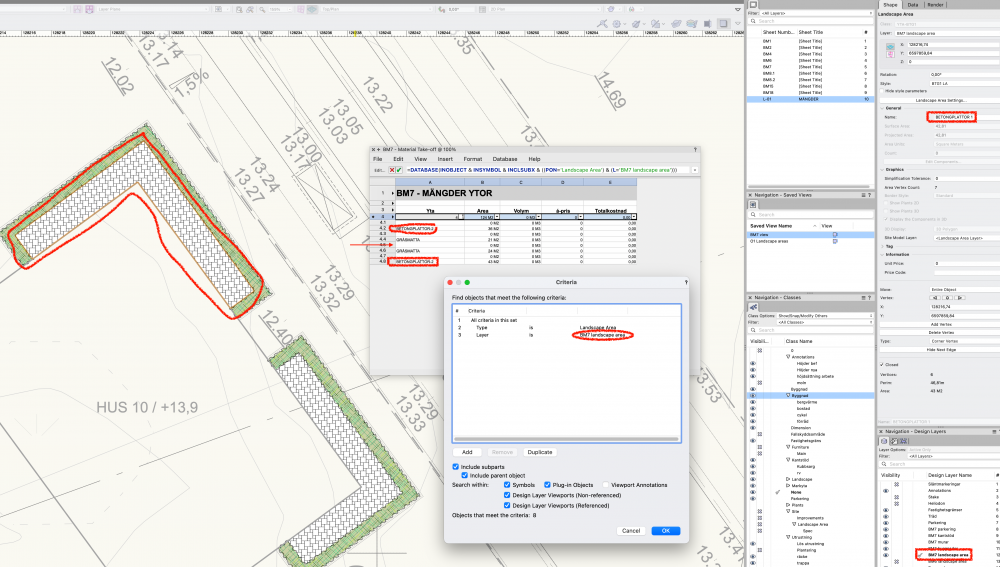
-
Is it possible to divide quantity take offs between different properties in worksheets in some way? I have 7 different properties and it'd be super sweet if I could get a worksheet with quantities per area. Currently all I have is a worksheet with all combined quantities for all areas. The only solution I've figured out so far would be to create separate layers for all properties, but I was hoping there might be an easier way of doing it? The objects are mainly landscape areas (consisting of materials), walls (for curbs and retaining walls) and plants. No buildings for me.
-
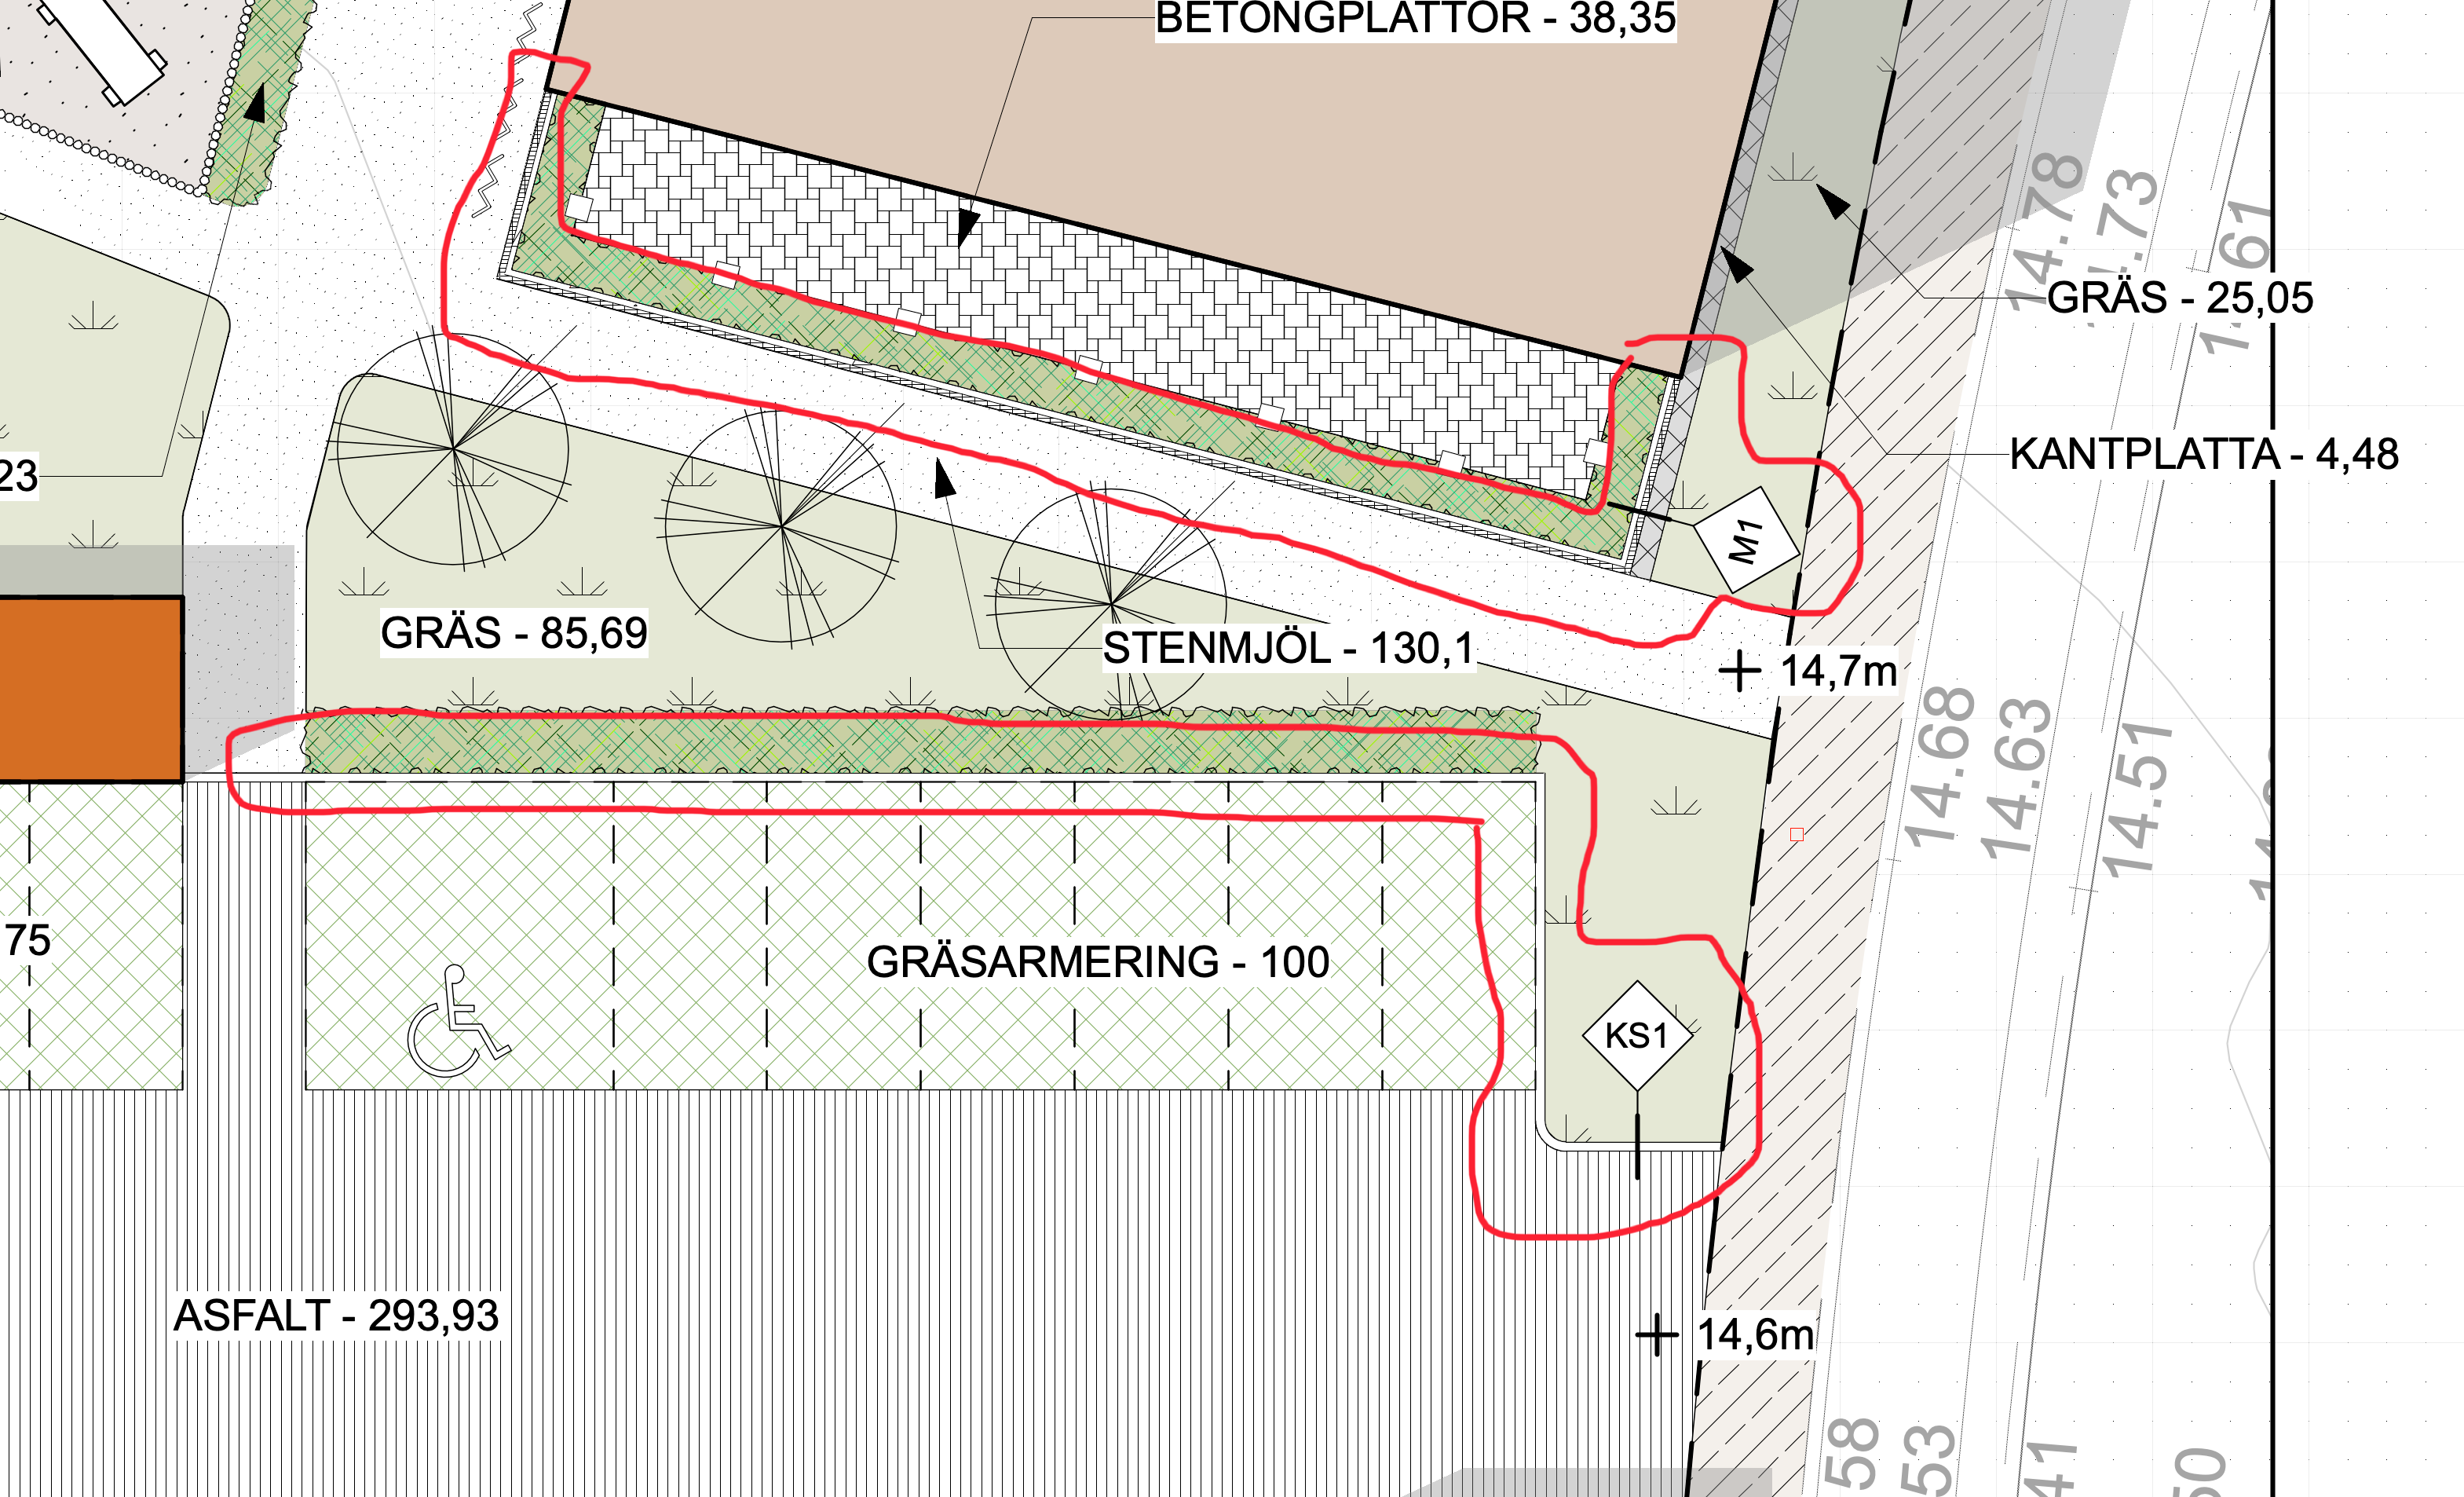
In lack of a better tool for curbs and retaining walls I'm using the wall tool for that. I found a nice data tag for the ID of the wall (M1 and KS1 below). Is there a way to also pick up the length of the wall in either a worksheet or, preferably, in a data tag?

-
Examples of nice plan illustrations?
Anders Blomberg replied to Anders Blomberg's topic in General Discussion
@rDesign That certainly gives me some inspiration for the technical side! Was mainly thinking of more illustratrative plans though. I suppose there might be some buried deep in the forum but I couldn't find any. @zoomer Comforting to hear! I'll try and stay within VW for sure. -
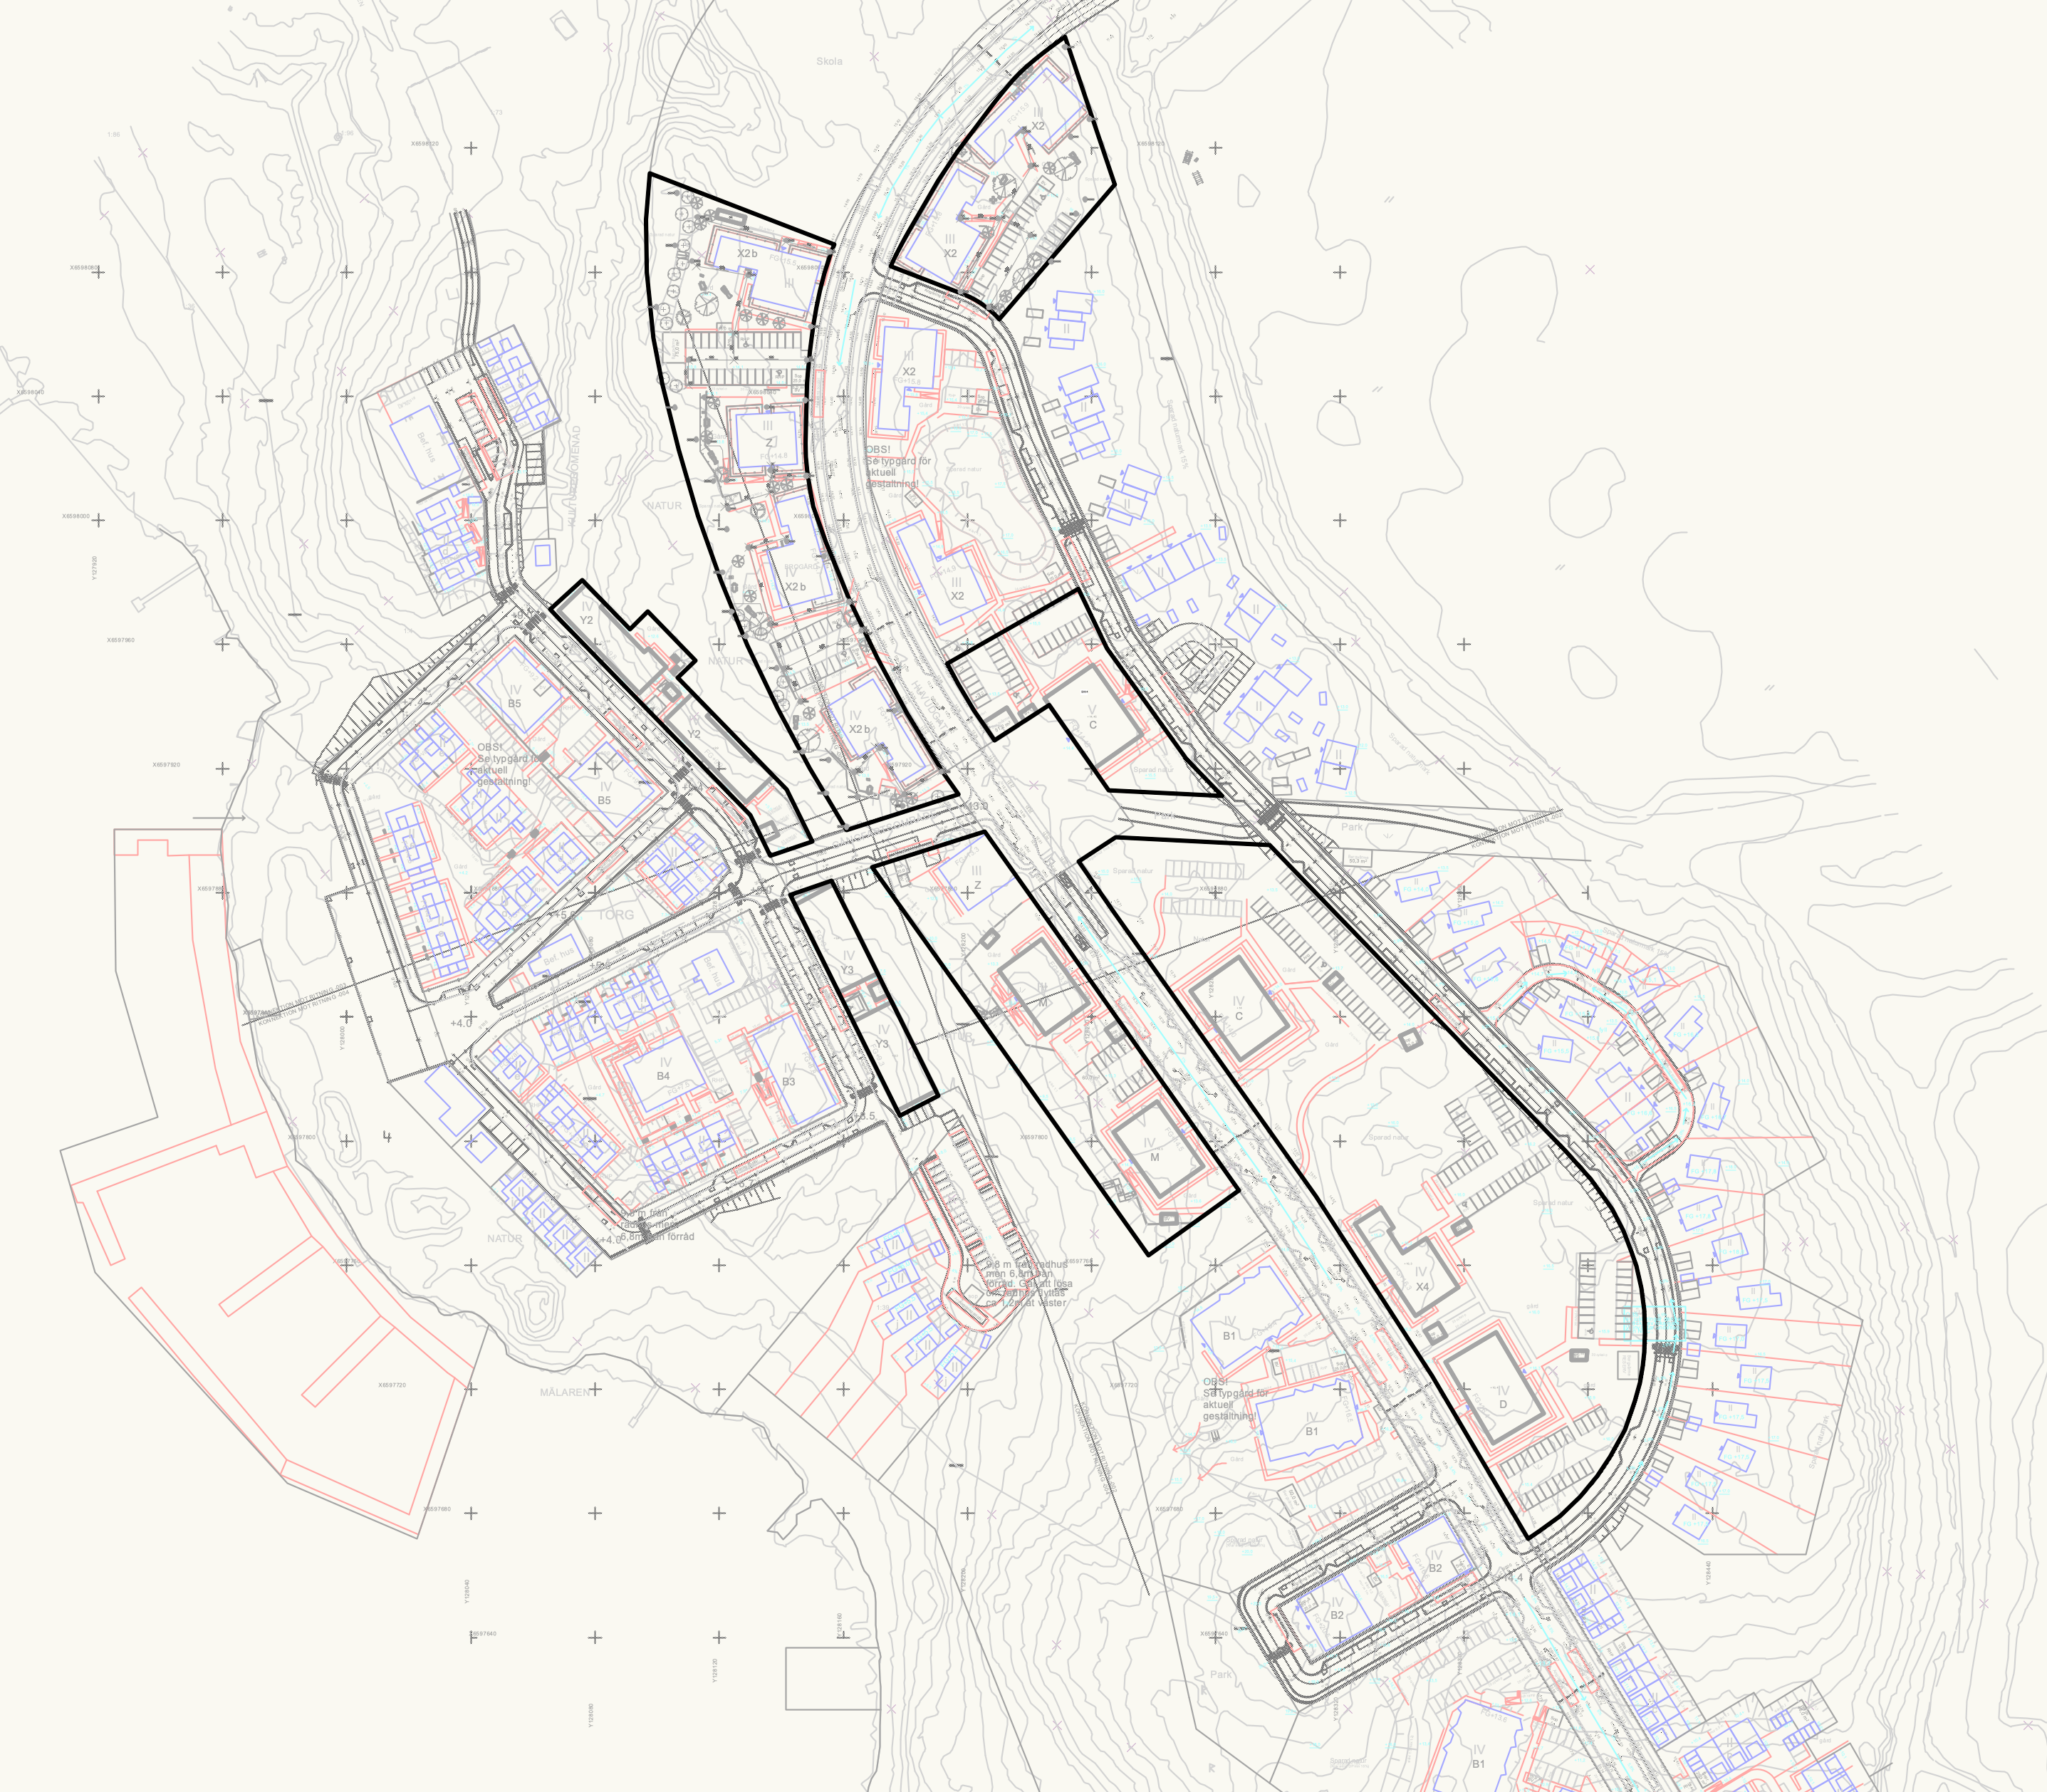
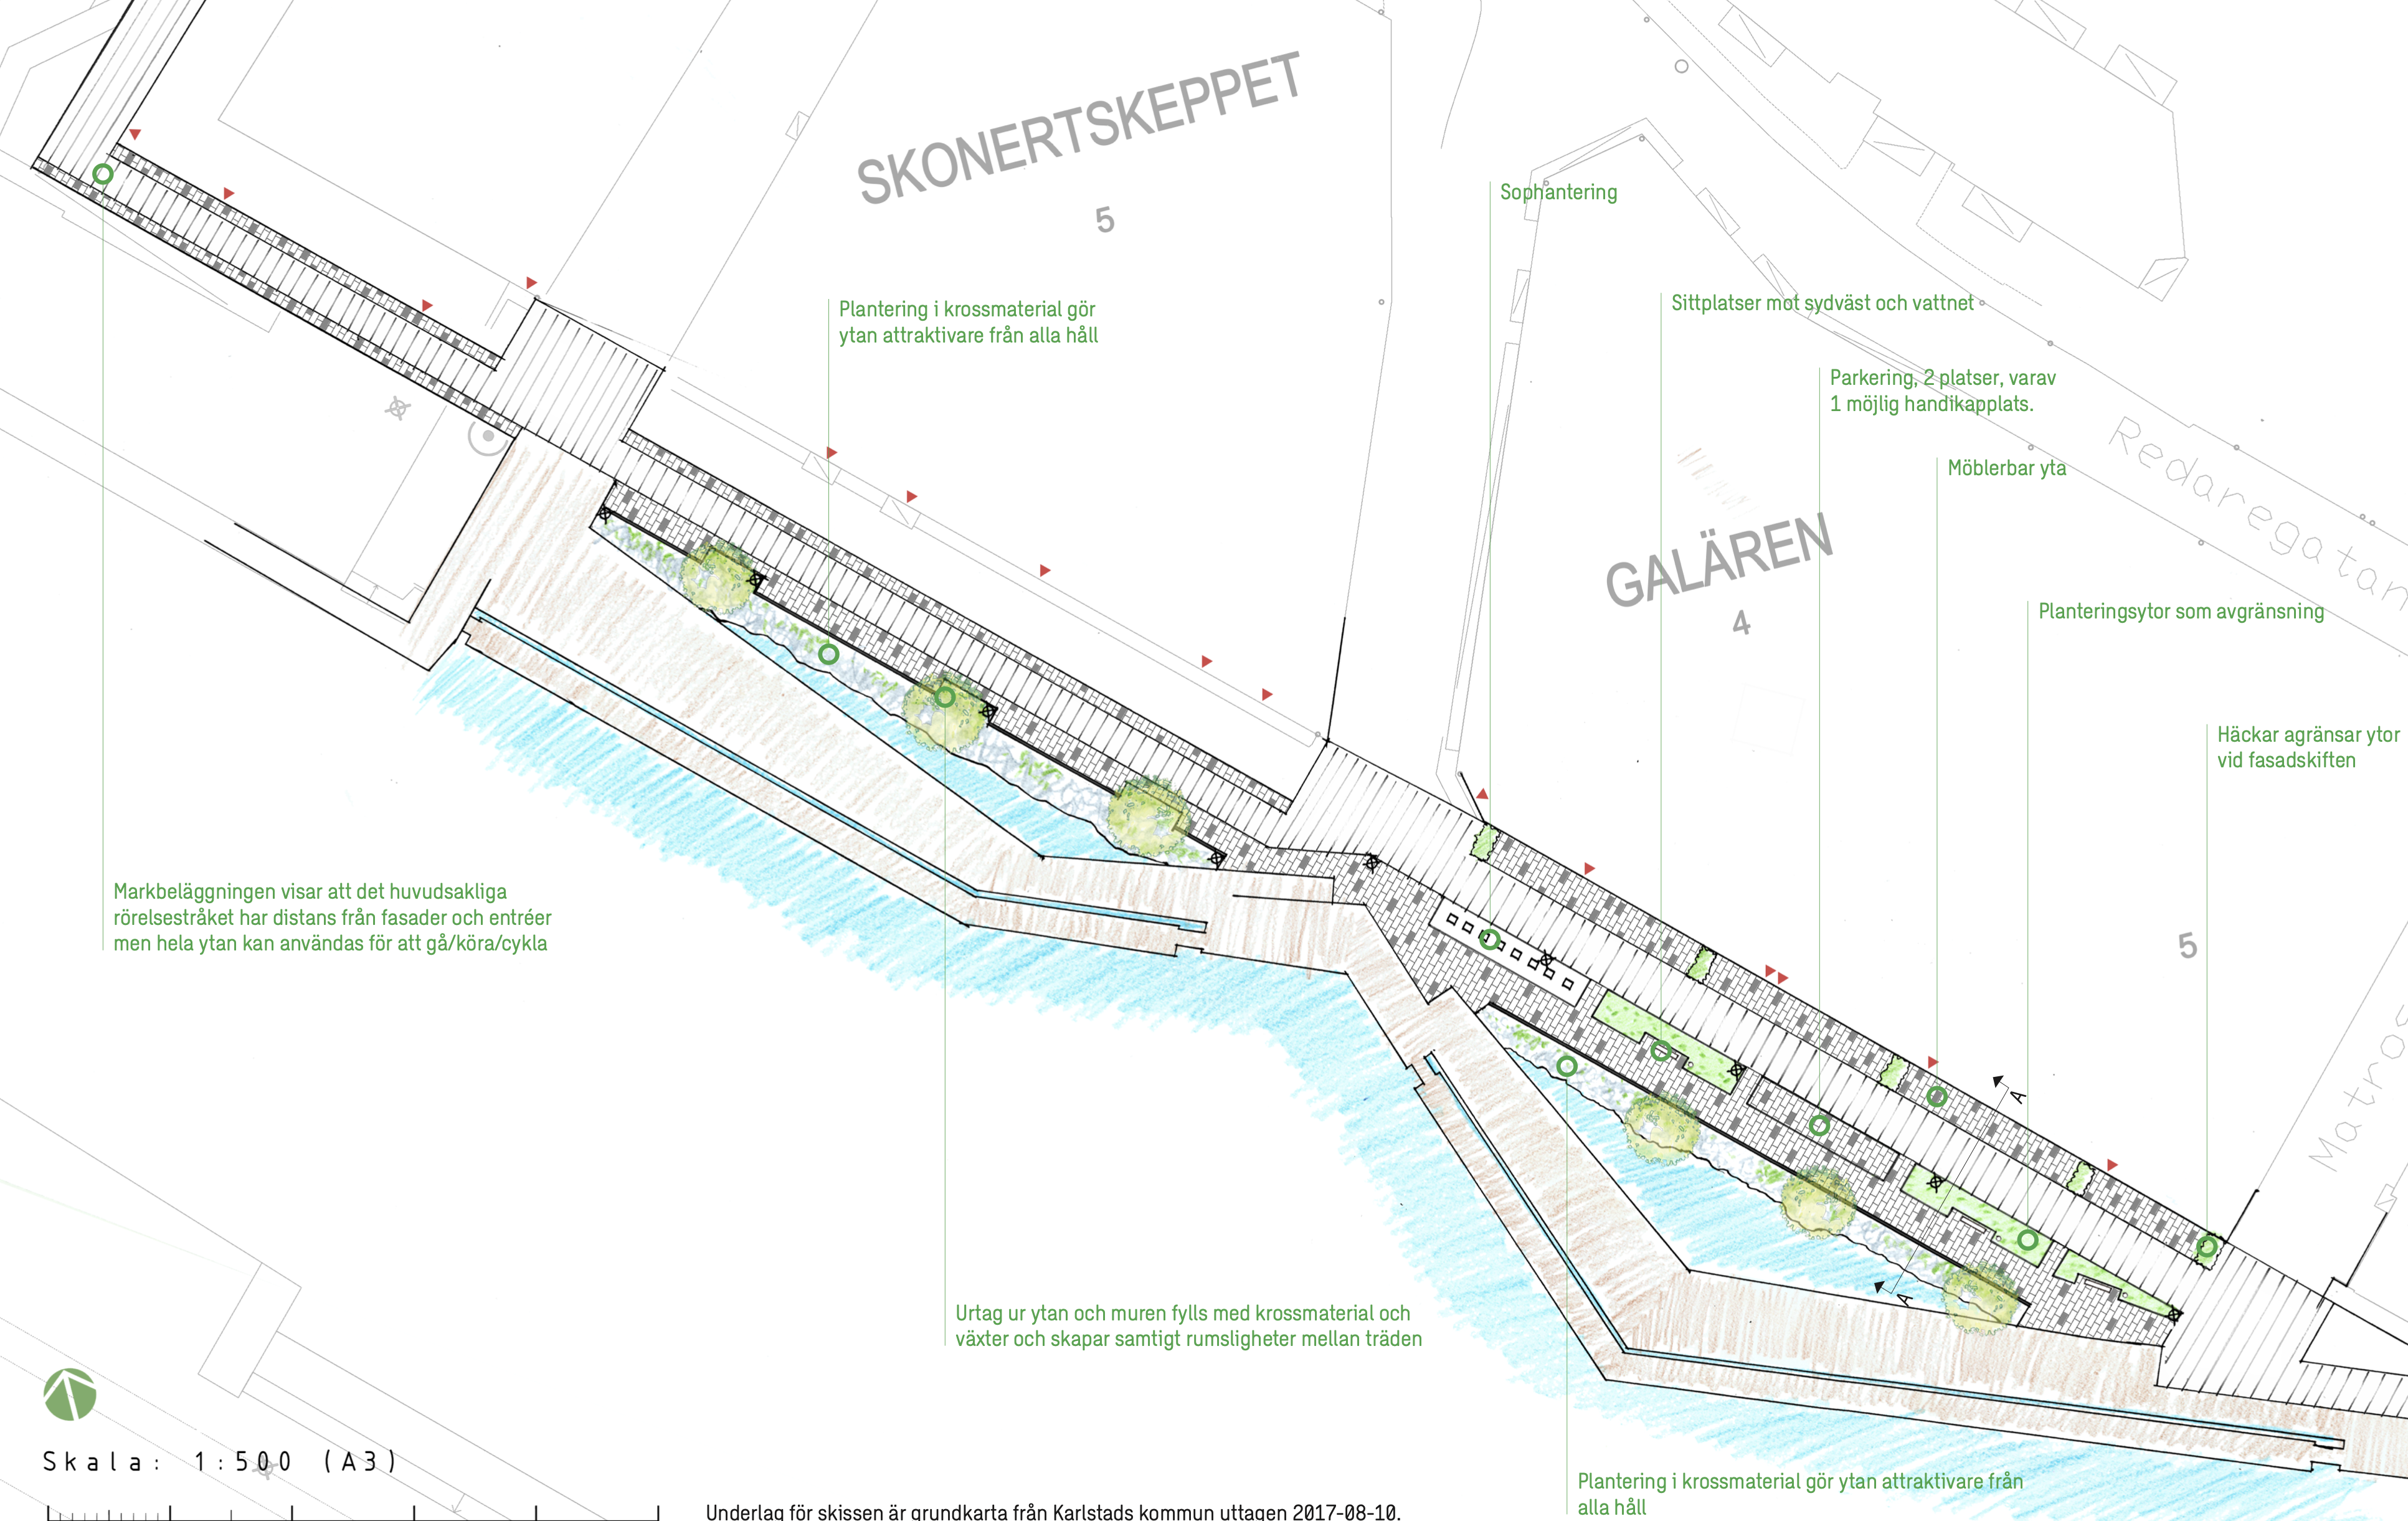
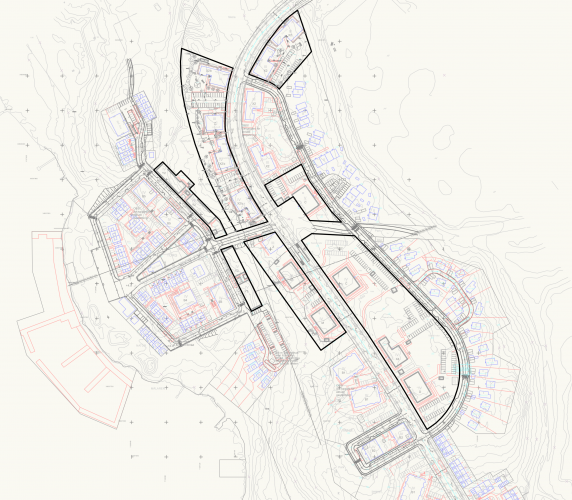
I used to create plan illustrations from 2D AutoCAD drawings, color them in Photoshop, and adding text in InDesign, sometimes with a little manual hand drawing as an addition. Definitely not on an expert level but good enough for simple plans. An example below. I believe I would be able to do this all within VW to save some time (and licensing money). I haven't really played around with illustrations/visualisations to much yet but it'd be interesting to see examples of plan drawings made in VectorWorks, just to get inspired and see what can be done. Anyone willing to share some work they've done and/or some tips & tricks?

-
Site model from large amount of 3d Loci
Anders Blomberg replied to Anders Blomberg's topic in General Discussion
Yup, that move is the issue. It was located with correct coordinates within Sweref99 18 00, the local system. Now it sits in the middle of the Atlantic 🙂 I had no issues importing the loci but couldn't select them for transforming. I'll have another go and see if it makes a difference to import with 3D only, as suggested. I really thought my hyped M1 would be able to handle more than the old Intel processor. Maybe it's a memory thing, it's on the short side there. -
Site model from large amount of 3d Loci
Anders Blomberg replied to Anders Blomberg's topic in General Discussion
@Kevin K Wonderful! Seems like I lost the correct coordinates for the model there though? How did you manage to create the model? I didn't request the data myself but got it from a contractor. The origin of the file is the national Swedish terrain model. It might be possible to request the data in another format, I'll ask. The contractor had no issues handling the data as it was delivered in Novapoint. -
I received a dwg containing a large amount of 3D loci, roughly 250.000, as survey data. I'm not sure if that's considered a "point cloud" but it's certainly a large amount of points 🙂 I can't even select them all without getting the eternal spinning wheel in WV so I can't really create a site model from the file. My idea was to import the dwg into WV and then select the points and "create model from source data". Any tips for handling the situation? DWG attached. Bro_SW1800.dwg
-
@Nikolay Zhelyazkov Ok! Yes, by layers I was referring to components. Always good to know the limits. I hope the tagging of components gets more developed in the future then.
-
@Tom W. @Nikolay Zhelyazkov It's really cool to see this discussion develop and it really helps me as a rookie in the software. Thank's for that! So anyways, the data tag you describe is way better than the manual solution I used. But am I understanding it correctly that I have to create a separate data tag style per layer in my slab? I can't just click on the layer and have the tag return the material or name of that particular layer in the tag? In addition to being some extra work it also introduces the risk of having the leader pointing to another layer then what the data tag is actually reporting on. Or am I getting it wrong here?
-
@Nikolay Zhelyazkov Attached is my sample file. I'm hoping to report the Material Mark in a Data Tag. I deleted everything but the stuff used for the drawing so you can see how I made it. I also used the "MaterialProperty('MaterialMark')" for the table and tried the same for the data tag but couldn't get it to work so I manually created the callouts. I don't really care if it's the Mark text I'm getting or some other field where I can create an ID. Preferably I'd like the ID for the material to number automatically so I don't have to go in and manually change in the the material if materials are added or removed from the project. Landscape section test.vwx
-
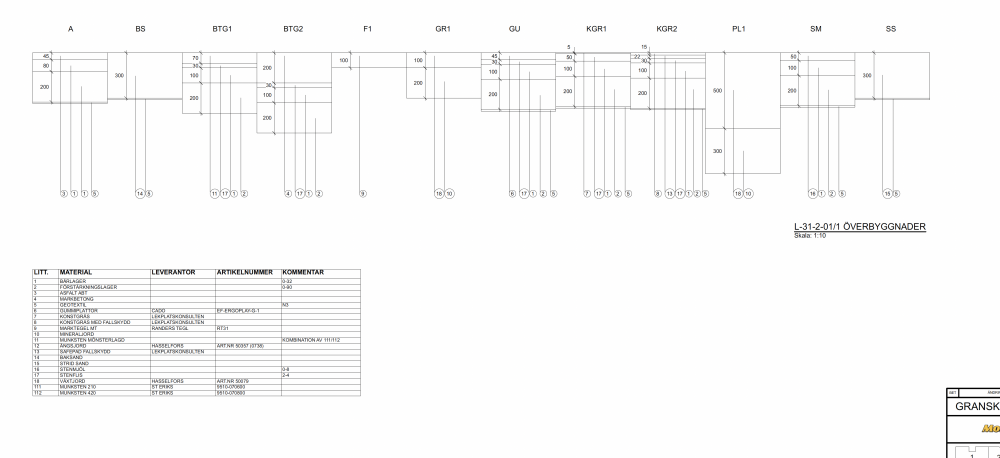
@Tom W. Well I managed to produce a drawing but much less intelligently then I would have hoped for. "LITT" in the table is the mark field that I was hoping to retrieve with the data tag. I couldn't work it out so I manually created Callouts for the section. It really feels like it's extra work and it introduces the risk of getting it wrong. Ideally there would be a tool for creating this kind of drawing with just a few clicks. I produce this kind of drawing for literally every project where I'm creating construction documents, it's really a fundamental here in Sweden, don't know about the rest of the world? Since all the information is programmed into the materials and landscape areas it should really be a simple task to create a tool for this in Vectorworks. I never got the hatches to show and the volumes returned empty fields in some of the rows so I took those out of the drawing. Luckily I didn't have to deliver volumes/areas for the project. I don't think I used the sub-parts as I didn't need to report per landscape area but just the total. Maybe I should try that out next time.
-
Moving label position not working?
Anders Blomberg replied to Anders Blomberg's topic in General Discussion
You nailed it there @Pat Stanford! Sorry for posting these rookie mistakes here. -
Am I crazy or is it no longer possible to move the label/leader position of a stake, as in the attached screen shot that I made some time ago? Attached a super simple file just for reference. Label position.vwx
-
Multiple dimension formats in same file?
Anders Blomberg replied to Anders Blomberg's topic in General Discussion
Ah, I should have thought of that myself. Thanks!