Jump to content

Search the Community

Showing results for tags 'stake'.

  • Search By Tags

    Type tags separated by commas.
  • Search By Author

Content Type


Forums

  • Announcements
    • Announcements
    • News You Need
    • Job Board
  • Feedback
    • Roadmap
    • Wishlist - Feature and Content Requests
    • Known Issues
    • Wishes Granted / Issues Resolved
    • Forum Feedback
  • General
    • Troubleshooting
    • General Discussion
    • Architecture
    • Site Design
    • Entertainment
    • Previsualization
    • Braceworks
    • ConnectCAD
    • Energos
    • Rendering
    • Workflows
    • Buying and Selling Vectorworks Licenses
    • Hardware
  • Customization
    • AI Visualizer
    • Marionette
    • Vectorscript
    • Python Scripting
    • SDK
    • 3rd Party Services, Products and Events
    • Data Tags
  • Solids Modeling and 3D Printing
    • Subdivision
    • Solids Modeling
    • 3D Printing
  • Vectorworks in Action
  • Archive
    • Resource Sharing
    • Machine Design

Calendars

  • In-Person Training - North America
  • In-Person Training - UK
  • Coffee Breaks
  • Essentials Seminars
  • Webinars
  • Community Groups

Categories

  • Knowledgebase
    • Tech Bulletins
    • Troubleshooting
    • Workflows
    • How To
    • FAQs

Categories

  • Marionette - Objects
  • Marionette - Networks
  • Marionette - Nodes
  • Marionette - Menu Commands

Product Groups

There are no results to display.


Find results in...

Find results that contain...


Date Created

  • Start

    End


Last Updated

  • Start

    End


Filter by number of...

Joined

  • Start

    End


Group


Occupation


Homepage


Hobbies


Location


Skype

Found 8 results

  1. In Vectorworks Landmark 2026 I'm trying to create a custom Data Tag for Stake objects which displays the Description, X coordinate, Y coordinate and Z coordinate, with units. However, the X and Y coordinate values of the Data Tag, obtained from the Stake object's Easting and Northing fields, are displayed in millimetres despite the document units being set to metres. Meanwhile the the Z coordinate value obtained from the Stake object's Z Value field displays correctly. The Units dropdown menu is greyed out when selecting the Easting and Northing parameters, whereas it's active when selecting the Z Value parameter, which indicates that they function differently. Unfortunately X Value and Y Value aren't available in the Stake object parameter list - it would be great if they could be added in a future update. Here's the Data Tag field definition (note the Units dropdown is greyed out with Easting selected): And here's the result applied to a Stake object, with the Data Tag values in blue on the left, and the Stake object's native X and Y coordinates in black on the right: As a workaround I can add /1000 after the easting and northing parameters in the field definition to get the correct numerical values (note also that the Units dropdown is available with Z Value selected): However, doing this makes the 'm' after the formulas invisible, as seen below. Also a different version of the tag would be required when switching document units, and the formula for imperial document units wouldn't be nearly as simple. There appears to be multiple threads describing similar isses since 2020 (linked below), with some quite complex explanations, case-specific suggestions, and workarounds. Is there something fundamental about how 'data' is processed in Vectorworks that lies behind all of these issues, that might be worth looking into? In the case of Northing and Easting values, which adhere to the document units in every other situation that they appear, it seems particularly strange and counterintuitive that they'd be locked to millimetres, especially in the context of a tool dedicated to customised data display.
  2. Hi all, I am trying to create a grading plan. I usually don't need to create a 3D model. So I prefer to do the grading plan in 2D. Normally I use Stake tool and log in the existing grading data along the property lines. And I use Grade Tool to get the slope. And when I calculate the interpolated grade between the existing grades, I measure the distance between the interpolated point to the existing grade point, and use a calculator do to the math. Then I manually log in the interpolated grade data. It takes quite a bit time if the site is huge. I wonder if there is a way to just pull the data between two existing grade points with the known slope? For example, check the snip below. The existing building grades of two points are 54.65m and 55.55m (these two are Stakes), and the slope is 6.5% (by the Grade tool). How can I generate the IBG (interpolated building grade) from the slope without manual calculation? Thank you!
  3. Hello guys, Do you know a way to change/edit/add different styles to Stake objects? Specifically, I would like to modify the circle cross style so the circle would be partially filled with color. Thanks in advance!
  4. At the Landmark 2019 Stake Elevation Z values are in error (always 0 values). In earlier version the problem could be usually solved, if I changed the stake Mode from "Include as site model data" to "Set elevation to Site Model", but now it won't work. Also the existing Stakes from earlier version, which now should be updated, do not update.
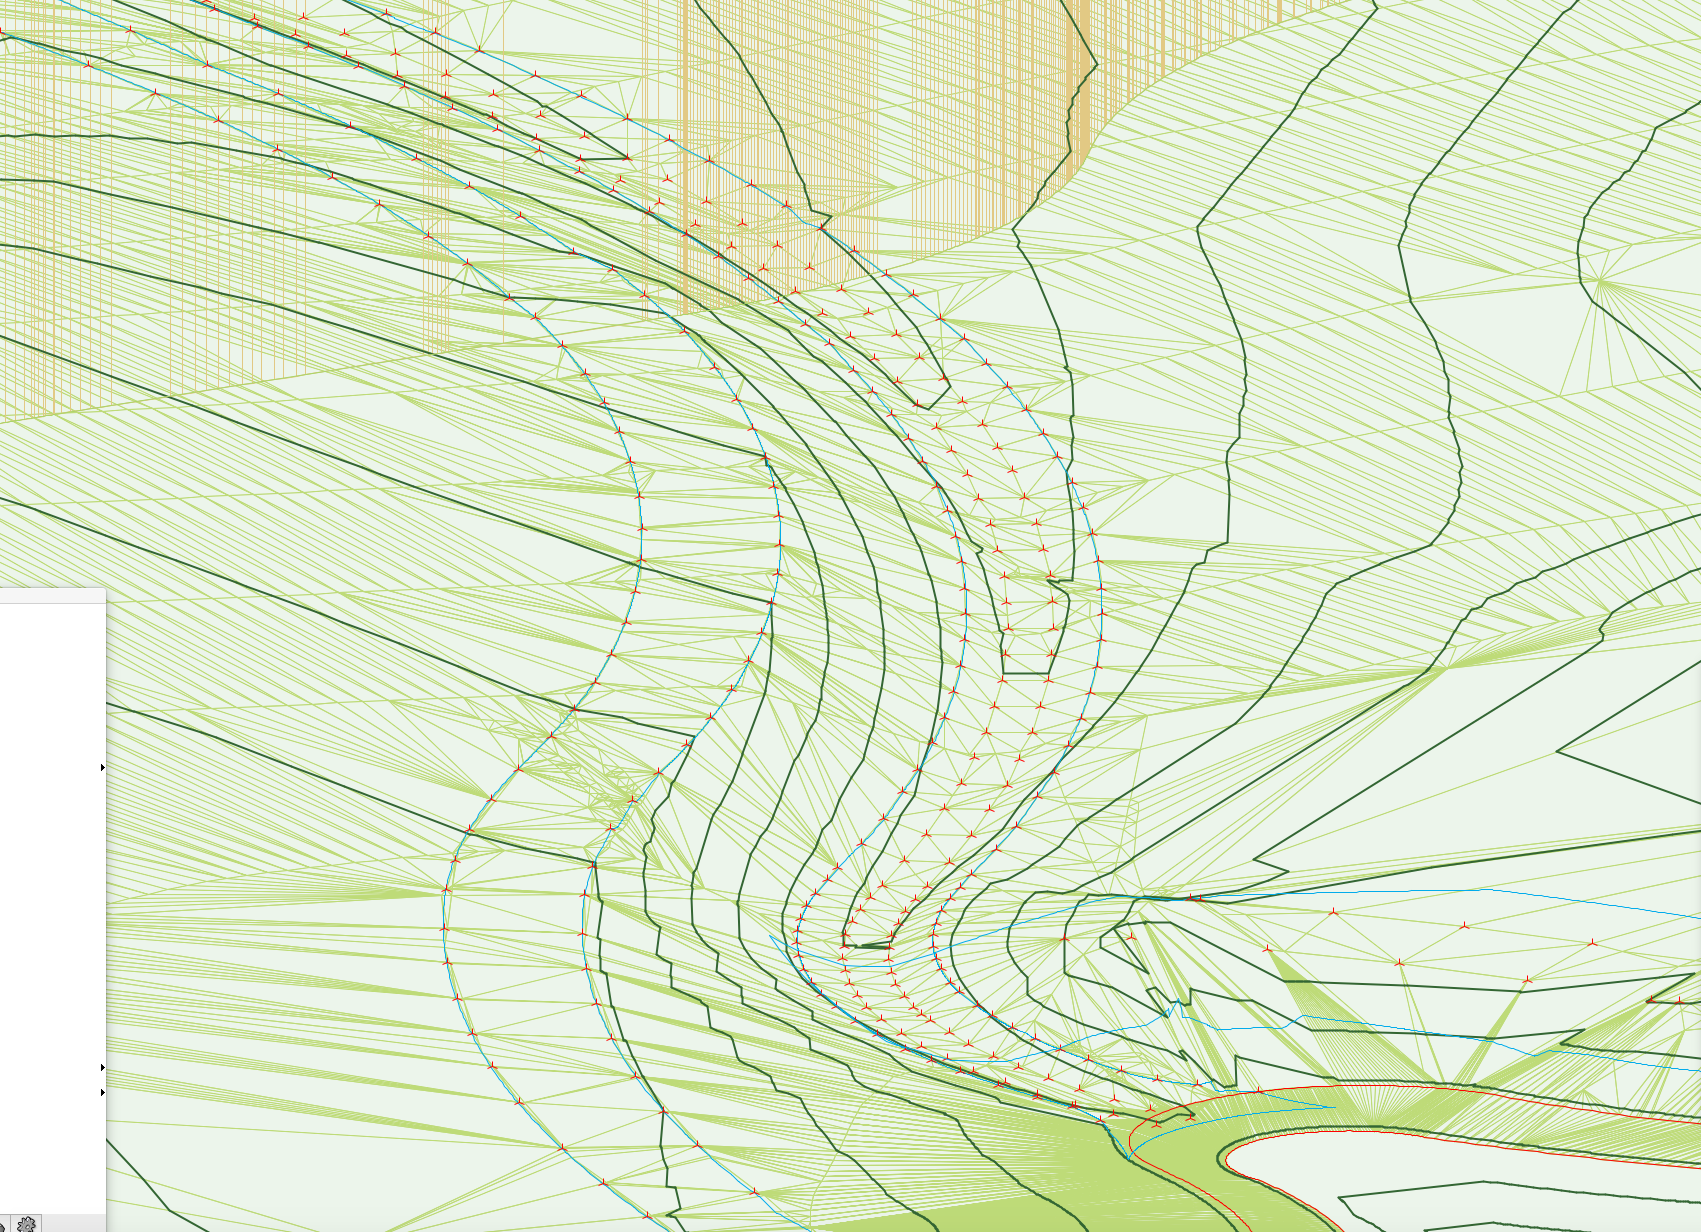
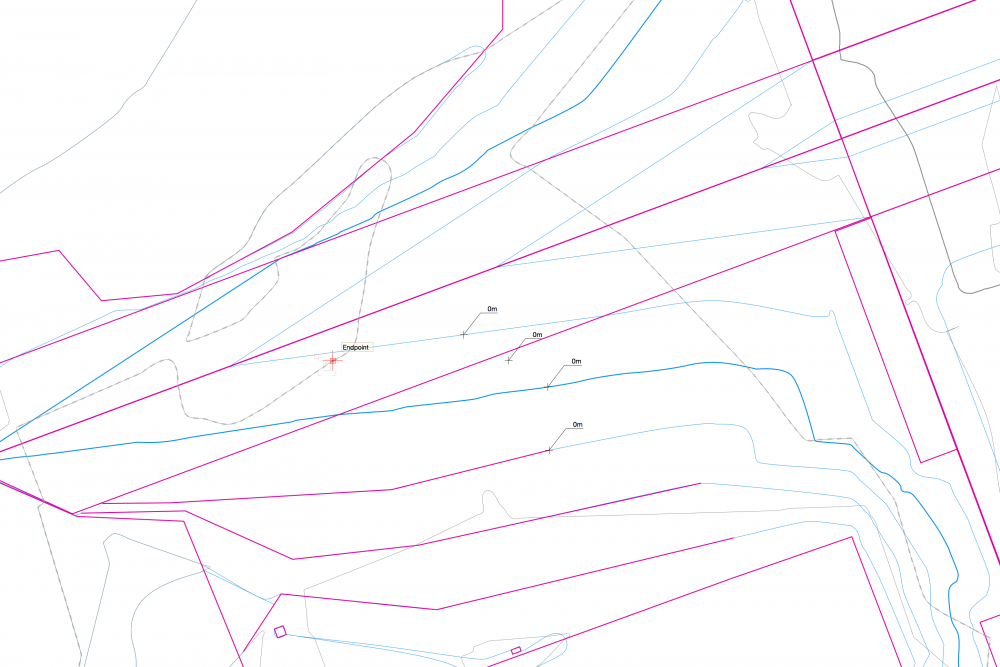
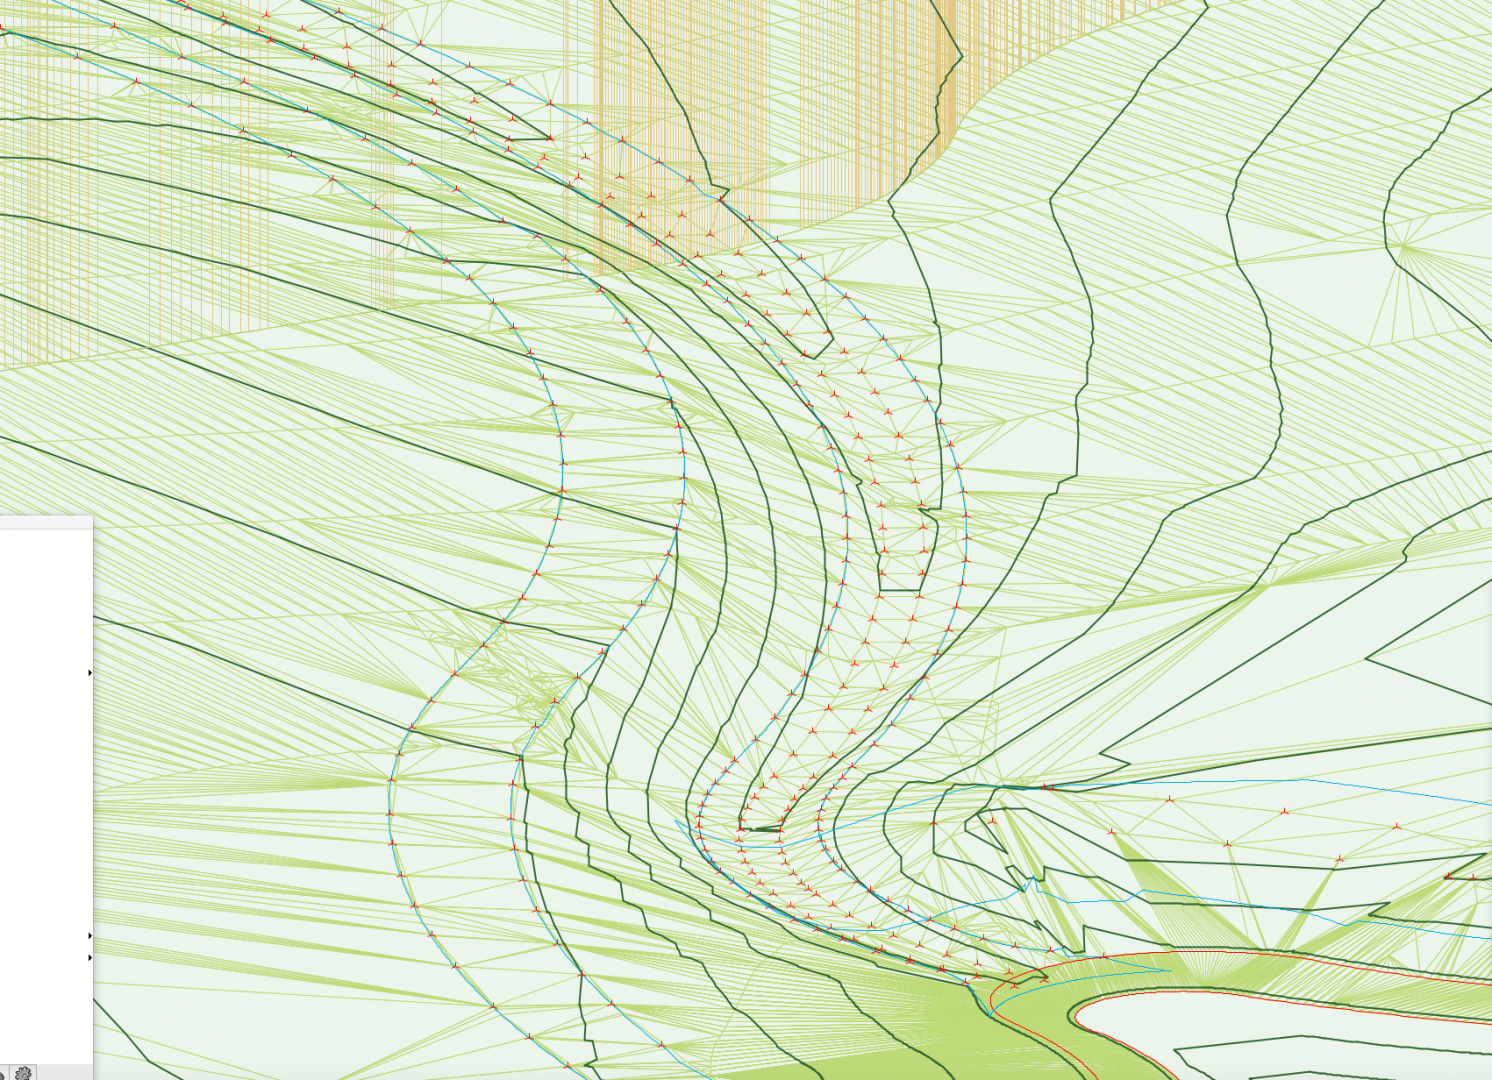
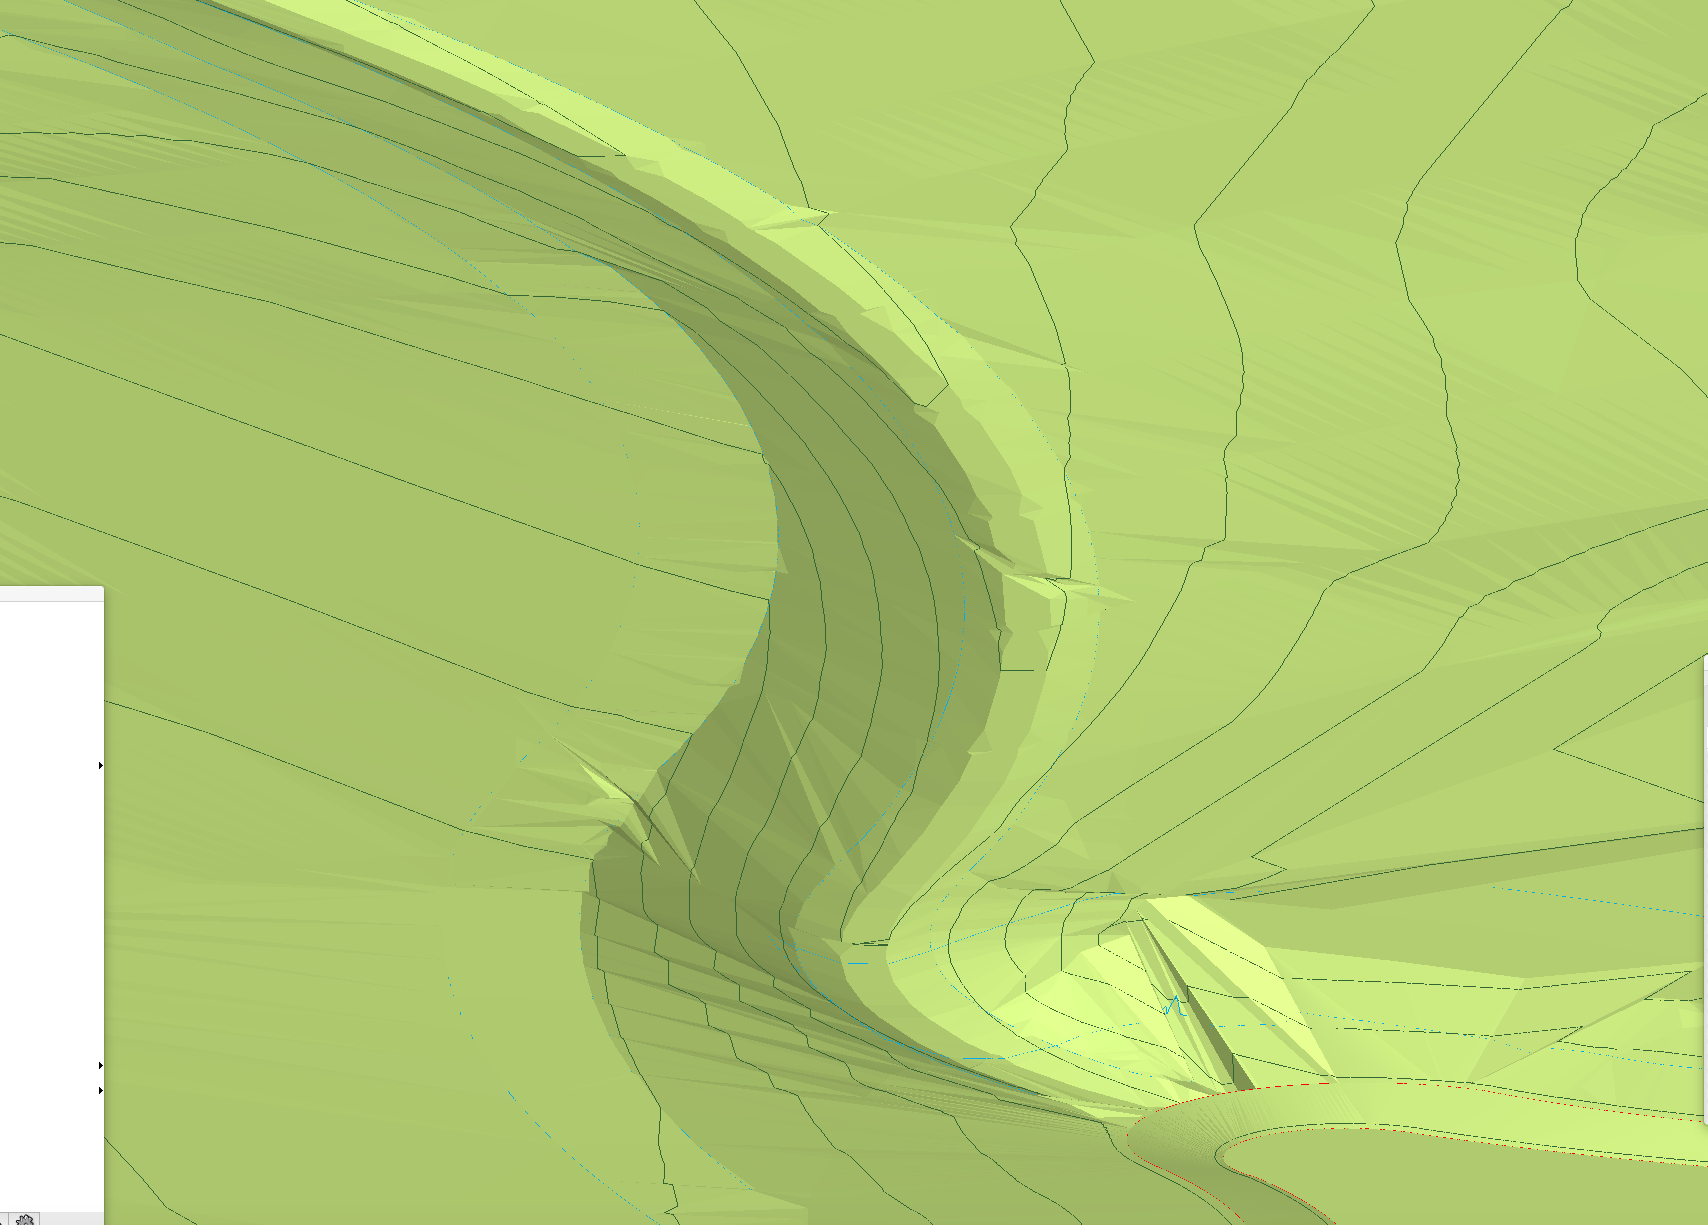
  5. Is there an easy way to smooth my site model without losing too much accuracy? I have little jaggy bits showing in my OpenGL render everywhere between my stake points, as per images! Affecting some contours too.
  6. I have a series of stake points generated from existing levels to create an existing site model. I have now calculated the proposed levels, and generated another series of stake points, which I thought I could apply to existing to generate my proposed model. However, when I apply these new stake points as modifiers, they tie to the existing site model points and become 'spikes' in the existing model, rather than tying to each other. What am I missing with this? Can I set the proposed model data to ignore existing? Do I need to create a separate model for proposed? I want to be able to do cut and fill calculations, which is why I want to modify the existing site, but I don't know how to stop my modify points tying to existing data rather than just the proposed points?
  7. Hi there, I have an existing site model generated from contours and 3d loci. I want to reprofile this site, so the proposed model will tie at the edges to the existing, but have varying different levels throughout. I thought I could do this quite easily by adding a series of stake objects with proposed level information across my existing model and apply to proposed only, but all the stake objects tie immediately to the nearest point of the existing model's source data, rather than tying to each other or even grading gently into the existing? So now I have lots of spikes across my proposed model instead of a smoothed re-profiled site?! Is there an easy solution to this / am I missing something?
  8. With the stake tool I have set the mode to "set elev to site model data". When I drag around the text changes to reflect the height of the site model, which is great. This information is then shown on our plans. Unfortunately for some reason the mode changes by itself to "include as site model data", now when these stakes are moved, they don't show the accurate height anymore. Is this working as designed or a bug?
×
×
  • Create New...