Search the Community
Showing results for tags 'datavisualization'.
-
I have a tile on a viewport. Within the tile there are 2 classes P1-A and P1-B and the whole tile is in P1 Class. Everything is fine within the viewport except when I change change the colours of P1-A, P1-B. P1 is in Blue and P1-B is in violet. I can see the colour's changing everywhere except where we have the tile. Previously this was fine. But today we are facing problems despite not changing anything. Any possible solutions? We have a Base file for drafting and the sheets are generated in a separate VW file exclusively for sheets. I tried using Data visualisation but that isn't applying as well.
-
- tile fill
- datavisualization
-
(and 1 more)
Tagged with:
-
Hi vectorworks community, I have been wondering for quite long time, without finding solution, if there is a direct way to target any texture applied in 3D model with data visualization? We typically work with materials and we have 'starting' selection of generic materials for concept/sketch design stage. These generic materials have only solid color texture (typically light gray and of course real glass texture for glazing) and are just fine for showing black/white result for this stage of project. For example external wall objects throughout whole 3D model have only three different materials: exterior finish, core, interior finish. Same applies to slabs, roof, hardscape.... Then we have materials for objects columns, structural members, railings and also one for furnishing, sanitary, kitchen etc. So at this early stage of project it is sufficiently enough structured and we dont need to be more specific because of black/white/glass result. But as we move forward and design evolves we start to introduce color/material texture and we normally go through whole model and through 'render' tab we override materials texture with real texture on individual object basis (main texture and also parts/subparts). This create first set of color/material selection for building design ...and now back to the question: Do we have direct way to target and control these textures through data visualization without need to introduce record format or have it classed (actually none of these would work without breaking model into individual pieces that can be targeted individually and have specific 'address') or any other middle-part step. So looking for way to directly target applied textures without additional step. These would give us freedom to create color/material texture variations using data visualization. This would be really really amazing and very much welcomed!
-
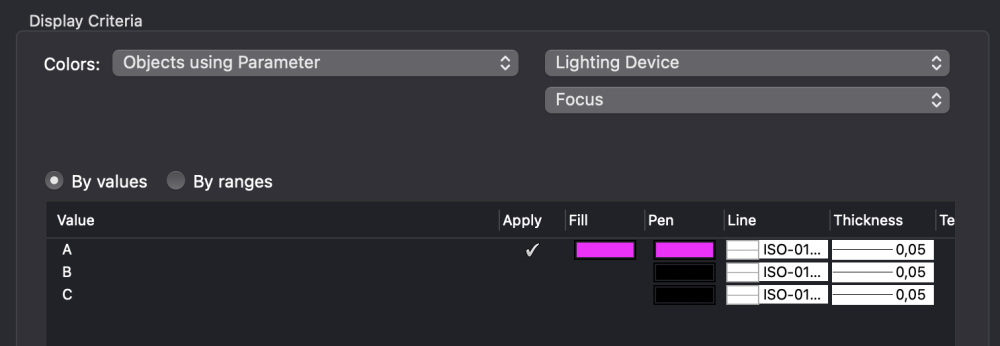
Hi All, I want to get the older crew of the company to step away from their trusted and reliable 3rd party plug-in set and start using spotlight. The main thing I get back as to why they are reluctant to switch is the fact that they can't easily color code Focus Point sets of fixtures. Case: For a TV broadcast there are multiple people around a table that need to be light. In the rig there are numerous amount of conventional fixtures all with their own dedicated purpose. Example: Focus Point A = Presenter = Red Focus Point B = Table Guest = Blue Focus Point C = Guest 1 = Green Focus Point D = Guest 2 = Cyan Focus Point E = Guest 3 = Orange It's easy to color the whole fixture but that also clutters the drawing as the rigs are very crowded most of the time. The 3rd party plug-In only changes the color of the barn-doors or lens-barrel, talking just conventionals. I don't mind editing large amounts of fixtures with a simple piece of geometry inside, assign to a class. But I can't seem to get that working with Data Visualization. There is a way to edit the color via attributes and the spotlight preferences menu, but that is not the way I believe. I've put that option to Modify lighting device color [v] -> Object attributes -> Modify Only Geometry in the Class: "Focus Point Color" I've just took a standard ETC Lustr2 Zoom 25-50 symbol, drawn a poliline over the barrel outline and assigned it to class: "Focus Point Color" I've tried the object criteria in Data Visualisation but no results Display Criteria are set as follows: Please help!
- 4 replies
-
- datavisualization
- focus point
-
(and 3 more)
Tagged with:
-
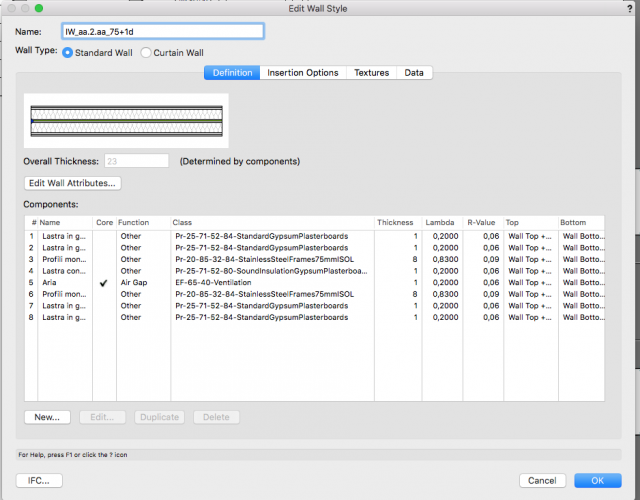
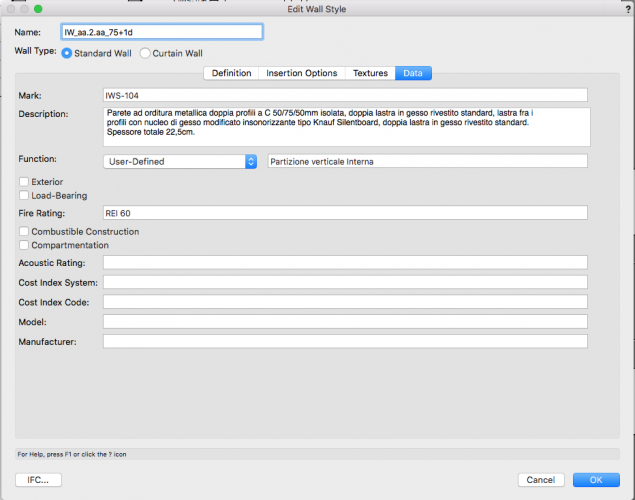
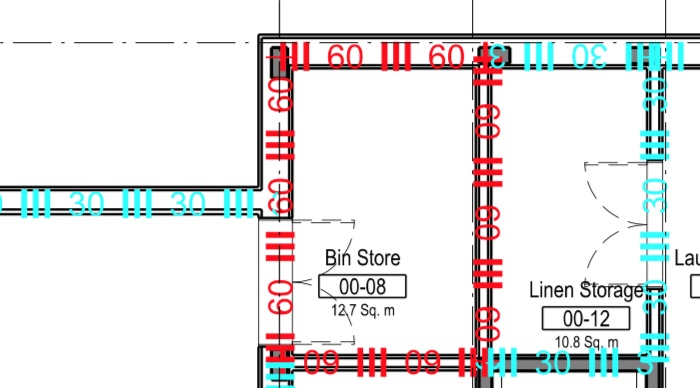
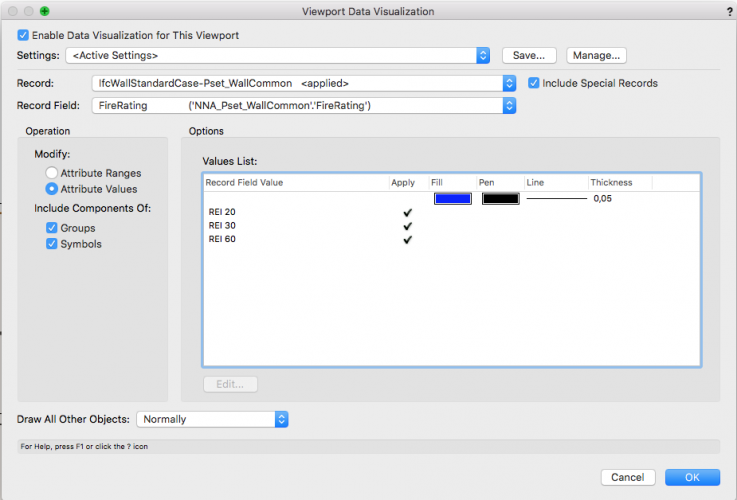
Hi, I have a wall Style made of various components and classes and I assigned it a fire rating value, for example this I would like to be able to highlight every wall's fire rating and obtain something that looks like this I created a custom line style that looks like this. Then I selected the rei properties of the wall styles with data visualization I don't know how to edit attributes to make things show. Editing pen style has no result. I know I could manually draw the lines in viewport annotation but I want it to happen automatically. I also created a custom tile to edit the fill attribute of the wall but the result is not as I expected. Any advice? Thank you in advance Martina
- 1 reply
-
- tile
- fireresistance
-
(and 3 more)
Tagged with:


