


ashot
-
Posts
81 -
Joined
-
Last visited
Content Type
Profiles
Forums
Events
Articles
Marionette
Store
Posts posted by ashot
-
-
Please see attached VW file with interiorcad XS. It has only one cabinet shared by Stephan, please help to make it in Glass instead of Maple inside the framed door. I am trying NC- Transparent or Glass Texture/Material for Door, nothing changes.
-
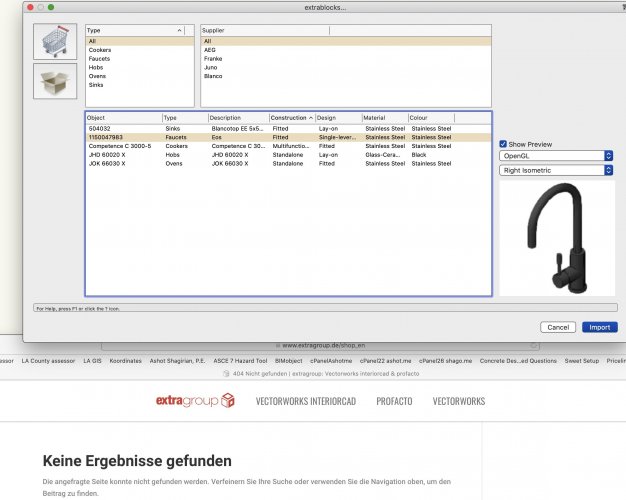
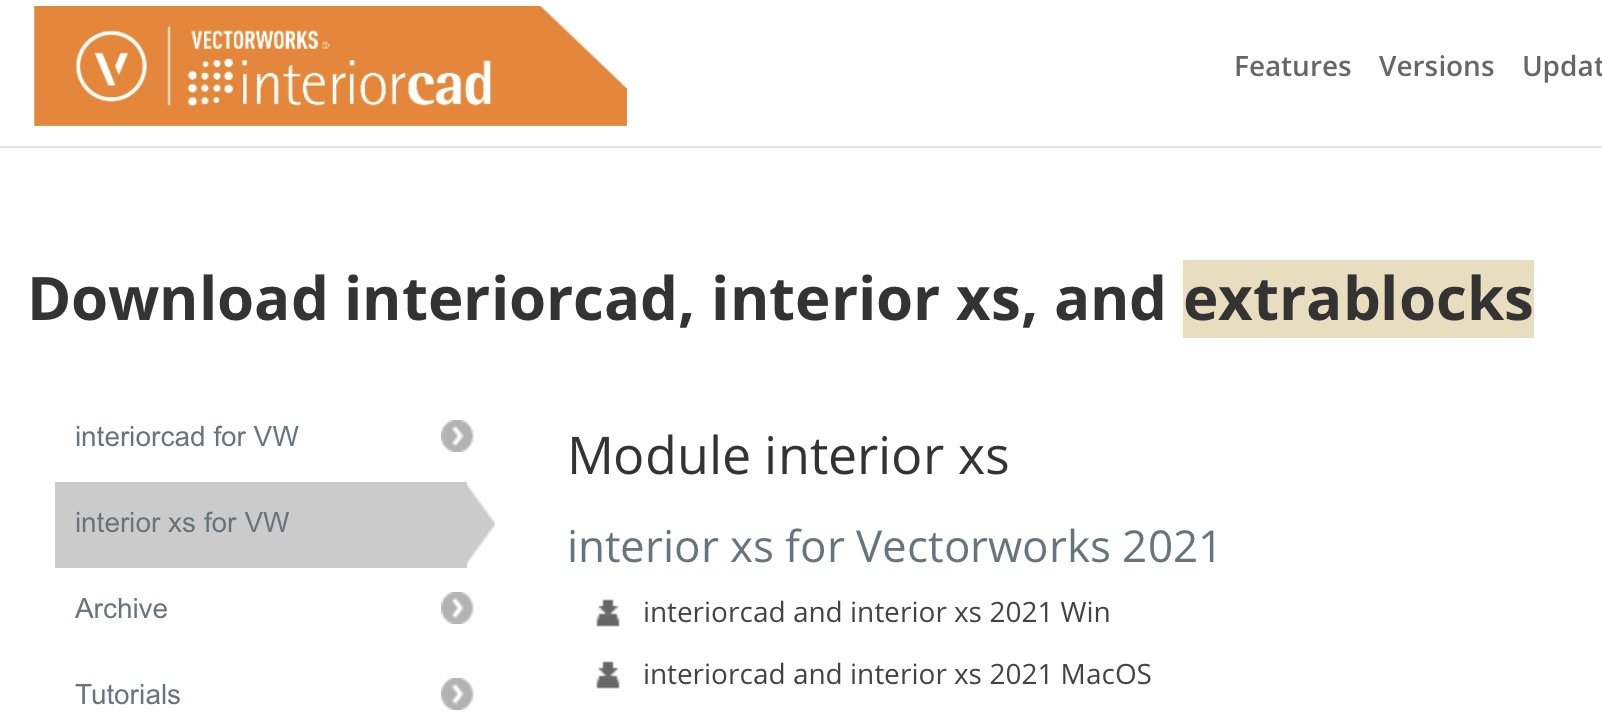
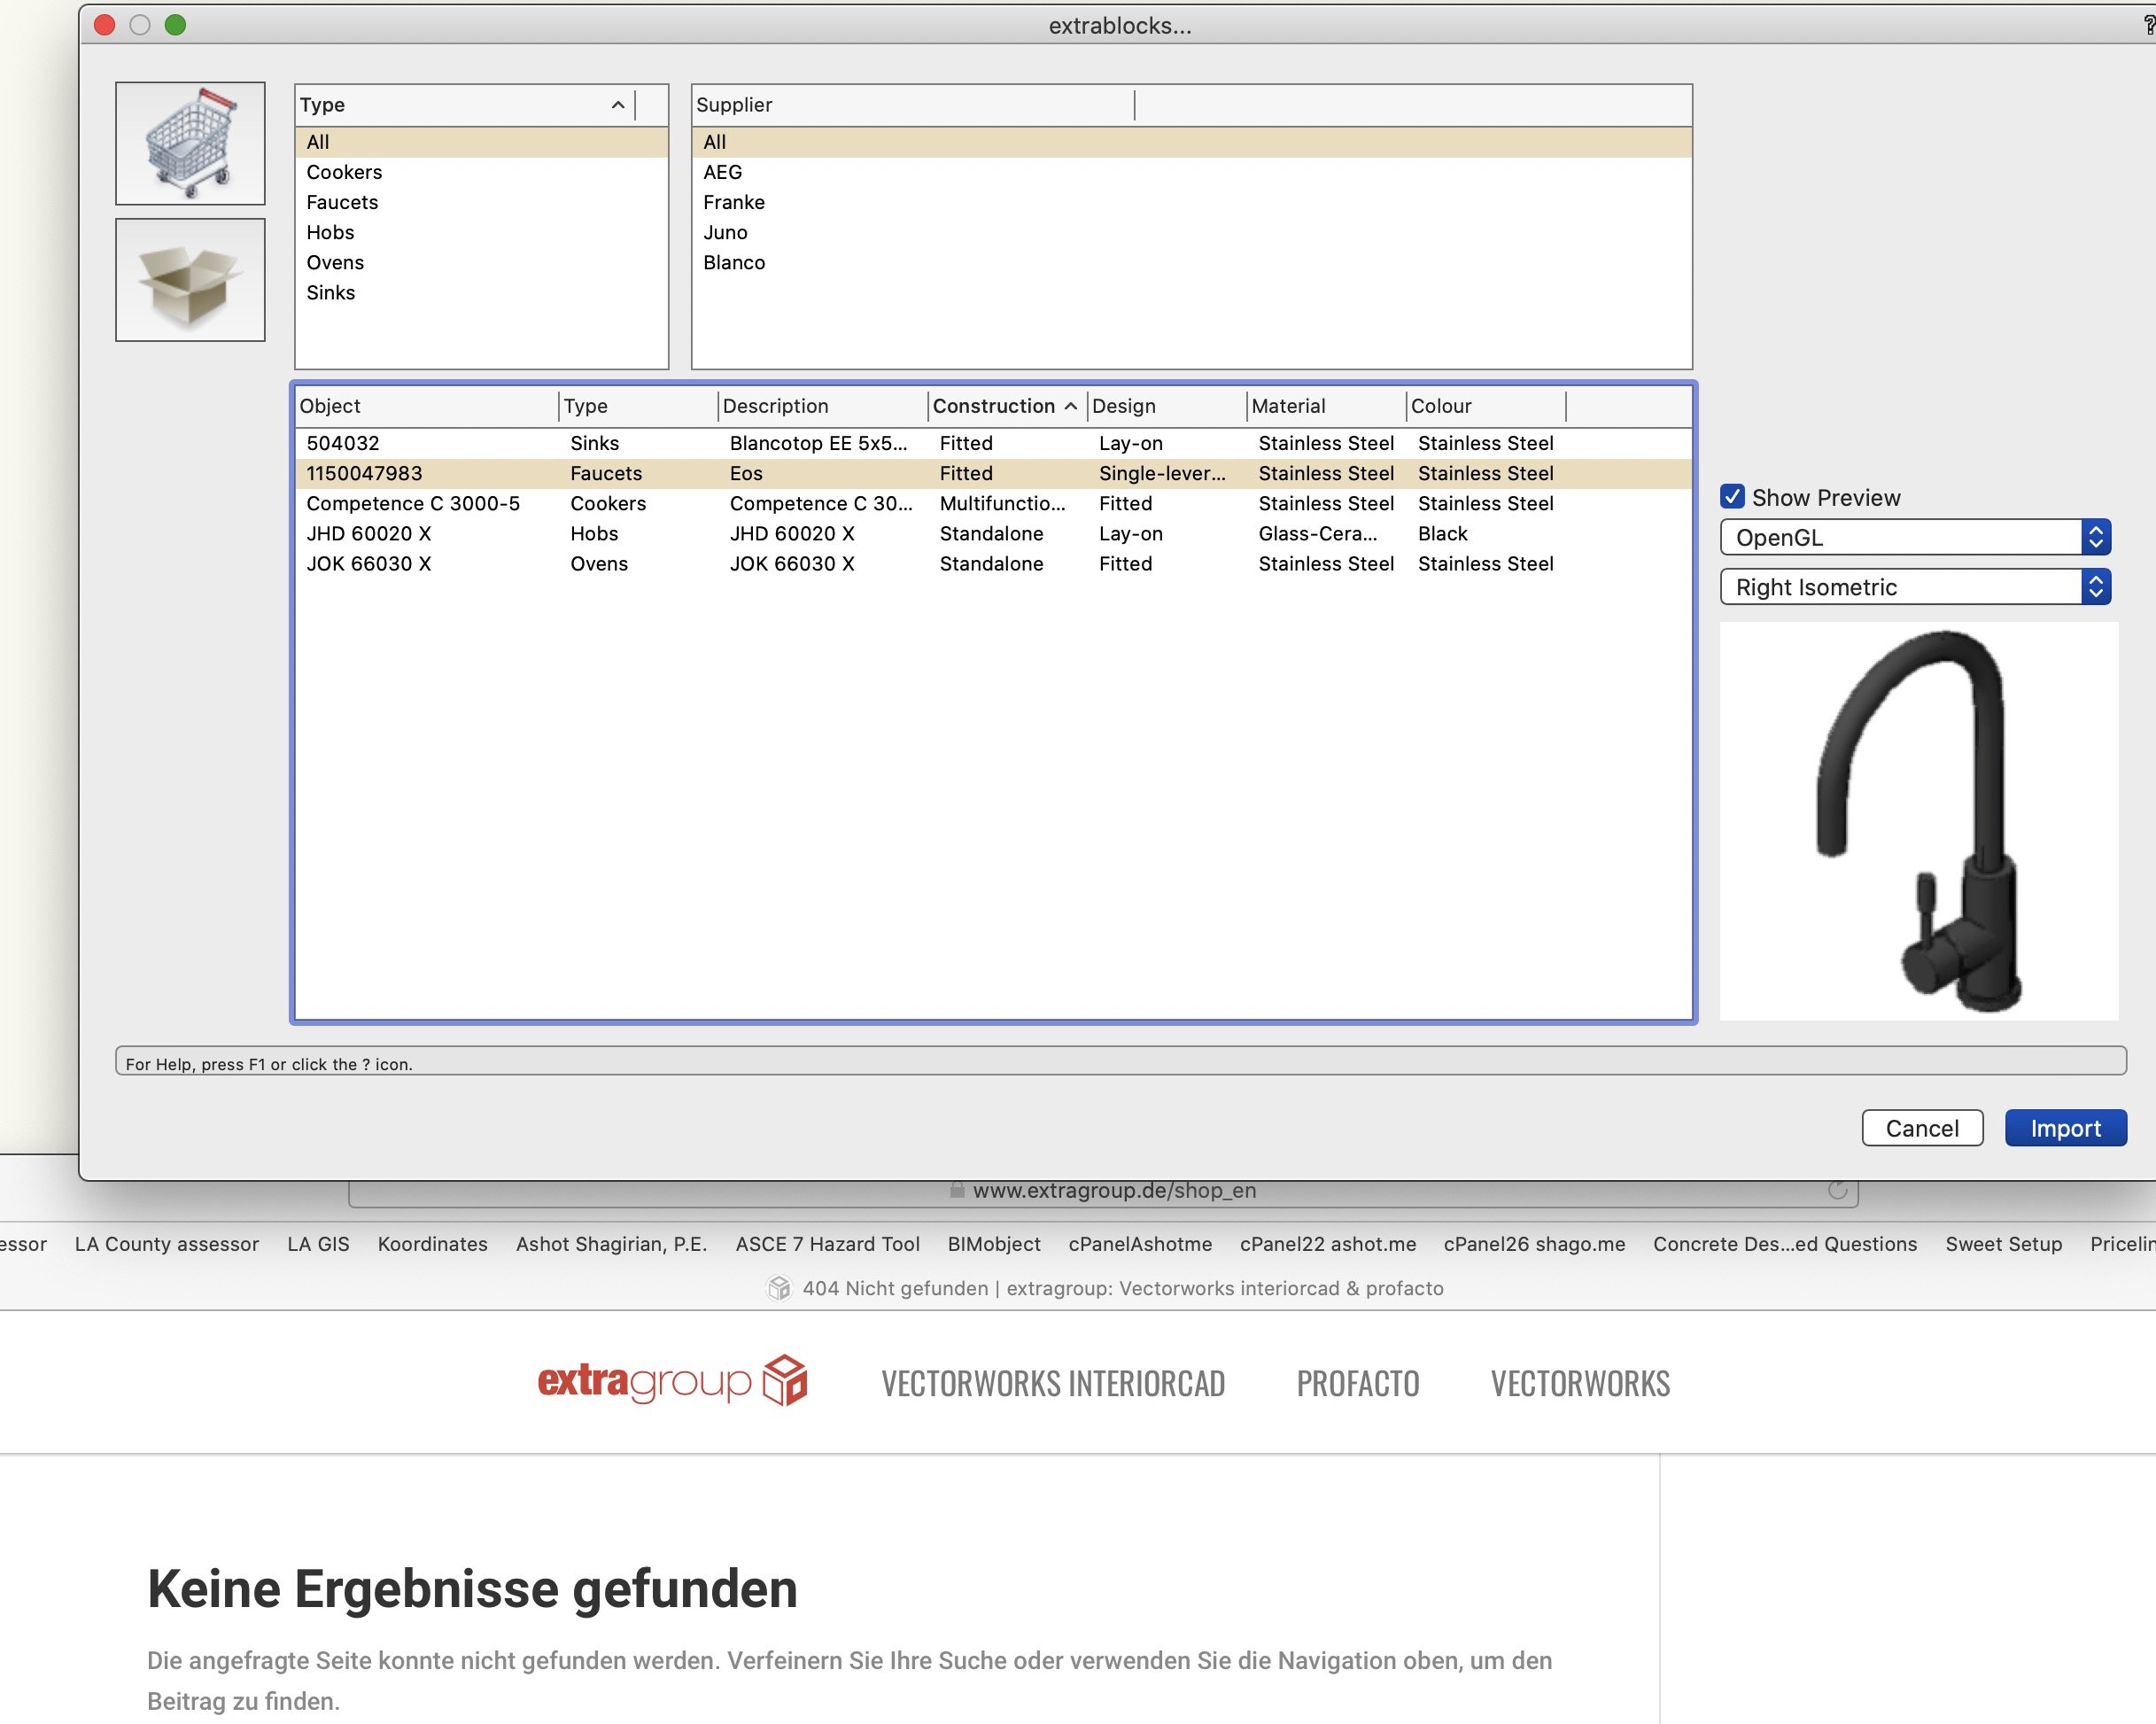
Can Stephan explain why Extrablocks have five symbols but at the same time offer a shopping cart which is leading to a broken link on their main website?


-
Cab anyone share a file just with one cabinet Door = Glass in wood frame (without muntins)
-
for interiorcad xs user, please explain how to change the material and texture for a cabinet as one unit.
I can't follow Stephan's statement, it is not possible
"Go to interiorcad -> Master Data -> Boards and define your materials there. Likewise for edge banding and coverings/veneers."
Please advice
-
Thank you, Wes.
The quick fix is not what I want.
I really need to know how to revert Georeferencing in all my future documents but
also be sure that all other tools work as before (like North Arrow orientation)
-
See attached two files created in VW Designer 2020 SP3.1
In my document "Problem 1.vwx" - When I try to rotate the North Arrow in a Viewport, it refuses to listen and points back to vertical position (North). Changing angle in OIP flips back to 0.
It works fine on Design Layer and on Sheet Layer. This happens only for Annotation in Viewport on a Sheet Layer.
I suspected that the Georeferencing is a problem. Tried to Reset it, uncheck it - doesn't solve the problem.
I started another a new blank document "No Problem Yet.vwx" - everything works fine. However, as soon as I opened the Document Preferences > Georeferncing > OK is activated,
the problem with North Arrow in a Sheet Layer Viewport starts again.
My real project document can not be recreated from the scratch, it has a month of my work.
Is there a way to reset Georeferencing to get back control of the North Arrow in a Viewport?
-
time frame between 15 to 25. Please anyone can
explain in steps, how it is done.
-
On 12/21/2016 at 7:00 AM, sbarrett said:
Hello All! Here are the rest of the Weather Analysis Tools I have been working on. These have the same caveats as the Wind Rose - all of them access the internet every time the network is run. These are also a lot newer than the Wind Rose, so there may still be some kinks - I would call these beta versions. Please let me know if you have any issues!
WeatherAnalysis-Precipitation-161221.vwx
WeatherAnalysis-Psychrometrics-161221.vwx
Is there any new updated 2019 version for all the above files? I downloaded the 2019 Wind, but can not find the update for the rest. Please advise.
-
VW Designer 2018 SP2
on Mac-mini
Error Loading Vision Plugin Library!
Installed, Uninstalled, Re-Installed the latest update, deleted all preferences
Nothing helps
deleting folder RuntimeCashe and restating - doesn't help either
-
Tools > Smart Cursor Settings > Grid > Show 3D Axis (uncheck)
-
 1
1
-
-
Thank you.
Attached is final look of two tables.
My old table is used for final print. Data follows your method and auto calculated in the first table above, then I manually enter the same data into old table for print.
Last changes were:
1) Formula for Column Category:
=IF((B2=1289), '1', (IF((B2=1240), '2', (IF((B2=1290), '3', (IF((B2=1291), '4', (IF((B2=1237), '5', (IF((B2=257), '6', 'oops')))))))))))
2) Formula for Column Image (without SUM)
=IMAGE
3) Format Column 'Image'
Format Cell - Images - 2D Attributes - Fixed Points
So far, I've learned that Site Model SnapShot can be UnGrouped. The Contour lines are separated. The total quantity of Polygons for Slopes in Triangulated Model was over 17,000. Every refresh of Worksheet took several minutes. So I decided to combine all polygons with the same color into one with Modify / "Add Surface" and then pay attention to total area, and if group is objects, not polygons, then carefully did conversion of few polylines into polygons. Final total polygons quantity became = 175, now much better and manageable.
I hope this will help other people.
Thanks to all forum users and special people like Pat Stanford.
-
Thank you Patrick:
Very nice work, I really appreciate your help. Many many thanks, I owe you big time.
Please see attached, I wonder if there is a way to sort data in table, play with order of colors to match original table.
Maybe I can pull data from new table and show them in old table. Any other idea for criteria.
Is there a way to format "cell Pattern color" by assigning "FB index code"?
-
I can't find a solution for this simple problem.
I use a Slope Analysis from a Site Model with 5 groups of different slopes each colored in different color. Having 5 colored slopes and not being able to tell the square footage areas for each group is quite disappointing. The workaround is to trace over in VW or use other program.
First method means that I use either 3D model top view or create a Snapshot and then in VW I trace over each colored zone. Very time-consuming task.
Second method means I need to use Photoshop or "Image J" programs with Threshold Color function to measure each layer area. But it requires applying a Scale 1 pixel = to whatever is scale in foot. The result is inaccurate.
So my question is:
Is there any direct way to retrieve data from Site Model Colored Slopes into a Worksheet?
Please help.
see attached example, a) site model with colored slopes, b) separate traced over in VW to calculate area and c) same layer in Photoshop to measure area
-
Crash after Crash after Crash - for the Latest Designer VW2016 on Mac latest OS 10.11.1
16GB RAM.
Examples are plenty: simple crash on one blank document with one letter while trying to Export to DWG.
Other times get some message such as "Operation aborted due to lack of memory".
-
Hi Tim,
could you please check the link for download, something is missing
in the text.
I tried full name like
http://download2.nemetschek.net.s3.amazon.Tamsin-Slatter.mov
nut no response from the server.
Tx in advance.
-
"The Grade tool can help to create proposed slopes, swales etc."
Could anyone please give me a step by step overview of how to create new slope and swale using Grade Tool?
e.g. how to make 4 different slopes in N-S-W-E directions on a given site model, say I want slopes to be 4:1, 1:1, 1:3 an 1:2
The video on youtube called "Site Modeling and Calculations" shows the slopes
for case with Create pad from Grade Limits.
In my case I need to have an elevated rectangular pad, I do not need an odd shaped pad resulting from the command above.
-
Can someone give me a good example for use of some standard PATTERN fill?
With all hatches, solid, gradient, tile and opaque color fill, I do not see a reason to use some of the fill styles, those 72 standard patterns?
They are known for printing problems. The appearance of the patterns on the screen depends on a layer scale level, therefore they either print at a very poor quality if visible or become like solid color if they are too small on the screen.
To compare final results I need to do some testing for settings in VW + print with Preview.app and also Adobe PDF.
Too much work and no guarantee of results.
Please share your experience.
-
Yes, Patrick, you are right, the foot mark at the end of number is causing a problem. With Delete() procedure I cured the problem.
-
Please help,
I have no luck with Str2Num function
What can be wrong in this procedure, while say TextObject=40.25' is a string, I get correct HeightString= 41.25', but for variable locus
I get zlocus=0 no matter what is HeightString.
VAR
HeightString:STRING;
xlocus,ylocus,zlocus,xtext,ytext:REAL;
TextObject:HANDLE;
HeightString:=GetText(TextObject);
zlocus:=Str2Num(HeightString);
Message('Locus 3D z= HeightString ', HeightString, 'zlocus= ', zlocus);Wait(4);
-
I have a question for best way to INSERT a) custom Logo and/or b) Professional Stamp into TitleBlock. The same TitleBlock is on my 14 Layer Sheets, all in the same document.
One way is to insert as Bitmap Image, another way is to insert as a Group, third way is to insert as 2D Symbol.
Question1) I wonder if inserting as 2D Symbol will make a total file size smaller.
Question 2) TitleBlock itself is a 2D Symbol, so inserting other images as 2D Symbols make it as a "Nested Symbol". As a result I can't use "Custom Selection" or Custom Modification". While I have nothing else drawn on a page except the TitleBlock, the Search for Symbols do not recognize any of my Logo or Stamp 2D-Symbol at all.
Question 3) If I use Bitmap instead of 2D symbols, when VW file is exported to DWG, all Logo and Stamp files are exported one by one, making total 28 bitmap png's (for 14 sheets with 14 TitleBlocks with one Logo and one Stamp) - just a waste of space.
Any recommendations or ideas for the best solution of inserting Images into TitleBlocks?
The goal is A) to minimize the file size, B) to be able to Custom Select nested images.
-
Here some Doors/Windows schedules with first column numbering.
See attached VW file
-
I used workaround similar to yours.
In attached file you can see that in Title Block Record called
'MyCustBlkRecord 36x24'
I am using special field
'S_Sheet No _ of'
to catch the sheet number.
(Go to Design Layer "Miscel" to see the main spreadsheet output. Open worksheet "SHEET INDEX", and make Database Headers shown)
My "Sheet Index" worksheet is a good place to change any field info, since it works like a two-way table. Need to apply "update" for all title blocks and spreadsheets to refresh and bring them to the new state.
I think this same procedure can be done with any symbol if you can create new record field "SerialNumber" for example.
All is good, but not really a full automatic process. I was hoping to find some Script to catch for example "Stack Order" of Sheet Layers. If you think about it, the subrows of database must rely on stack order or creation order of all graphic elements (Sheet Layers, Door/Windows, any Symbol etc). Obviously this static information copied/pulled into the first column of spreadsheet may not be as dynamic as two-way table, but nevertheless it is something I would like to try.
See attached file.
By the way, one spreadsheet in viewport is on sheet layer "AS-GP1" and second spreadsheet, also in viewport is on sheet layer "S-GN1"
-
Can anyone look in .PNG attachment and tell if database subrows numbering can be replicated in the first column of any database.
We use spreadsheets all the time and first column numbering is important for us. However, when spreadsheet includes database subrows, I can't find the solution for making similar numbering.
-
"Yes you can reference other cells and info from other worksheets. Just ref the name of the worksheet where the data is residing."
Can you please tell me how to reference cell from other worksheet.
E.g. (Worksheet 2 cell A1) needs to refer to (Worksheet 1 cell B2)
What is a syntax for cell A1 ?
I tried this, but it doesn't work
='Worksheet 1'.B2

Interiorcad beginner questions
in 3rd Party Services, Products and Events
Posted
I am sorry, Woodychips, but I see your Texture for Door H295_ST22, but it is not a glass, no transparency, I see this: