Search the Community
Showing results for tags 'cut/fill'.
-
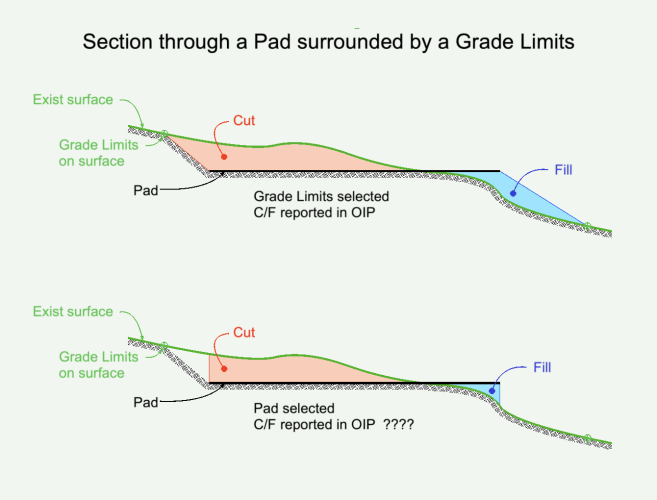
Site model. Single Grade Limits. Single Planar Pad inside the Grade Limits. Elevation of Pad causes both Cut and Fill. Cut/Fill values in OIP are same if Site Model is selected or if Grade Limits is selected. This makes sense. Cut/Fill values if Pad selected are not same as SM or GL values. What volumes are reported if Pad is selected? -B
-

Gradient Cut Fill Site Model Visualization
ericjhberg posted a question in Wishlist - Feature and Content Requests
It would be awesome if you could generate a 2-dimensional visualization of a Site Model's cut/fill, but instead of just static Cut = Red and Fill = Blue...you could assign a gradient for each that could color the site model based on cut severity or fill severity. For example a White to Red gradient for cut that the greater the value of cut, the deeper the shade of red. Additionally a White to Blue for fill that the greater the value of fill, the deeper the shade of blue. This would be an extremely useful way to visualize site models. @Tony Kostreski @Eric Gilbey, PLA @Vlado @bgoff- 4 replies
-
- 4
-

-
- site model
- landmark
-
(and 2 more)
Tagged with:


