


Katarina Ollikainen
-
Posts
317 -
Joined
-
Last visited
Content Type
Profiles
Forums
Events
Articles
Marionette
Store
Posts posted by Katarina Ollikainen
-
-
I've filed a Jira on this so the developers will take a look at what's happening here.
-
 2
2
-
-
Hi, what version are you working in? If you're before 2022, the issue is probably that you have set the Plant tool preferences to a size other than the style setting. The settings here are 'sticky', so if you've used them for one plant, they'll stay on until you manually change them. I suggest to always place all plants with the settings 'use plant style' for all available fields. If you later have to change some instances, you can then do it via the OIP.
-
1
-
-
- Popular Post
- Popular Post
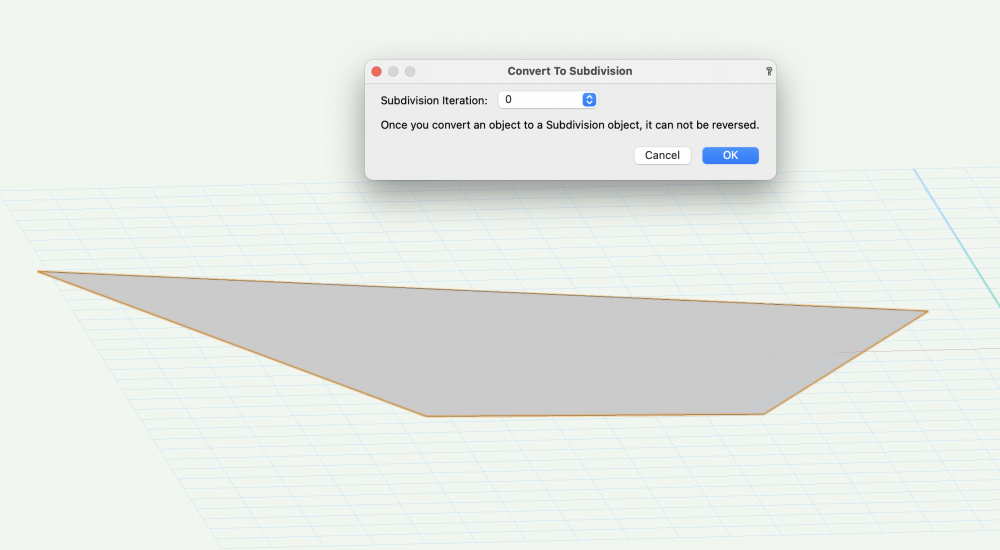
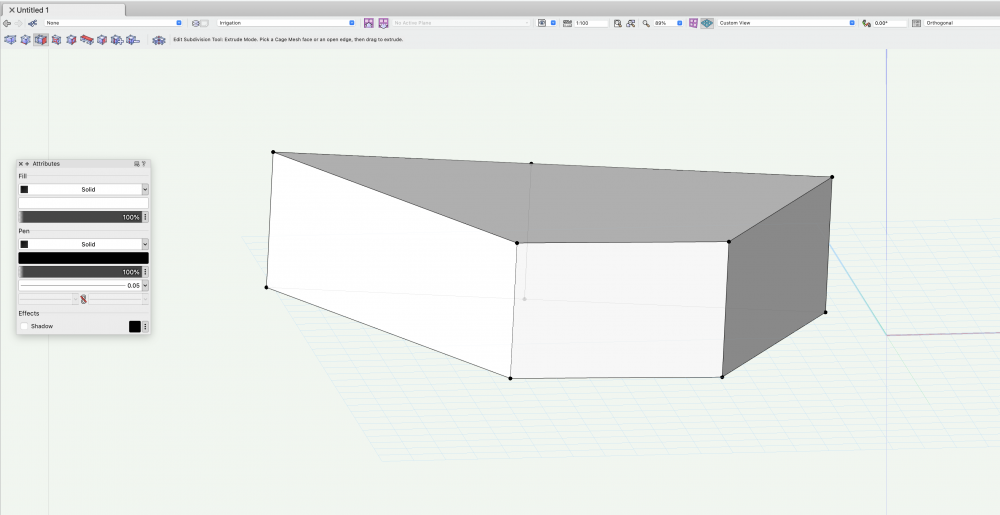
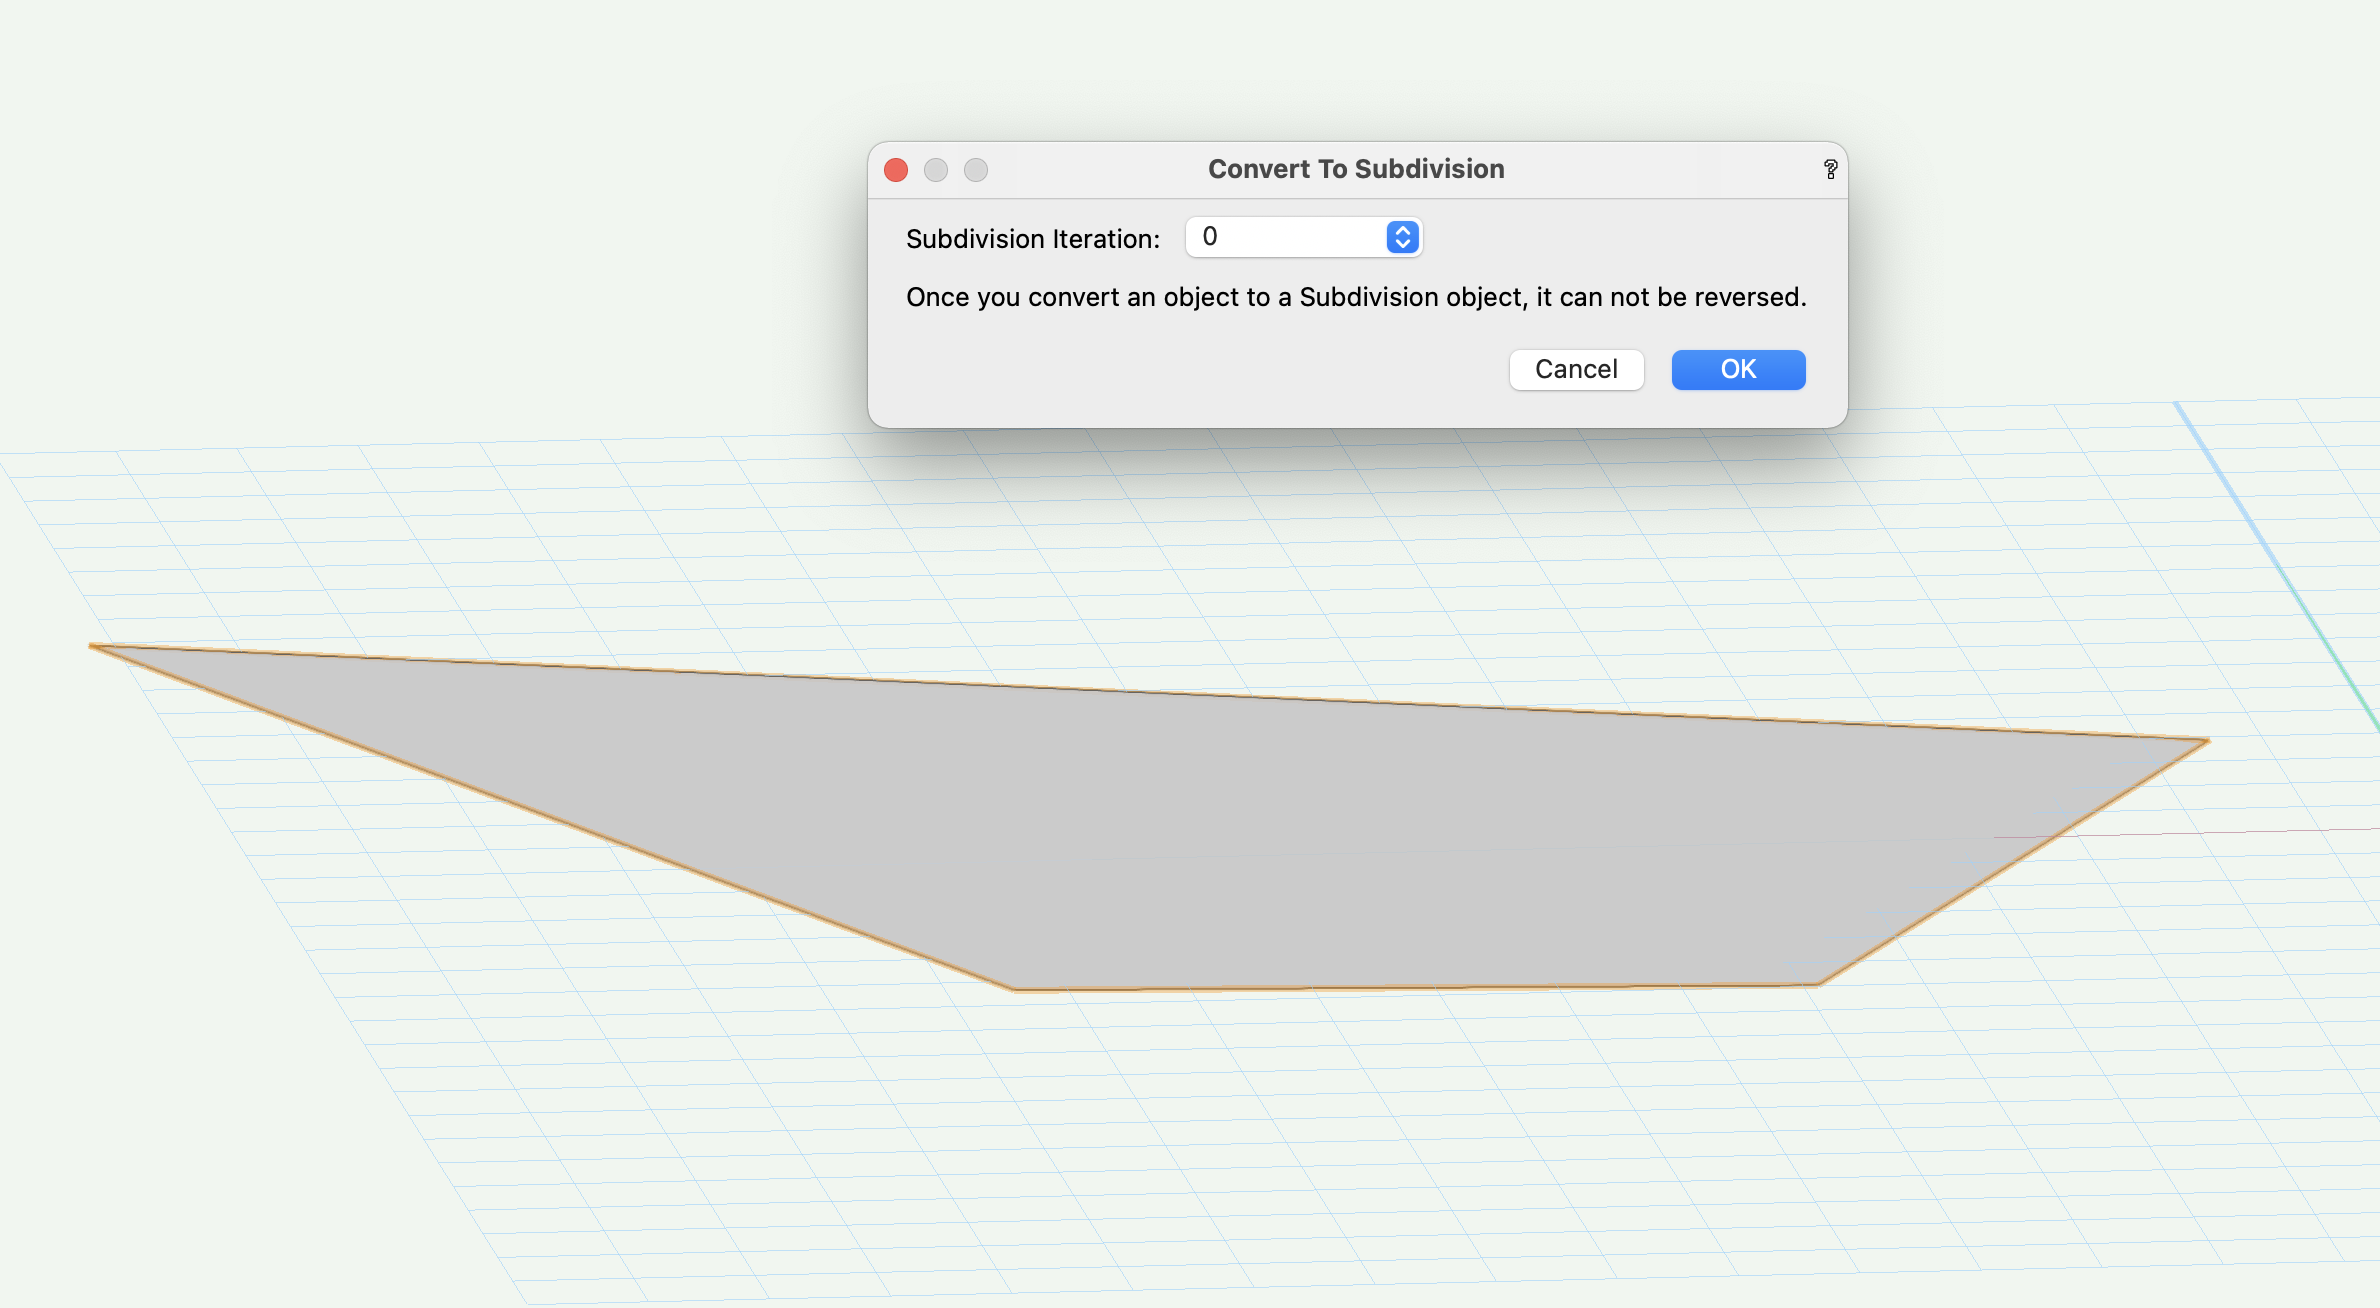
Convert the 3D poly to a subdivision (0 iteration) and then use the 'Edit Subdivision' tool to pull it.
-
6
-
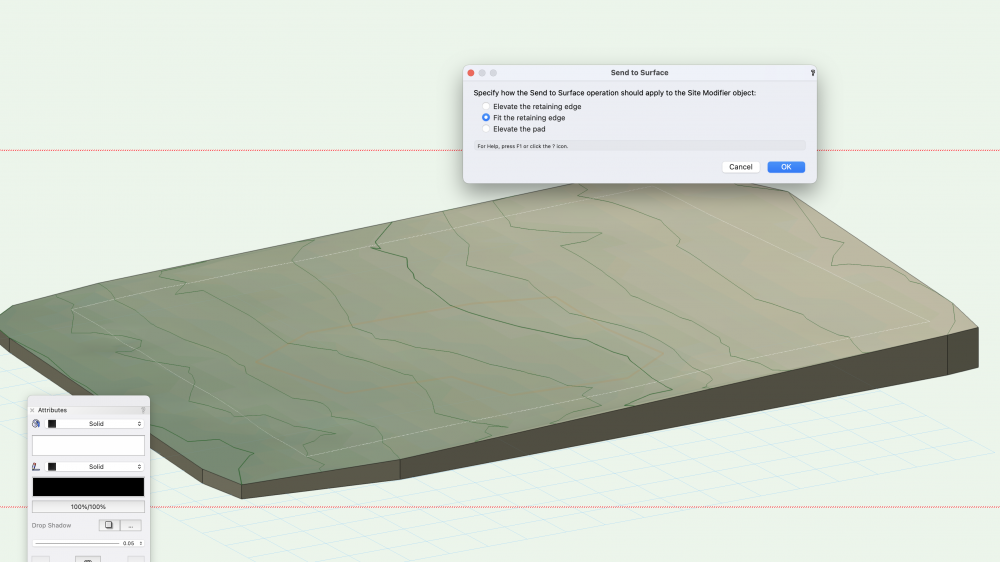
You could use the pad with retaining edge. Set the pad to desired level and then the Landmark > send to surface command, the 'fit the retaining edge' mode. (see screenshot). This will create a nice and even edge at the top, draping the existing site model.

-
1
-
-
Oh, and this works as the bottom edge modifier is inside the top edge - it wouldn't work the other way 🙂
I made a very quick video of how to do it, see below.
And, of course, when you've created it once, save it and use it again and again.
Hör av dig om du har några frågor.
-
3
-
-
Oh, and this works as the bottom edge modifier is inside the top edge - it wouldn't work the other way 🙂
-
1
-
-
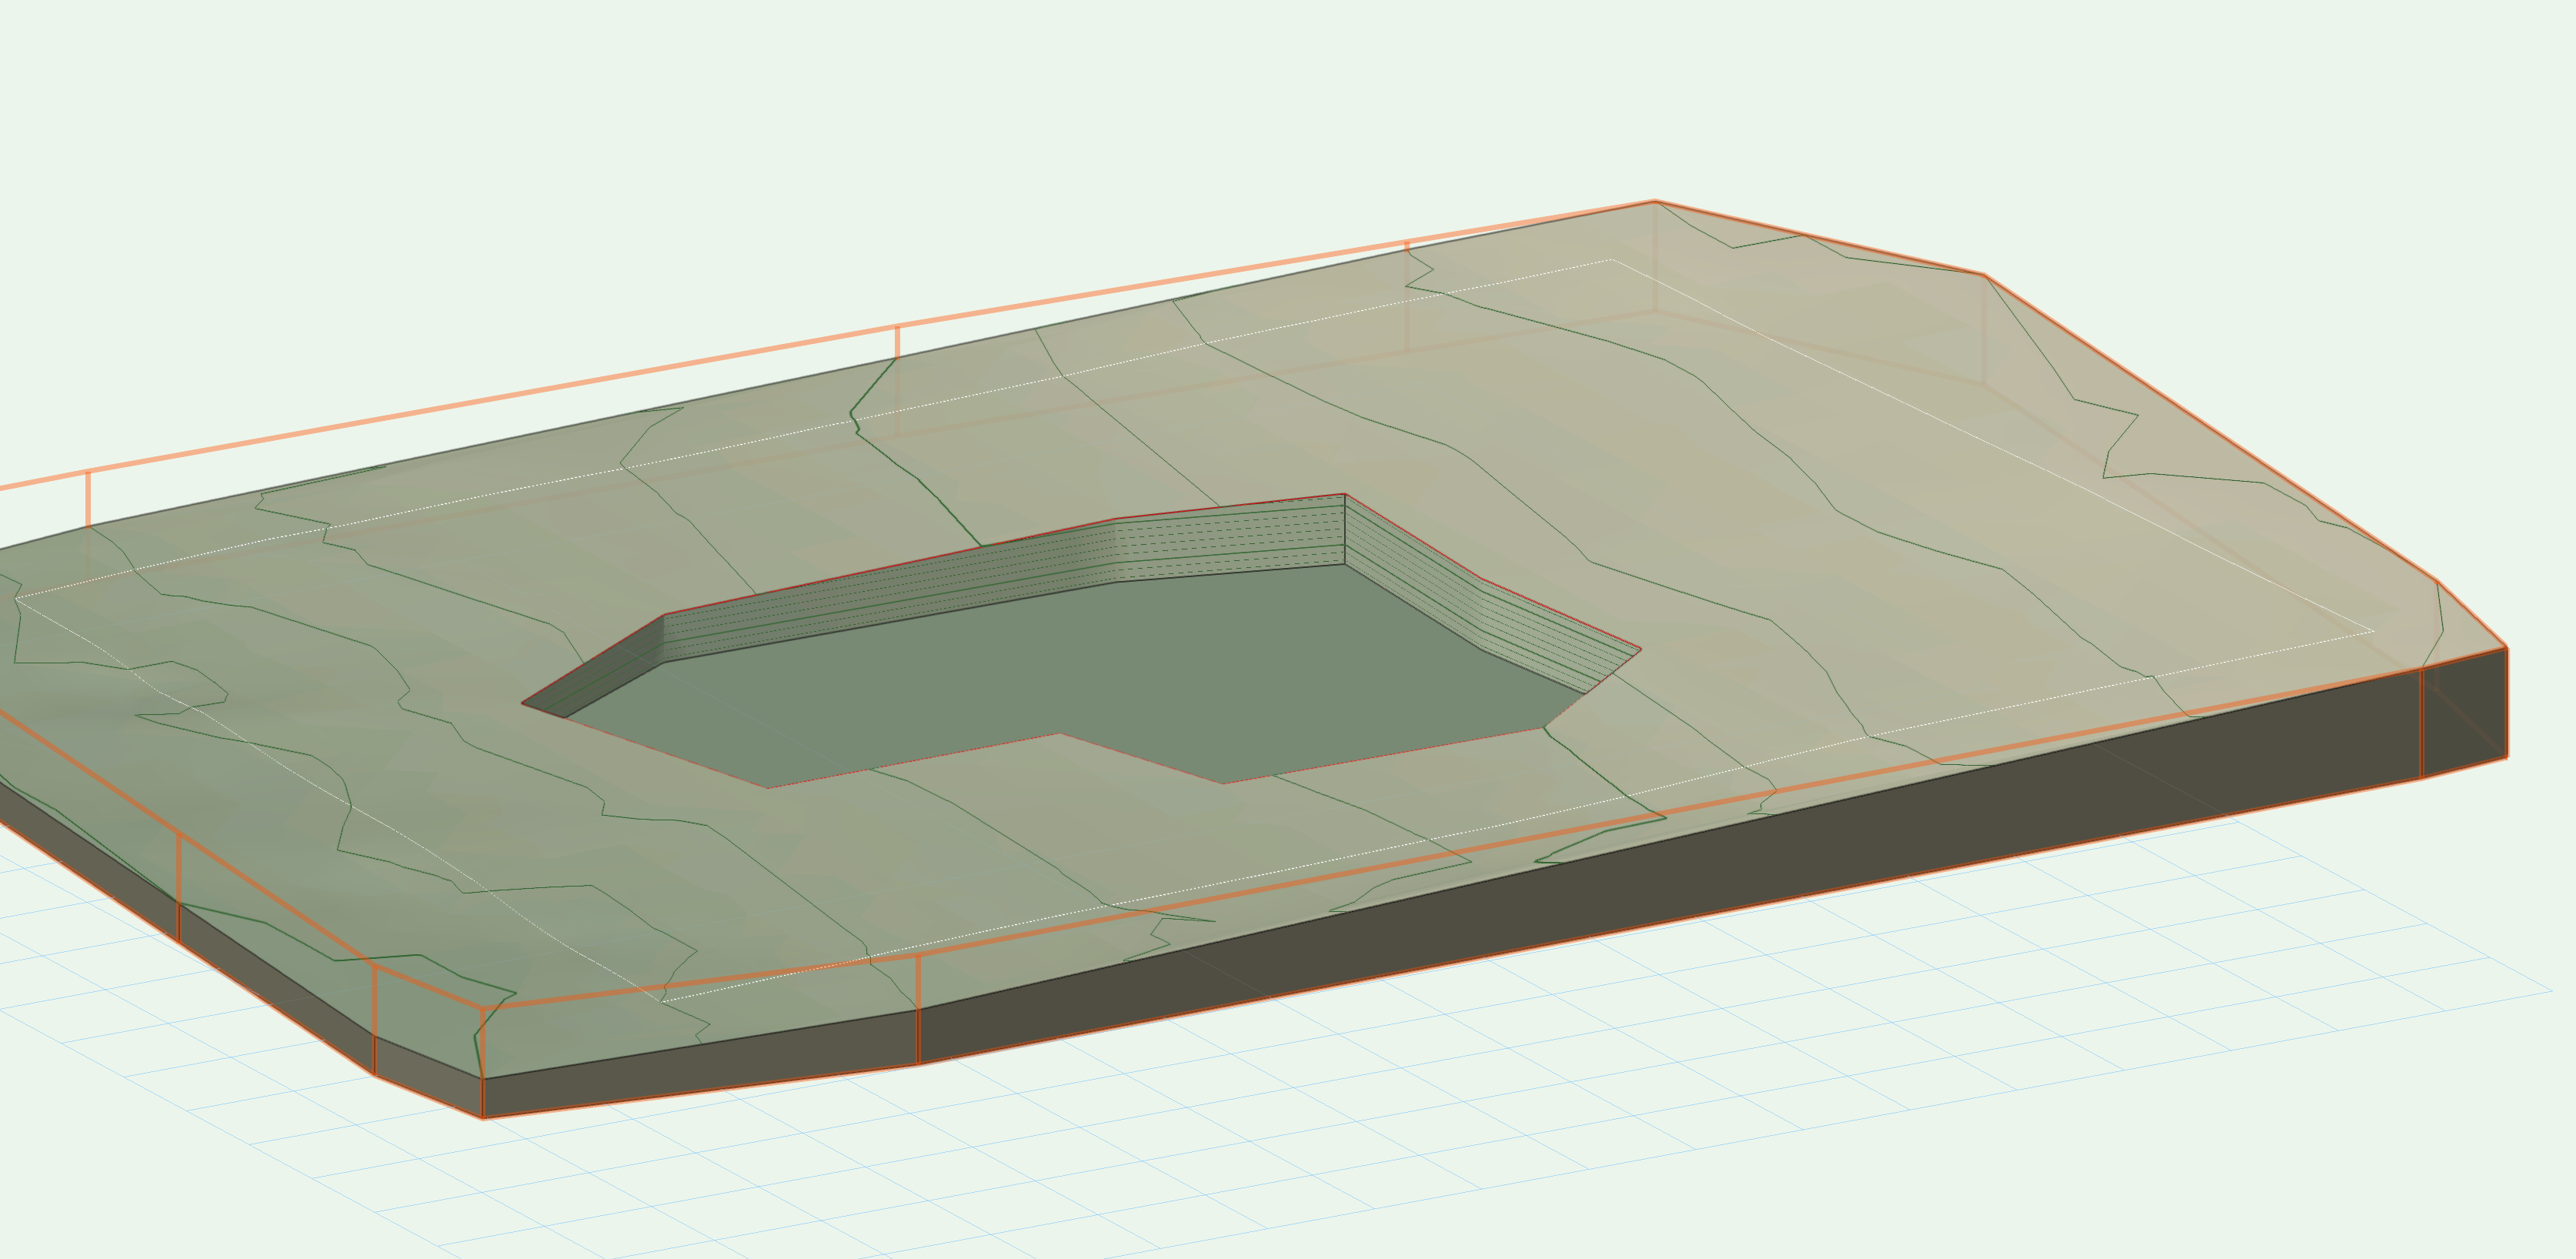
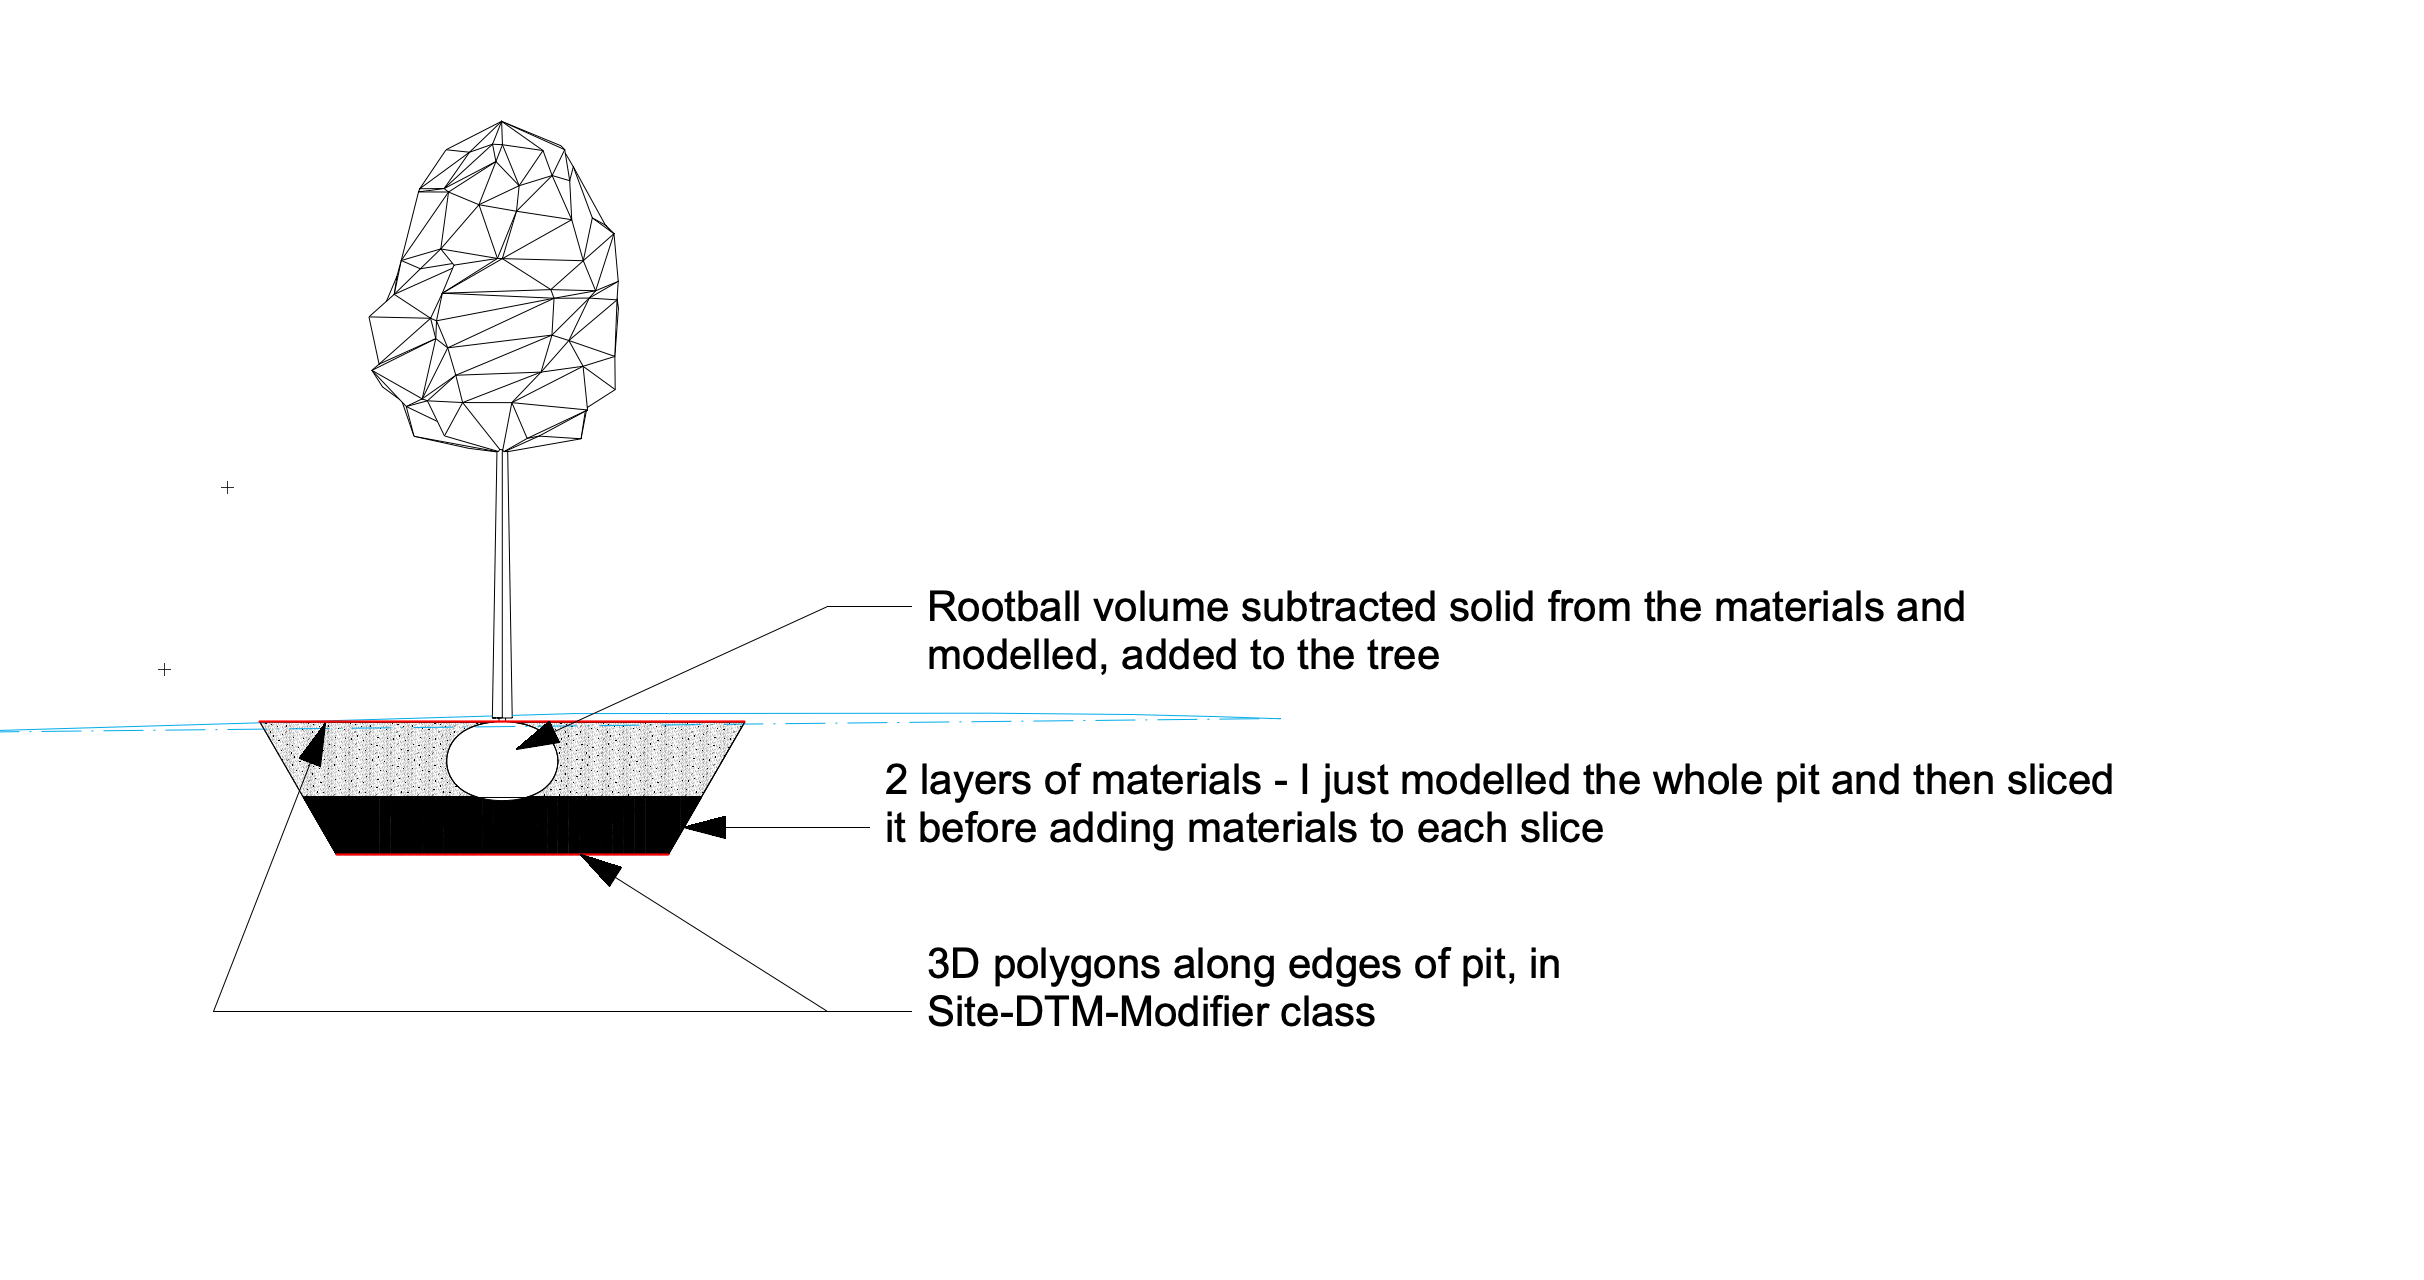
Hej Lisa,
Yes, unfortunately, it's not possible to create non-vertical edges with the landscape area at the moment, but it's definitely on the wish list!
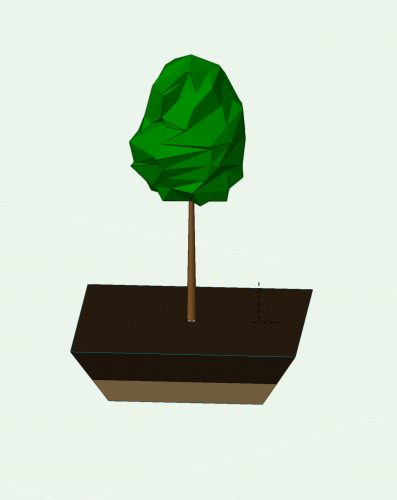
At the moment, I resort to modelling. I've modelled some of the most common tree pits and added materials to these, so I can get a report on quantities.
If you're calculating C&F, you can then also add site modifiers (3D polygons placed in the Site-DTM-Modifier class) to the edges of the pit.
I assume you wouldn't need all the detail in your model, i.e. membranes?
You can also add things like pipes going through and get the correct volume by subtracting the volume from the pit (the same way as the rootball)

-
1
-
-
There is a way to do this but it's a bit involved and everyone opening your file would have to have the same setup, otherwise it won't work (the fields in the plant catalogs and the Plant styles are separate 'entities' so even if you can add anything to the catalog, they'd need a corresponding field in the plant style as well). A better way to do this might be to use one of the existing fields for the specific kind of information that you want to use, even if the 'title' is wrong. (You can change the heading in the worksheet when reporting on the plants or just refer to the field in the data tag, if you're using them). Or, the best would be as Tony suggests, create a record and attach it.
-
3
-
-
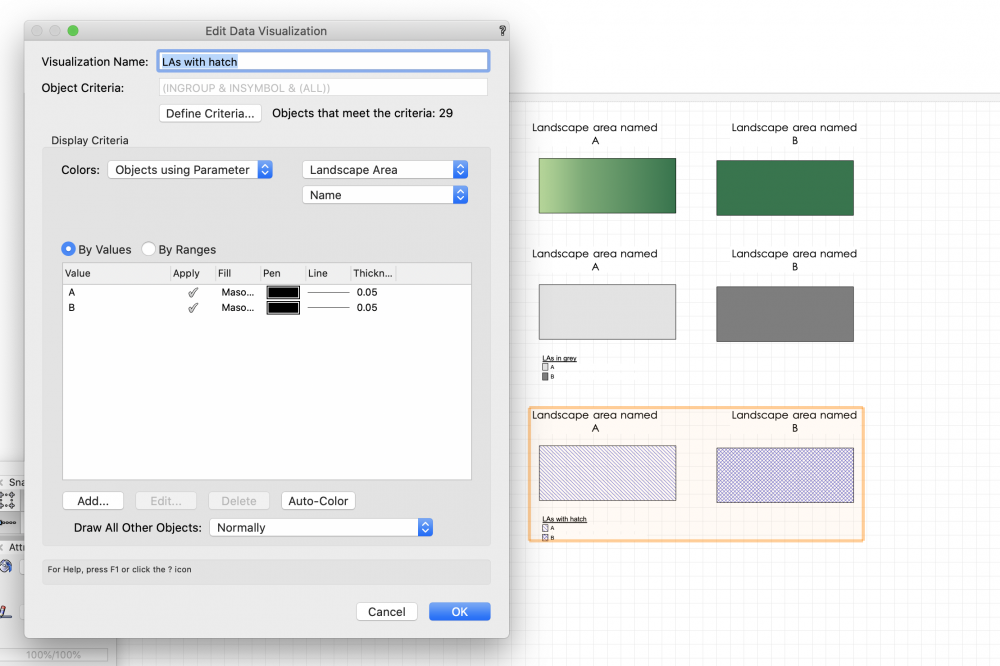
Hi Scott,
I don't know if you're still looking into this one. I would suggest that you're using Data Visualisation instead of viewport override.
Attached is a screenshot of two landscape areas in three different viewports. The first one is without any DV, in the second one I've asked it to look at the individual names in the Landscape areas and coloured them different grey according to this.
In the third one I've done the same thing but asked it to use hatches instead. Of course you can choose anything you want as the parameters, this is just an example.
You have a much bigger scope with Data Visualisation - and from 2020 you can use it in design layers as well, not just viewports (I often use it for planting schemes where I want to see (while I'm working) how much of the planting is deciduous and how much is evergreen).
-
Yes, you can set them up exactly as you want them. They're much more powerful, AND more future-proof as well - if the same tool is used through all the disciplines and for all different geometry, there will be more reason to develop it and fine tune it.
Start by using the data tags that comes with Landmark, and when you know exactly what you want, create your own style.
-
1
-
-
Hi, why don't you use the data tags instead of the built in tags in the plant tool and the landscape area tool? It is much better, you can place the tags in the viewport's annotation and they update if you make changes to the planting plans, just like the built in tags.
You wouldn't have an issue with them showing up in the other viewport either.
-
1
-
-
Hmm, that's strange. Do you have a sample file you can post? I'll have a look
-
Hi, any CAD program has a 'safe-zone' where you can work. If you're too far away from the internal origin (you should always have this visible so you can see where you are. Turn it on by going to Tools>Origin>Locate internal origin), otherwise the rounding of large numbers will play tricks with your geometry and the overall performance.
There are several ways you can achieve this.
If your file is NOT Georeferenced: Ensure all layers and classes are visible and selectable, select all (cmd A) and use the 'fit to objects' command to see everything. Then draw a circle around all the geometry (remember - ALL the geometry has to be included, even that tiny rogue text block fifty miles from the main drawing area). If the circle is more than 5km in radius, move your geometry closer to each other. Important - ensure that the centre of the circle is on a whole number (so the origin will end up on a whole x and y) - otherwise you'll never be able to precicely align your model with somebody else's work if you export it.
Next step is to go to Tools>Origin>Centre drawing on internal origin. This will do what it says on the box - the drawing will be centred on the internal origin. It will not affect your x and y coordinates.
If your file is georeferenced, you have to set up the file correctly with the project origin lining up with the internal origin before you import anything. This is a vital step and should be included in the template setup.
-
4
-
-
Hi Laura,
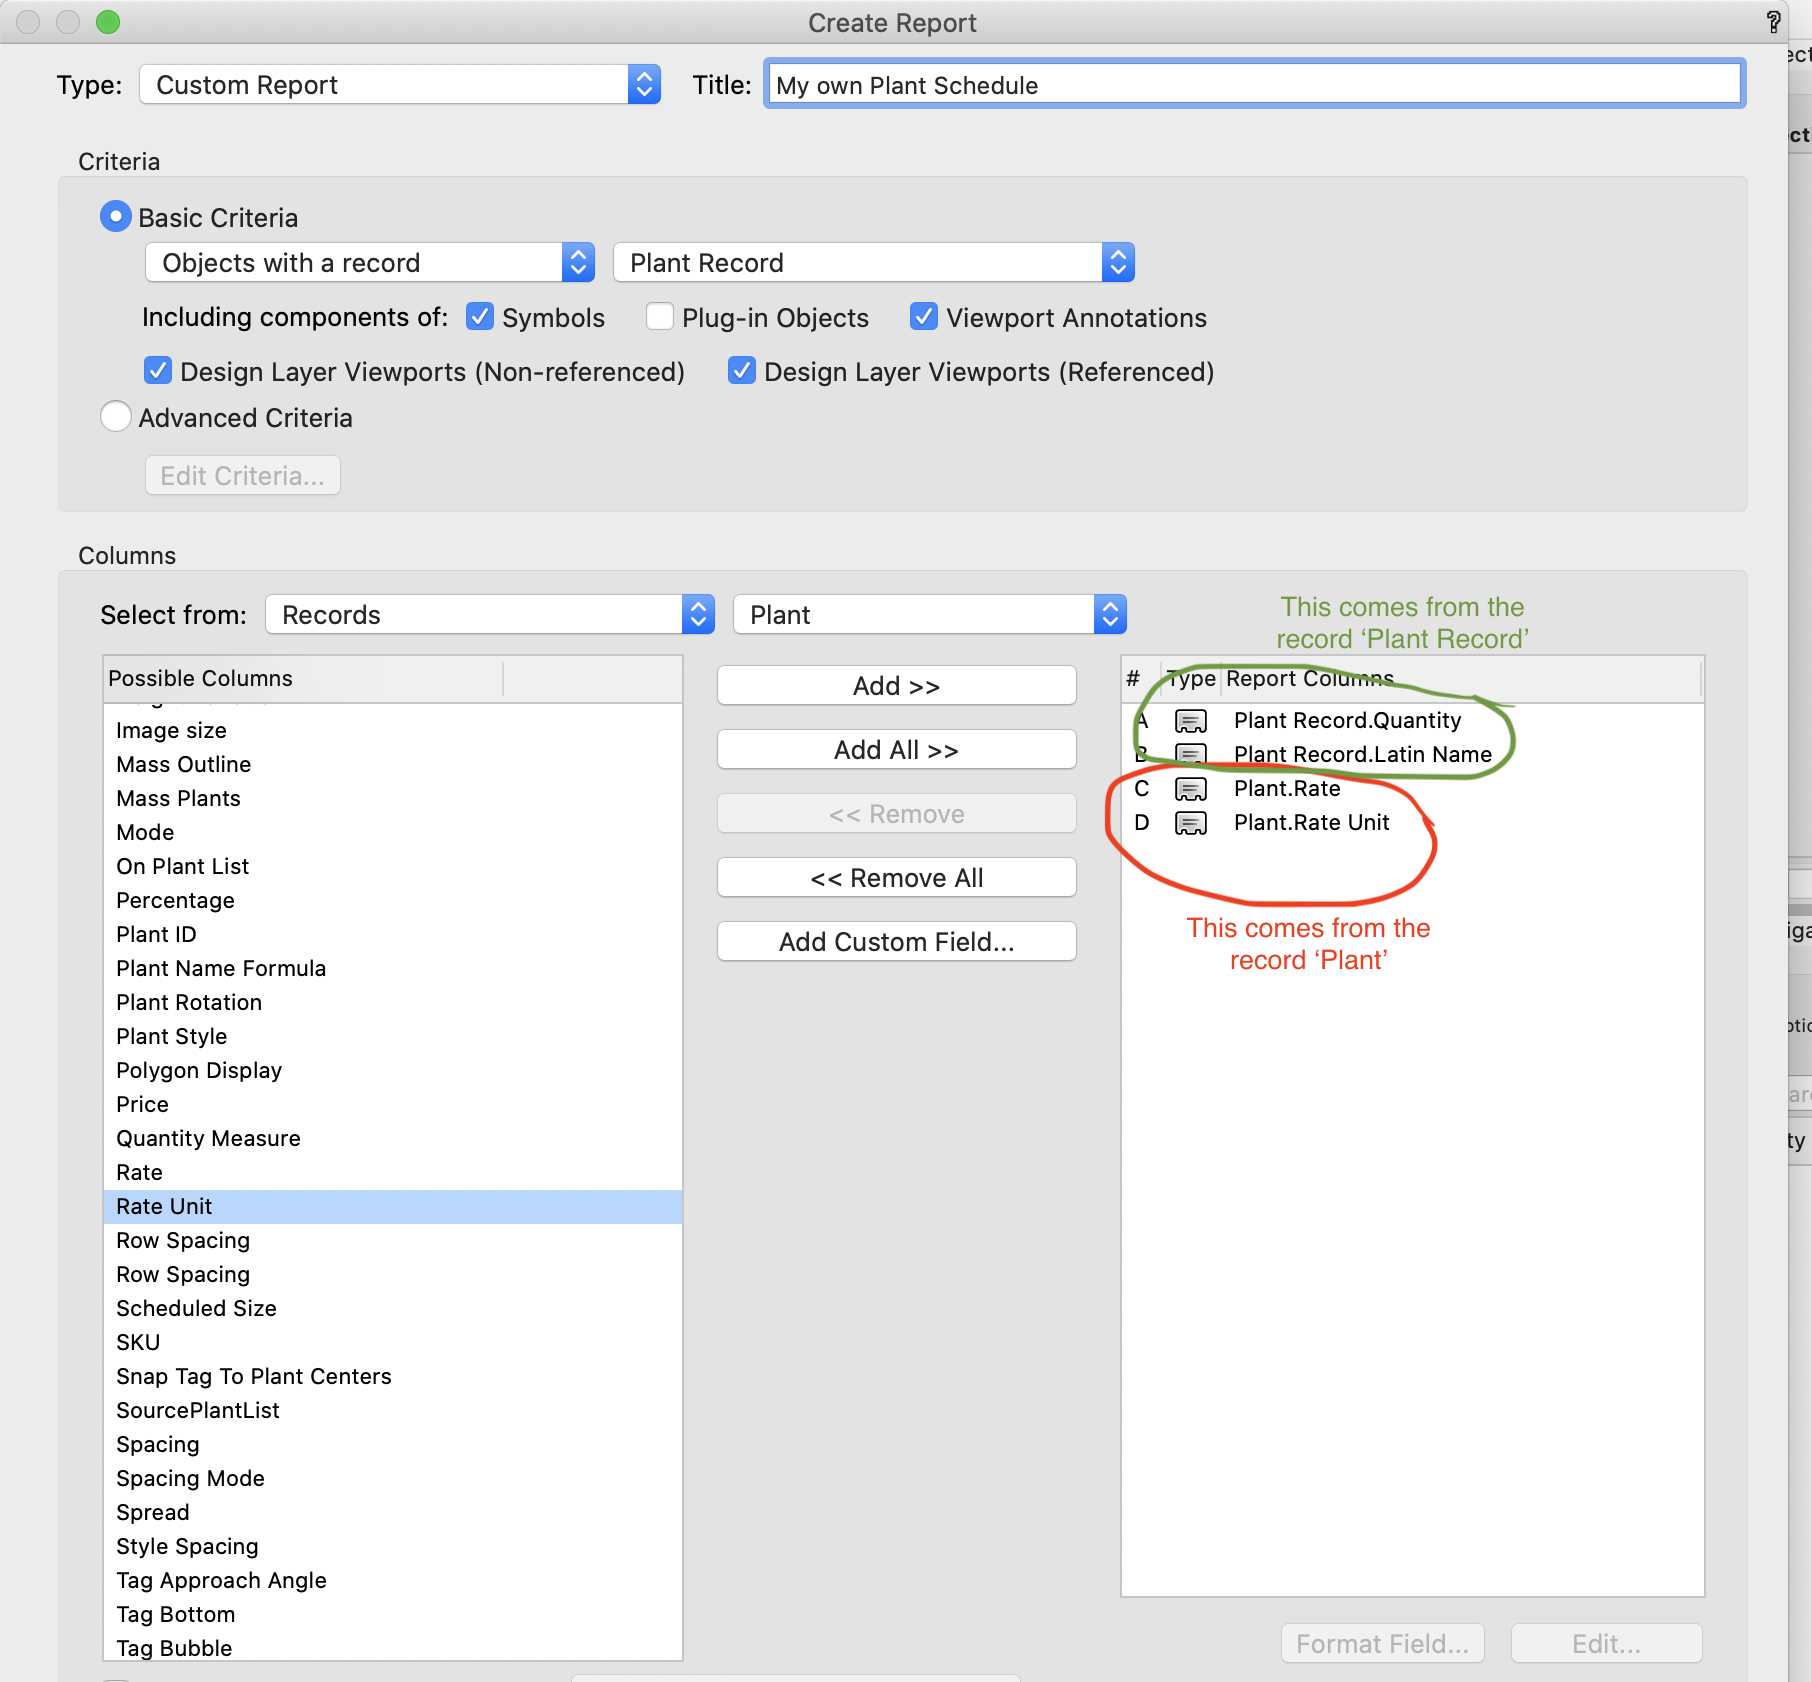
The plant tool is really indispensable if you're creating plant schedules. The question is what you're going to use the schedule for.
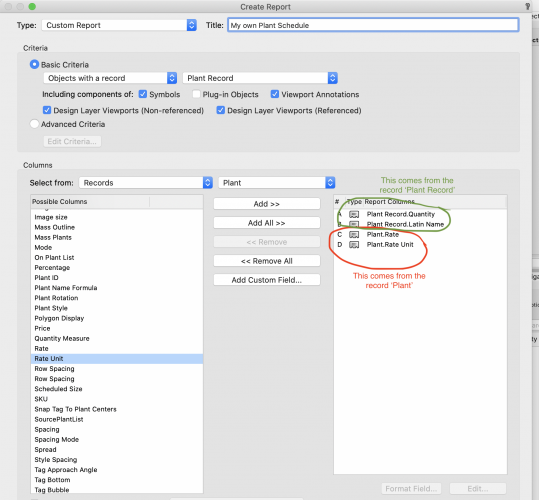
Normally when you create a plant schedule, you want to have the quantity of plants in the design and scheduled sizes (for quotes from the nursery, budget etc).If you want to show the distribution rate you can do the following (see image attached):
There are several different records for plants - In the record 'Plant Record' you'll find the records 'Quantity' and 'Latin name'.
In the record 'Plant' you have the Distribution rate fields for 'Rate' and 'Rate Unit'. This will give you the distribution rates.
Create your own worksheet (Tools > Report > Create Report) with only the fields you'd like to use instead of using the pre-made reports. When you have set up the report as you'd like it, save it in your user library or a workgroup library so you don't have to redo it for every project (or you can include it in your template).
If you're using landscape areas for the planting (as commonly used for commercial projects), you can use the pre-created report called 'Landscape area - mass planting'. This will give you both the quantities and the distribution rates in the landscape area. You can just go in to the worksheet and remove the fields you don't want and then save it as above.
If you find that there are too many fields for data in the Plant Style (under the 'Plant data' tab), then there is the possibility to make a bespoke set of only the information you'd like to have. However, this is a little bit more involved and it also means that you have to be very clear on what to do when you update or move from one computer to another. Everyone working with the Vectorworks file must have the same setup, otherwise it will not work. If this is what you'd like to setup, let me know and I'll send you the information.
-
Hi, as plants are not supposed to grow on hardscape, they don't react on them. The only time I can see it being of use is if you have a gravel garden and you're using the hardscape to create the gravel. But as Jeff referred to, if the hardscape is part of a site model, the plants would automatically look for the site model and adjust to its level, both single plants and landscape areas.
Can you explain in what situation you'd like to have the plants to grow out of the hardscape? Are you using the hardscape to create growing medium volumes?
-
Hi, are you using sheet layers and exporting to PDF before you print or are you printing from design layers?
-
Hi Troy,
The DWG will be in scale, you just need to ask your surveyor if they're using meter or millimetre. (If you don't know, just import it once with meters and measure something known, like a door width. If it's wrong, delete the import and do it again but with millimetres. This is better than scaling the whole drawing). You shouldn't have to do any changes to it - surveys are usually very accurate.
If you've already started working on your masterplan before the survey arrives, I'd recommend to draw out guidelines for door and window centres according to the DWG (Modify > Guides > Make guide) and then transfer (re-draw) your design to the 'surveyed' file - it is really hard to get things exact if you try to scale it.
The other really important thing to remember when importing a DWG is to ensure it 'lands' close to the internal origin. The simplest way to do this (unless you have set project coordinates) is to select the first choice in the import dialogue, 'Center first import, align all subsequent imports'.
-
1
-
-
Have you tried to create geometry for the tree instead/as well as an image prop? This will show up in hidden line and sketch modes. Image props doesn't.

-
Hi Michal,
Hope you're doing alright during these difficult and topsy-turvy times.
Regarding your first post:
You can turn off the existing tree tags by classify the tag in the Existing tree tool preferences and then turn off the class.
To change the units in the data tags from mm to meter - you can do this in the 'Define tag Field' window. When you add a new field to the tag and you've chosen the parameter name; right under that field you have a units dropdown menu as well. Change from Document Units to meter, decide on the Precision, add your preferred suffix and you're good to go.
Hope this helps.
Regarding your second post, can you give me a bit more information on the issue? I don't quite understand how you're tagging the existing trees - normally you'd have one tag for each of the trees as they all have unique ID numbers. Or are you referring to normal plants styles?
-
1
-
-
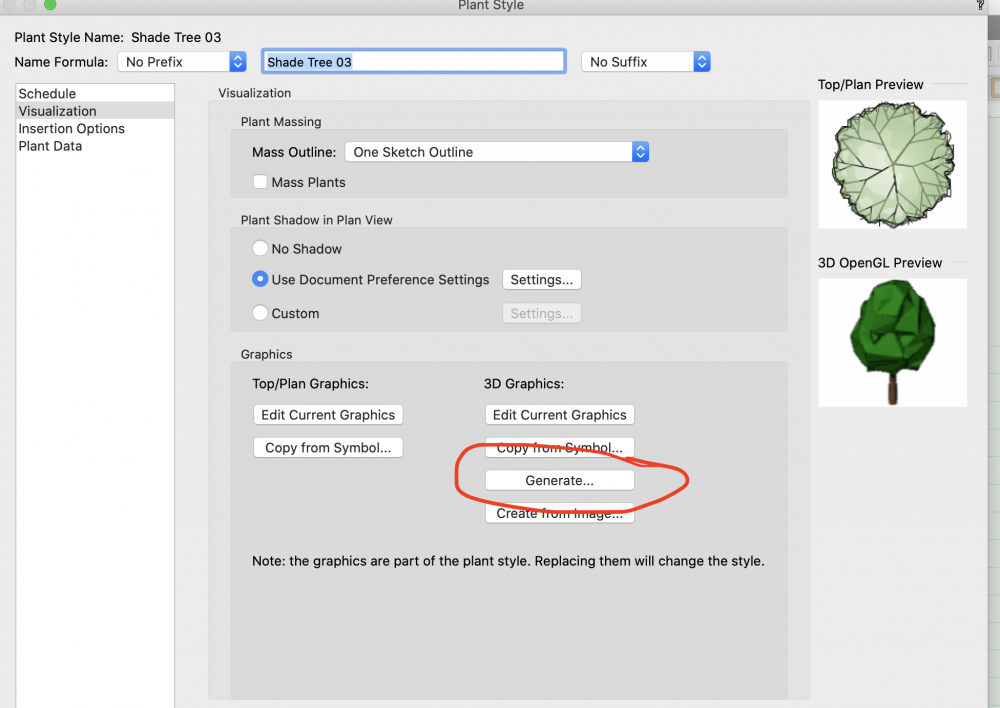
Yes, you can have several different looks to the 2D and 3D for the same plant style. Just create the plant with the 3D mesh graphics and then go in to 'edit 3D graphics' and add the Image Prop (the easiest is to copy one from another plant that you like). Then you just have to create different classes for the different looks - that's how you control what is visible.
If you want to, you can have several seasonal Image props for the same plant, just make sure you give them different classes.
This way you can then use the same plant style for everything from sketchy concepts to final renderings (instead of having different trees for different purposes) and you don't have to worry about counting 'the same tree' several times in a worksheet. Draw it once...
-
Hi Steve, are you using the data tags or the landscape area's tags? If you use the LA's own tags, they'll take on whatever setting you have on the area you're 'dropping from'.
If you use the data tags, they'll stay where you've put them.
Does this help?
-
Hi Steve, no, unfortunately they're gone. The plants are associated to the landscape area through the Plant Style name (not the Botanical name). If you change the style name, you break 'the chain'.
Do you have a safety copy of the file since before you changed the name? If so, open that version as well, remove the landscape areas from the newer file, copy the old ones over and you'll have the landscape areas with the all the plants back. When you copy them over, you'll get the prompt 'A format named "Additional Plant Record" already exists in the current document. What do you want to do?' Tick the 'Replace the Format in the current document' and click ok.
The landscape areas are now back in their original form and if you're recalculating the schedules, they'll be back there as well.
The other way you can do the same thing (if the affected landscape areas all contain the same mixture) is to create a single landscape area with the correct mix, then select all the 'wrong' areas, and use the eyedropper tool to transfer it (the eyedropper tool has to have the 'Plug-in Parameters' selected). Recalculate the schedules.
-
That the landscape areas are NOT showing the individual plants is actually a request which came from Landmark users. It's an extra step put in just because designers didn't want the individual plants visible - they wanted clean, large areas without the fuzziness of all the plants.
However, we have received this request before and it is put in as an enhancement request.
-
2
-
-
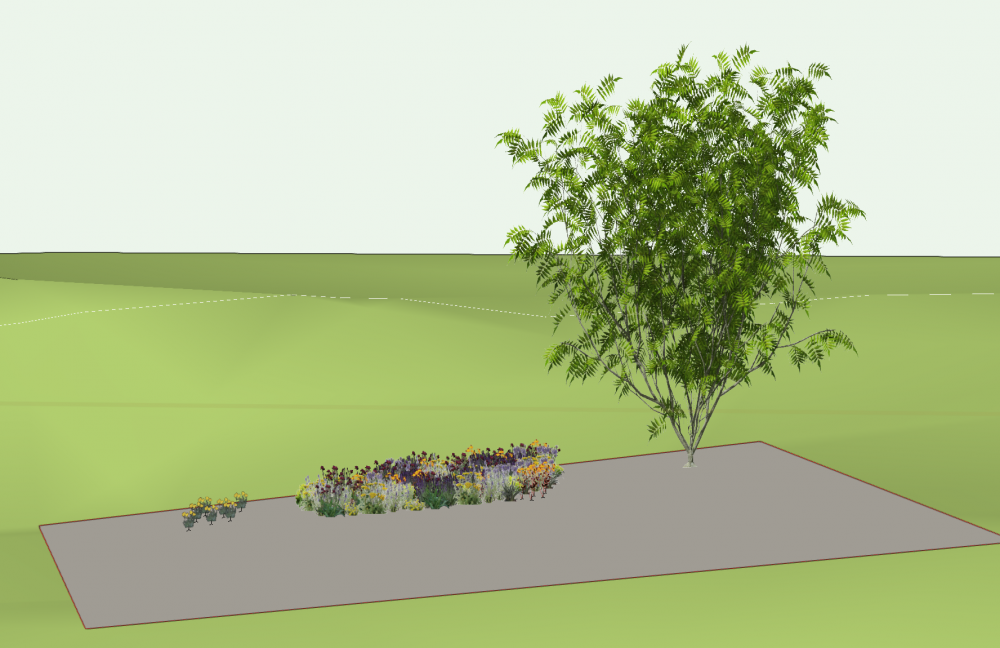
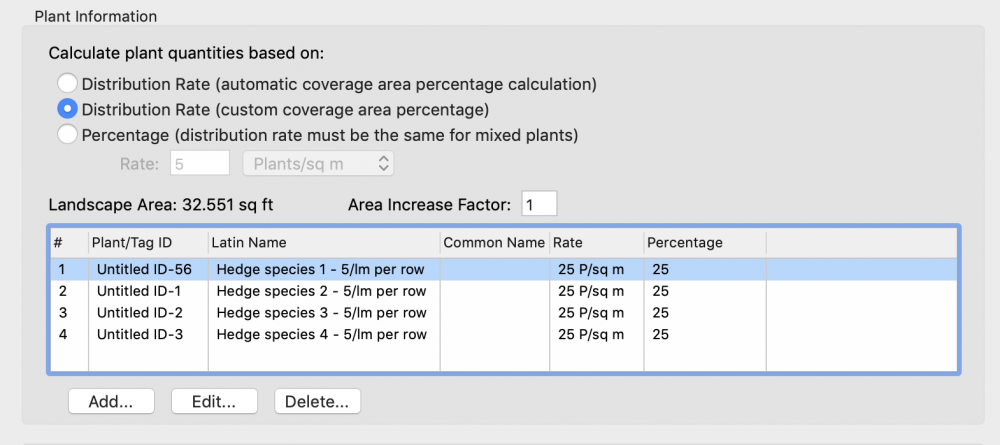
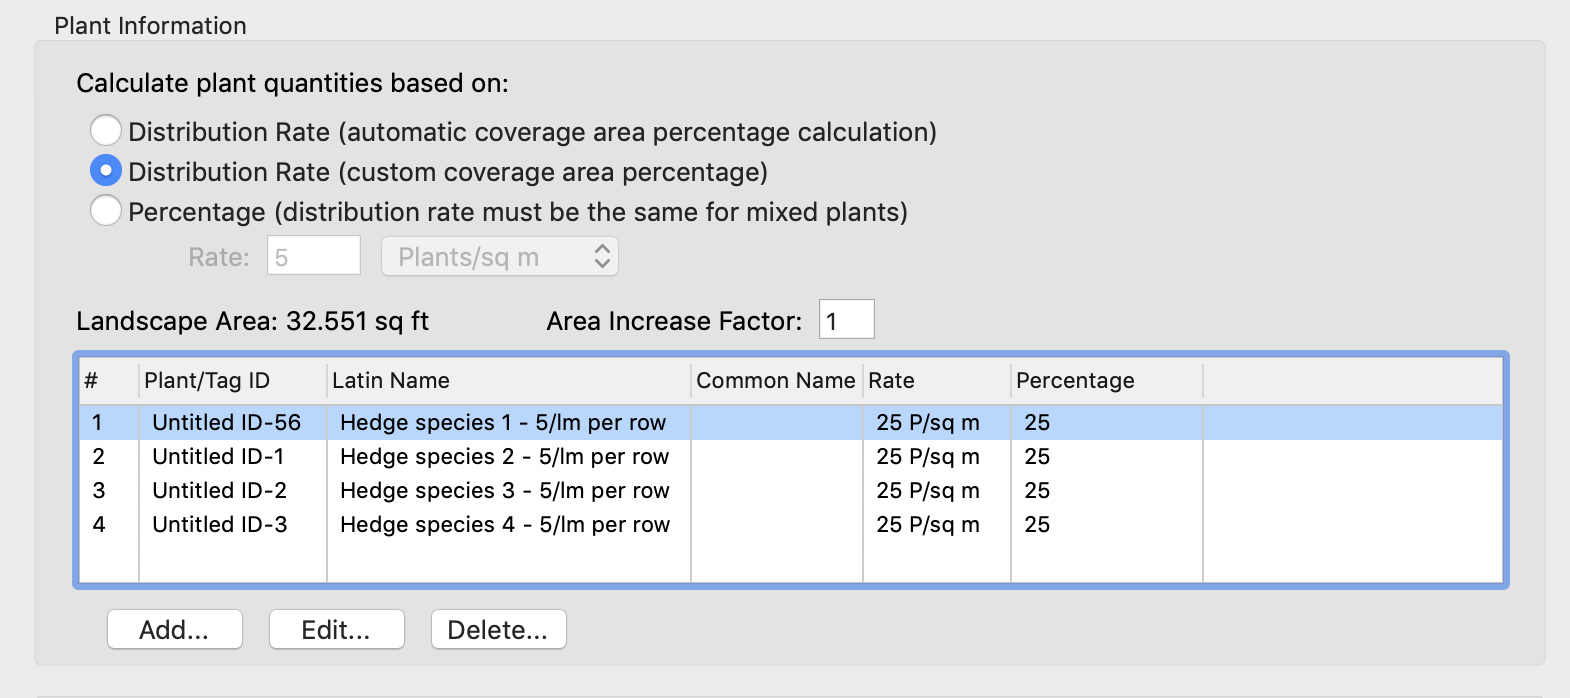
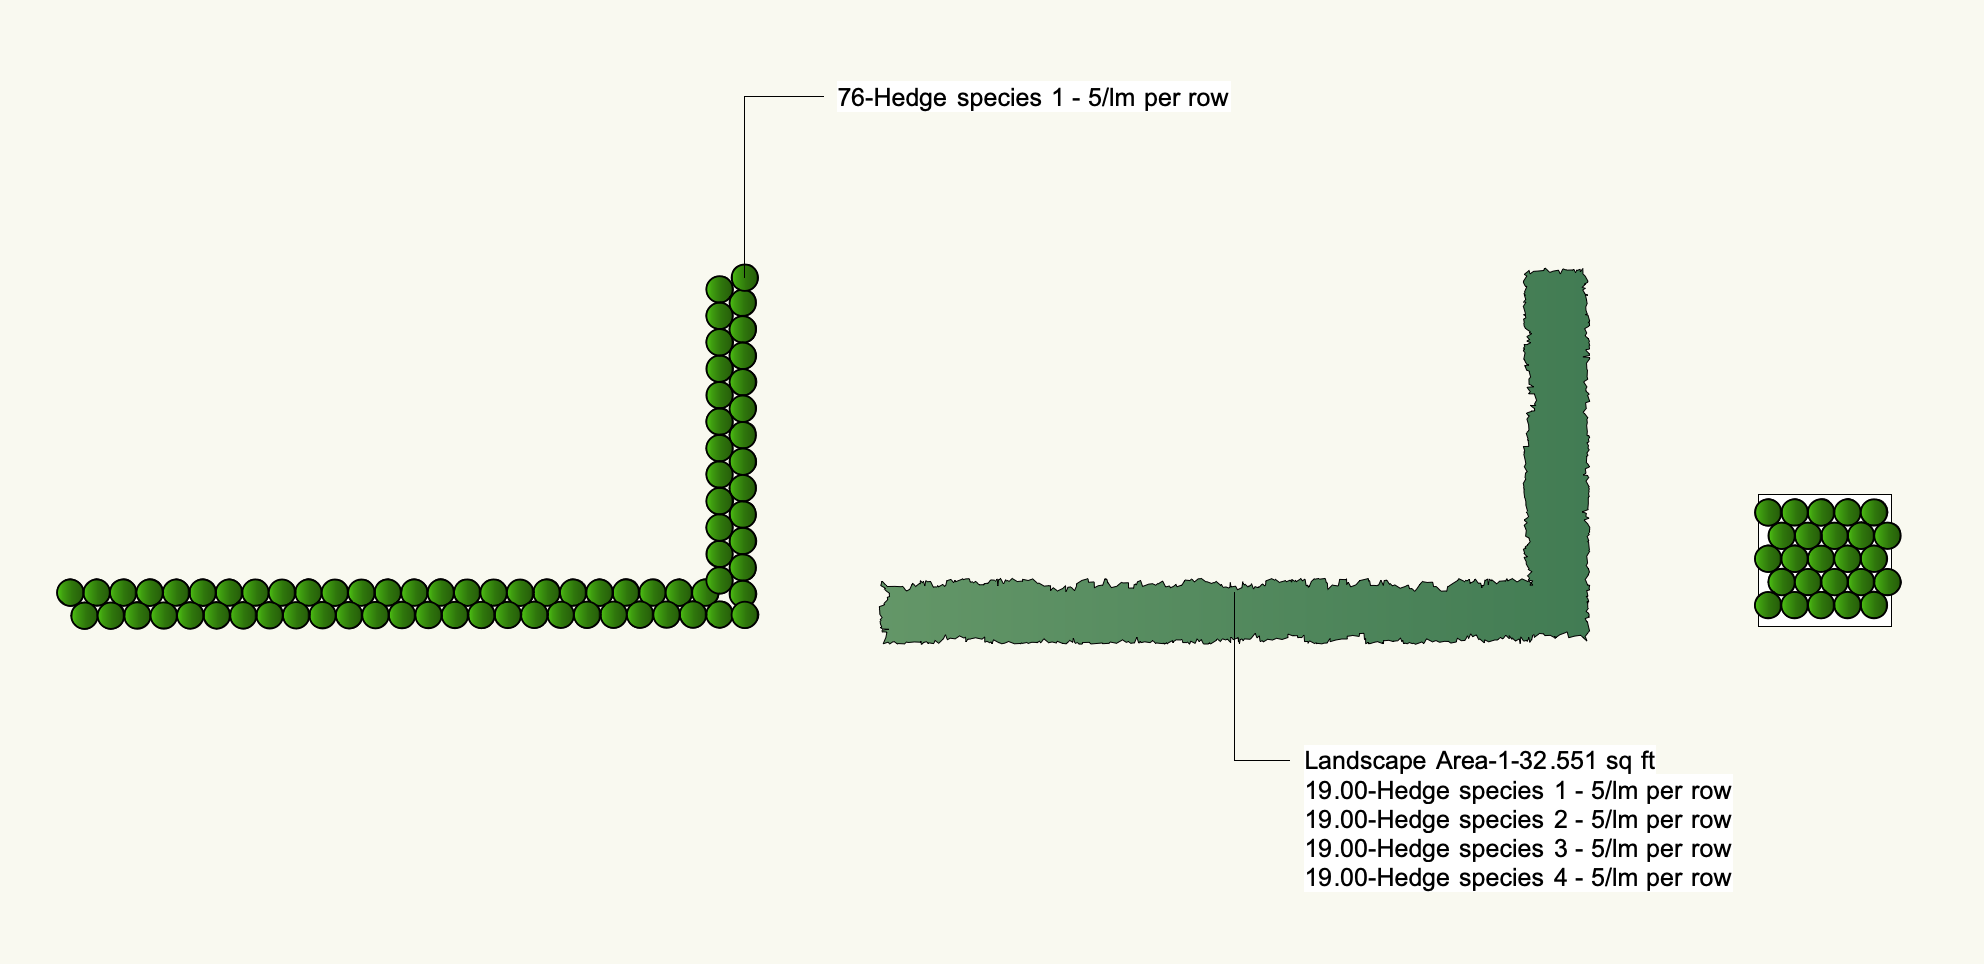
Mixed hedging doesn't work when using the plant tool. The idea with the plant tool is that it only places one kind of plant at the time, either in single mode or in a poly-vertex/edge or array mode. This is the nature of the tool.
To place a mixture of plants, you have the Landscape area tool. This is a powerful tool, where you can set up mixes of plants you use all the time (either for planting beds or, as in this case, hedges). This tool works the way you say that you want to work - you create a geometry, either directly with the tool or by converting existing geometry, and you then tell it what plants you want it to contain and it will then give you the numbers.
An example:
If you say that you want to plant a mixed hedge with staggered rows and you use 5 plants per linear meter (per row), what you have to do is calculate how wide that double row would be, create a landscape area in this width and populate it with the mixture of your choice.
In the example below, I've first created a hedge according to this specification (as a comparison), then drawn a polygon to the size you want the hedge and converted it to a landscape area, in which I have put in several different species. (You can also see that it would go 25 plants in a m2 if you used the 5/lm size).
This way you also avoid having the individual plants showing. You can use the plant line on the landscape area to make the edge 'wiggly', and use any fill you'd like. Here I've just used a simple gradient, but you could use anything your practice normally use for hedging. (If you'd prefer, you can create yo your own line style specific for hedging and use that instead of the plant line in the landscape area).
If it would help you, I'll gladly send over the standard widths for different hedge units that I've collected over the years. Then you only need to use the double line polygon tool, set to the width needed to create your hedge area and then convert it to a landscape area.
This is a very effective way to work when making a lot of hedges- you create the hedge mixture for the landscape area once, saving it and then apply it to all the areas you want it on. Once you have created one area with your mix of plants, you can then select all the other areas and use the eye dropper tool to fill them all in one go. After that, remember to save the Landscape area mix so you can use it in your next project.

-
1
-


Plant Tag settings independent of Plant style
in Wishlist - Feature and Content Requests
Posted
Hi Laura,
The plant tag has been included in the style after requests from many of our users. It also a part of making the plant styles work more like the other styles in Vectorworks. I understand that this new setup doesn’t suit everyone, and I would wholeheartedly recommend using the data tag instead if you find the new settings incompatible with your workflow.
The data tag is super flexible, you can change the look and the content and you have much more control of the placing of the tags.
I was very doubtful to the data tag at the beginning, thinking that ‘I already have a tag in the plant tool’, but I had to eat my hat after using it for a while.
The biggest advantage is that you can place the tags in the viewport (where all annotations belong) instead of in the design layer.
You can also align the tags much easier working with the data tag.
I’ll post a link to a short recording of a good workflow a bit later today. If you still have any questions after that, let me know and we can set up a Zoom to go through it.