Jump to content
  • 0

separate database column


Samuel Derenboim

Question

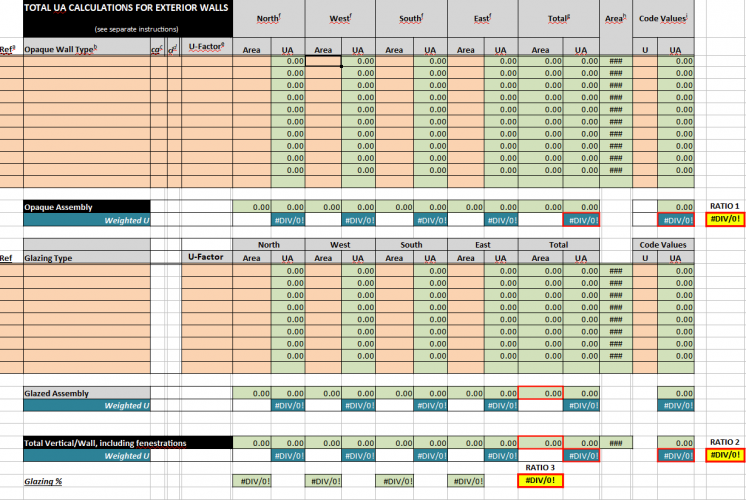
In order to align several databases along the same row, I believe we need to provide the ability to reference a separate database formula for different columns (using if statements). It could prove to be useful when managing different datasets that don't have related record information, or have the same record information, but isolated extraction methods.

Example below illustrates something that currently isn't possible in vectorworks that is driven by databases because each orientation would require a separate database callout with the rows controlled by an if statement. If they were controlled only by one datase record request, every orientation would be blank and distributed onto later database rows (rather than the same database row). Is something like this possible?

image.thumb.png.0a95957166d4865b6e2154b404499935.png

Edited by Samuel Derenboim
Link to comment

6 answers to this question

Recommended Posts

  • 0

I am almost certain it can be accomplished, but I don't know what it is you are trying to accomplish.


The database criteria define the objects that are shown in the database subrows. 


The formulas in each column can reference anything that can be accessed through the object(s) in the subrow. So some column could be a simple formula like =C (to give the class). A second column could reference a record/field combination that is attached to the object (=ABCRecord.ThisField) while a third could reference the PIO record/field or a second attached record.


Your different vertical sections can be done by using multiple different database rows.


What am I missing?

Link to comment
  • 0

@Pat Stanford 

If a number of objects have a different orientation, it would leave all the other records empty that are in the latter fields. 

So when callout out a record, you can only call one out at a time since a single object can have one record. So 2 objects cannot be in the same database row, hence the request for a database column with a separate database query. 


For example, in the chart above calling out objects currently would look something like this : 


image.thumb.png.6d623f40a44f3b2c362e849dc2b29e23.png


each row is a database row, and can be applied to a single record. In this case, the record is north, west, east, etc... If it fills up only that row for that specific information, all other orientations are namely 0, and the summations would need to be charted differently, not withstanding the fact that the chart itself would be 4 times larger than it should because a database row cannot describe two different objects at the same time in a single row


The example that I'm requesting would look something like this


image.thumb.png.ef1d8ee24c8fd2c8e90adcbdb9fd08d2.png


The database columns would function the same way callout out record information in table rows. The only difference is that the information can be cut off at the column level as well, that way, multiple objects with same database records for ID's but different values for orientation can be described on a single row (in this case it would be 4 database columns). It can additionally be handy if the records were different, and you needed to multiply, add, divide two different objects with different records on a single worksheet row. The latter would get very tricky because I don't know how the worksheet would react if one database column had more rows than another database column, and consequently aligning information could get tricky or tedious. (In essence though, it would be very useful in summaries of database rows, that way information with relative records is summed up)


Hope it makes sense 🙂

Edited by Samuel Derenboim
Link to comment
  • 0

I am working way too fast this morning and have not really digested every detail you wrote above. Thank you for the detail. It actually helps to really know what the problem is.


Tell me if this short version is what you want.


A column that will display the sum of a specific record.field combination for all of the item that have been SUMmarized into a database row.


If this is correct, then I think it is probably possible to do using a Worksheet Script, but I will have to play with it and see.


Link to comment
  • 0

Thank you  @Pat Stanford


Not sure how a script would work if there are a number of database rows that would be generated for the number of records in the document per column. It's not simply a summary of one item in a database row. If that was the case, maybe there can be some kind of field entry into a worksheet that describes the criteria and the record and field information summary you are trying to pull out. My hunch though is that that information would be summarized in one table cell. (unless I'm misunderstanding something)


 In this case, a column could generate multiple records, maybe even dozens, the only detail is the output of database rows that it would be limited to a specific number of columns (or simply just that column).


The only way (I think) it would work is if a column had a similar hide feature for database rows that would function like new type of database header for that column, or a series of columns. That way, that dummy column can set the database criteria to be pulled out and the column limit (in case you wanted the criteria to control multiple columns rather than just one). Once you set that information, then you can generate and populate the record and field name call outs in the database row header just like you normally would in a worksheet. The only difference is, it limits the information to only two columns (or the number of columns that you specify limiting the database row criteria to be populated) 


See below for a diagram :


image.thumb.png.7cca5a9ab858f372792d2f82abb872ad.png

Edited by Samuel Derenboim
Link to comment
  • 0

Can you give me in words the real world scenario you are trying to solve? I am getting confused.


It looks like you have a worksheet of walls. How do you want those walls to display and what one piece of information about those walls would you like to show? Once we get it working for a single field, adding more "should" be easy.


Also, can you post a sample file with a few walls in it with any special records or other information to show how this works or needs to work.

Link to comment
  • 0

No problem. Here is a sample file. They try to do the same thing, but the format by which the table is laid out from the above excel file would not be possible. If you set up columns for each of the cardinal axes, they will return 0 because each record is counted only once per row.


Thank you again @Pat Stanford 


Test Worksheet_Geometry Method.vwx

Edited by Samuel Derenboim
Link to comment

Join the conversation

You can post now and register later. If you have an account, sign in now to post with your account.
Note: Your post will require moderator approval before it will be visible.

Guest
Answer this question...

×   Pasted as rich text.   Restore formatting

  Only 75 emoji are allowed.

×   Your link has been automatically embedded.   Display as a link instead

×   Your previous content has been restored.   Clear editor

×   You cannot paste images directly. Upload or insert images from URL.

×
×
  • Create New...