Search the Community
Showing results for tags 'formulas'.
Found 2 results
-
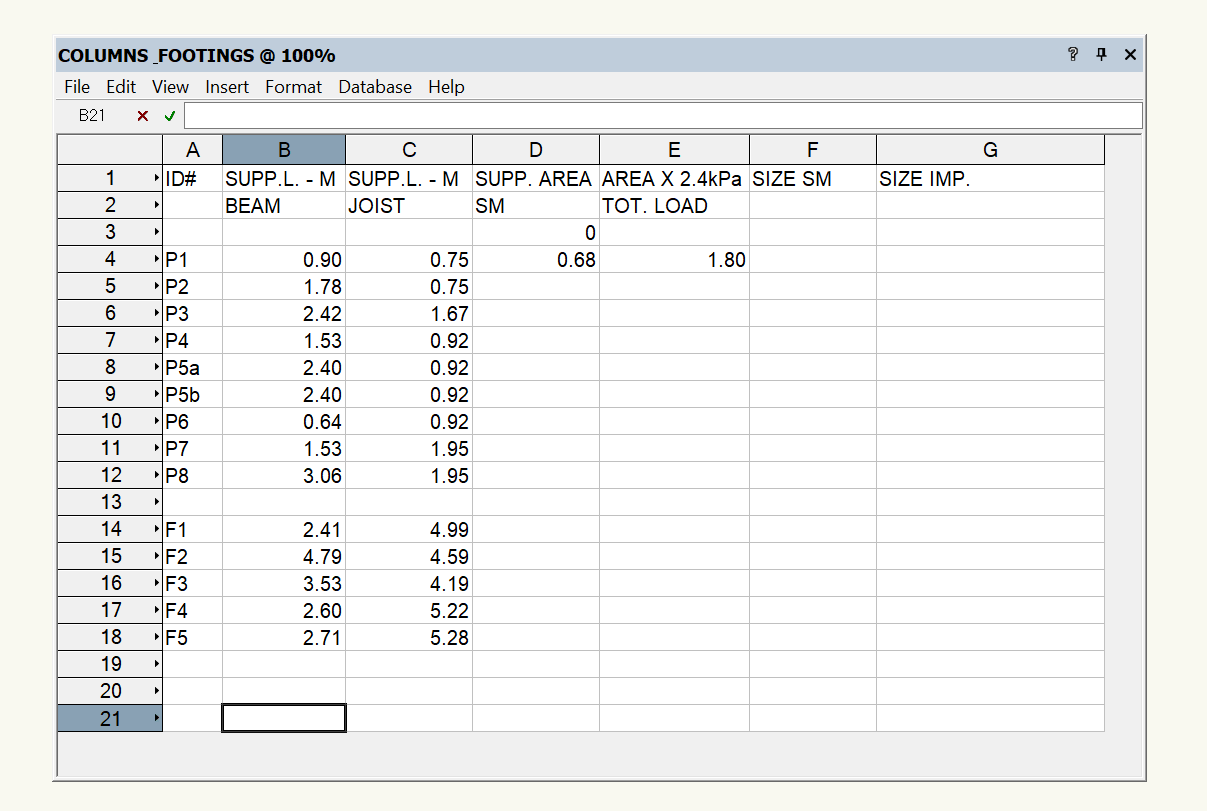
 Hi VW peeps at the risk of asking a really dumb question - how do you insert a formula to do simple math operations within each row? I have tried everything. easy sample here: footings and piers: (I have a monster worksheet that I can't bear to think about if I have to enter the operations in every cell manually - I did create that using spaces, but that's another question - how to add a similar math operation on that?). **should I export the worksheet to excel and do the calculations there? The numeric values here are just entered manually. I need to multiply col. B x C =D. then need to multiply D x 2.4kPa to get E then another multiple for F, and a conversion multiplier to imperial for G....for the jobsite. this should be simple, but many hours later.....I did try VW help, this forum, many worksheet tutorial videos... learned lots, but didn't find anything on this specifically. I'll sign off as anonymous lol. thank you!
-
 It would be nice if it could be possible to link a formula to a data visualization viewport. For example- I have a GIS map of a town that I can use to get the lot size and building square footage. I can calculate the FAR (floor area ratio) of the properties with a worksheet and would like to be able to show the various FAR graphically in a viewport. I would like to take record values, create a mathematical formula, and apply them to the data visualization viewport. Another instance of data visualization that I would like to do is to be able to compare a space net/gross area to see if it is greater or less than the proposed area that is required from the programming analysis.
- 1 reply
-
- 1
-

-
- viewport
- data visulization
- (and 2 more)