Jack2022
-
Posts
174 -
Joined
-
Last visited
Content Type
Profiles
Forums
Events
Articles
Marionette
Store
Everything posted by Jack2022
-

How do I Make a Curved Wavy Wall (Curved in Plan and Elevation)?
Jack2022 replied to Jack2022's topic in Site Design
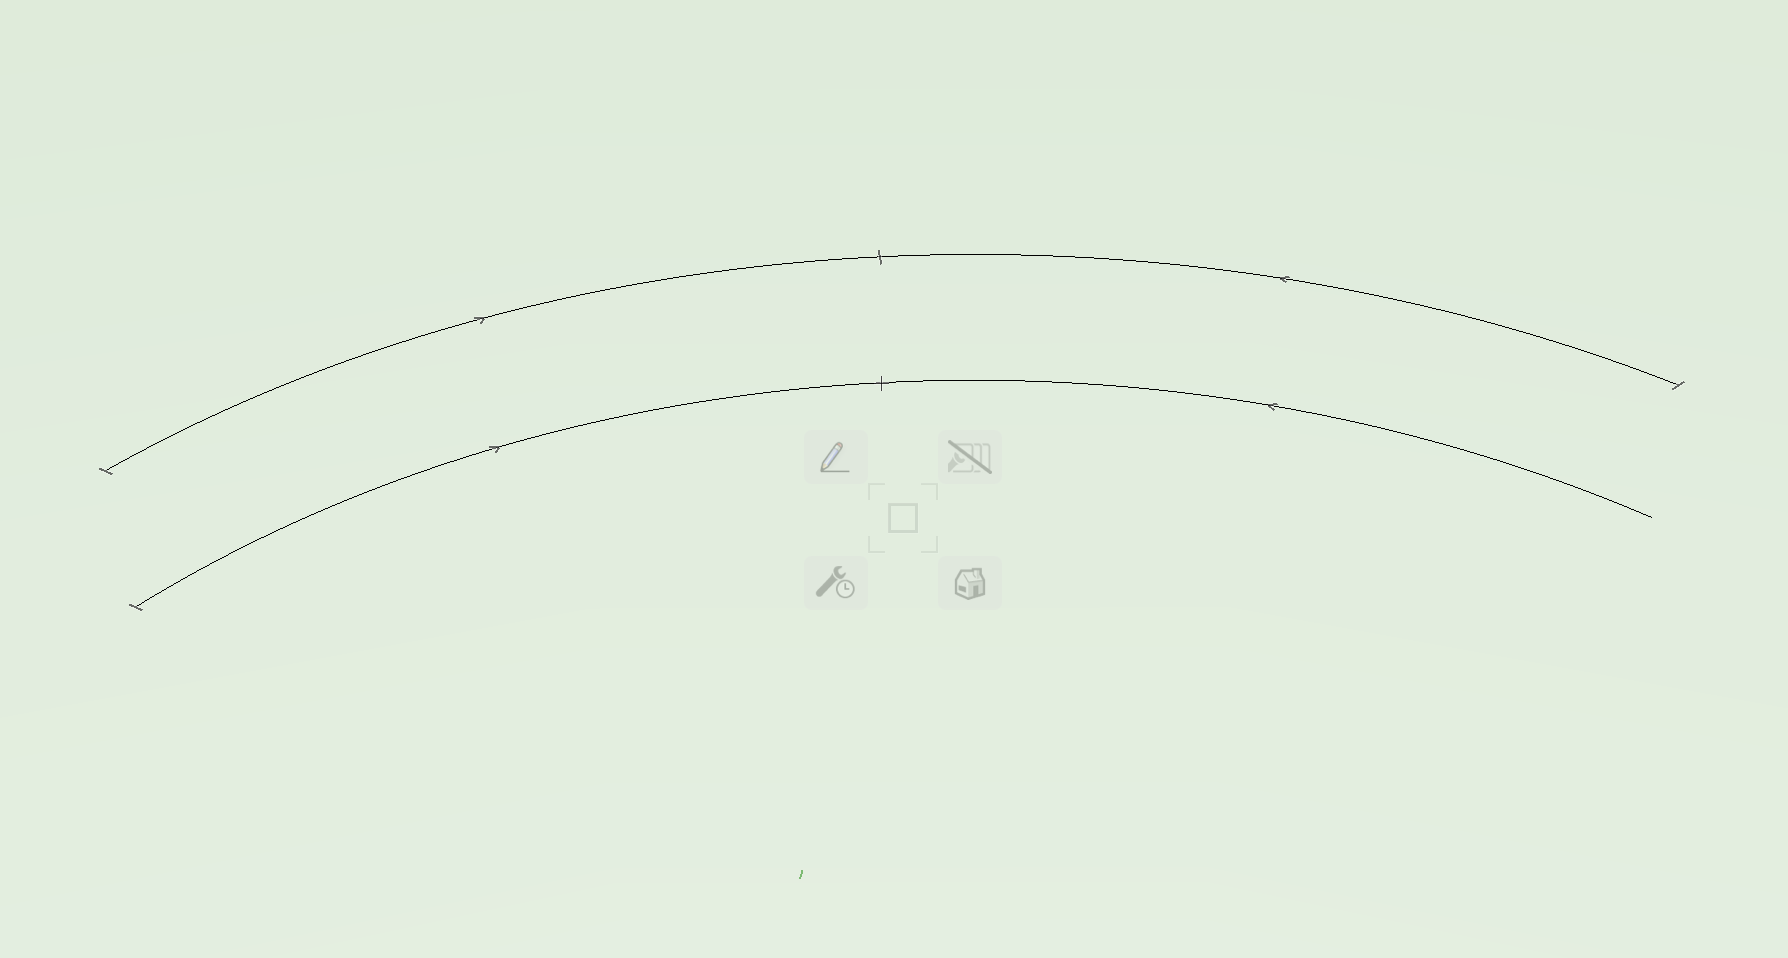
this sounds promising it doesnt let me move the end points down though? the two curves I have drawn are 2D one above the other. toothy need to be a particular type of curve? honestly not that much or a rookie but this I haven't done before.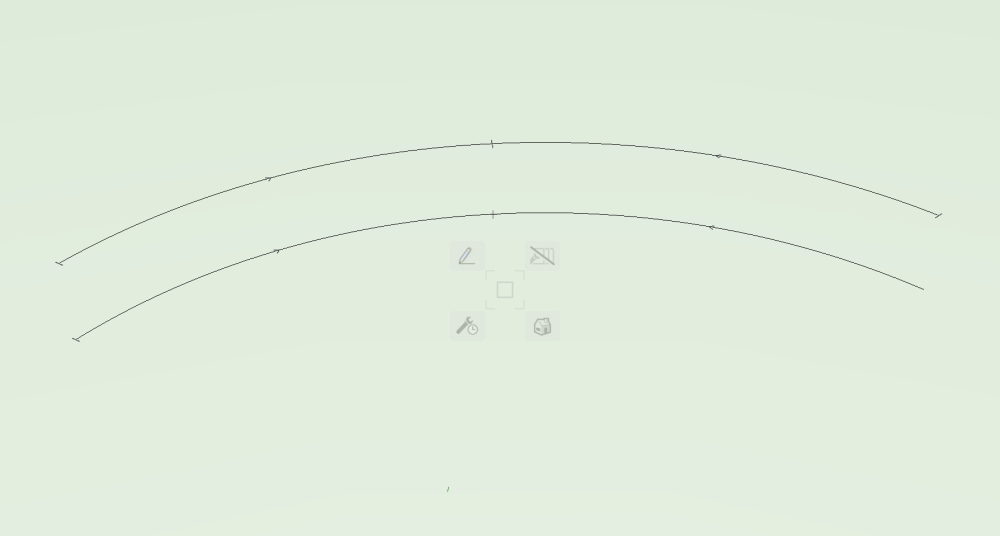
-
How do I Make a Curved Wavy Wall (Curved in Plan and Elevation)?
Jack2022 replied to Jack2022's topic in Site Design
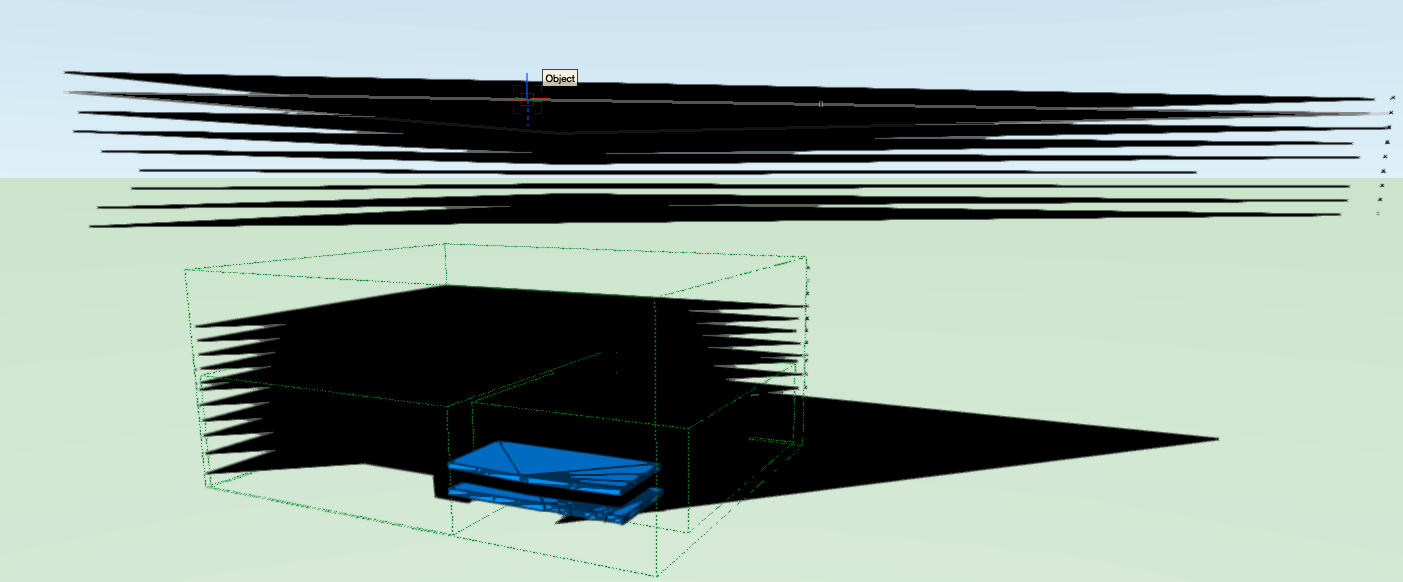
Thanks for this. Was hoping to avoid subtract solids as its a bit of fiddle making the curved solid to subtract from the wall. Will give it a go to see. Any options where I can pull vertices up and down? even if not perfectly accurate? -
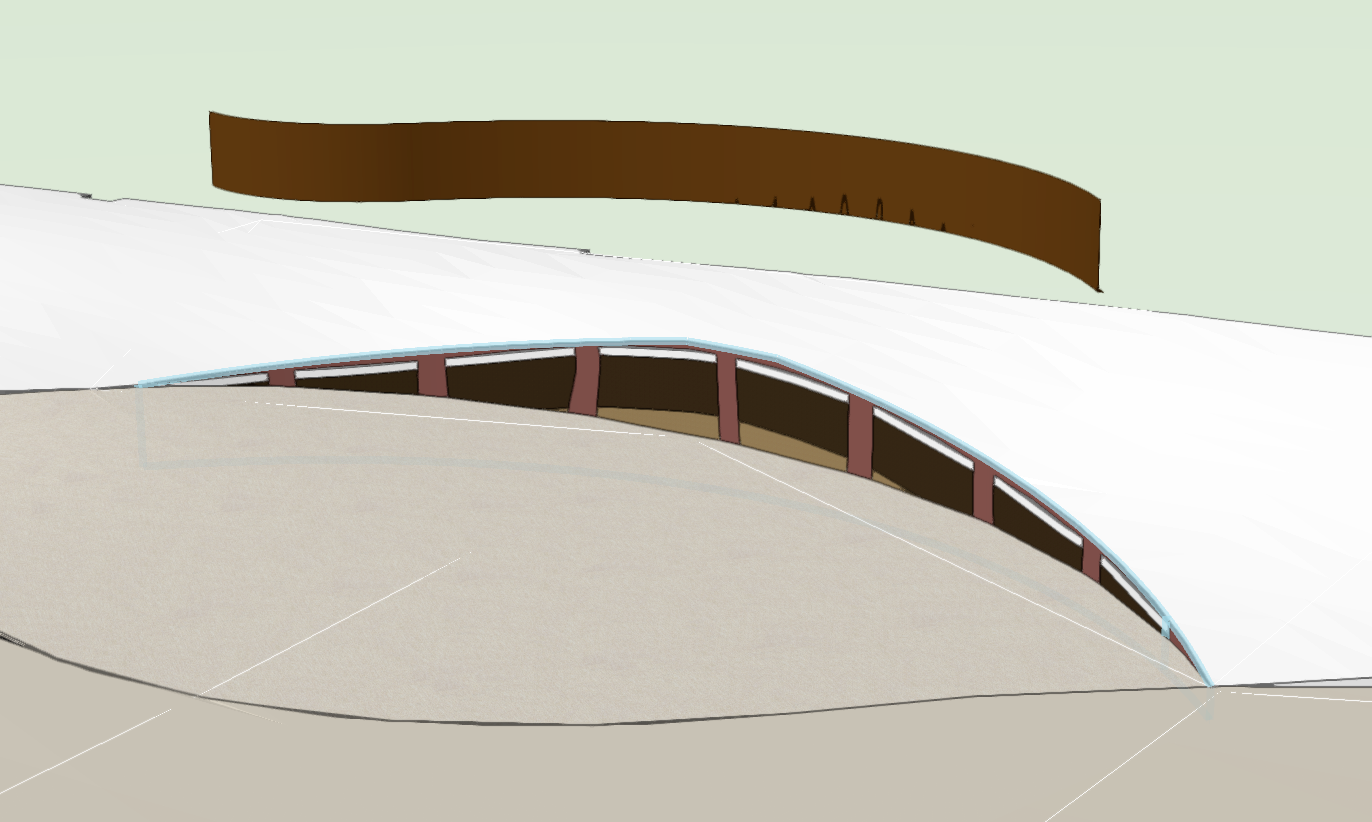
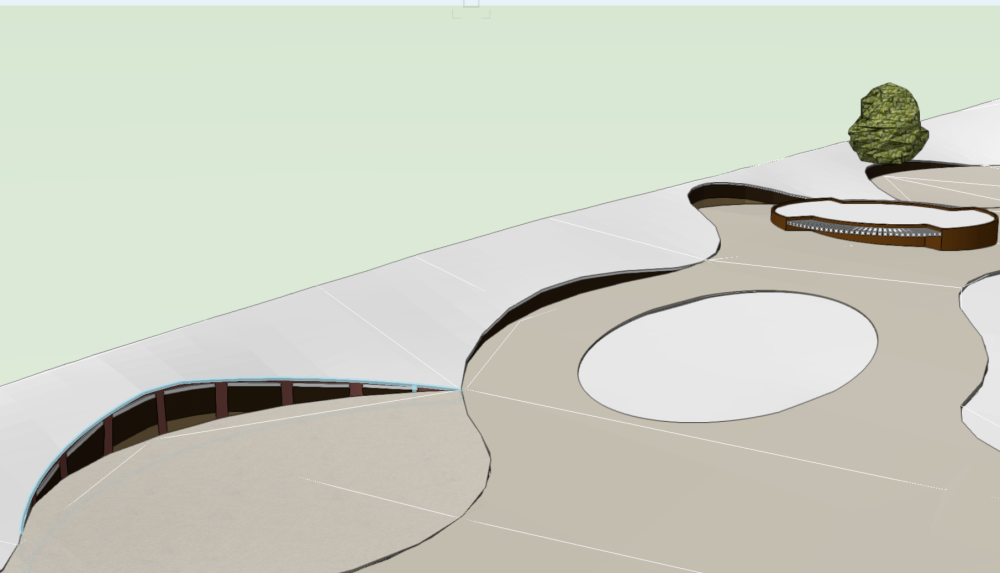
Hi All, Ive seen images of lots of complex wavy extrudes and curved entities while learning Vectorworks but I am struggling to make a simple curved wall (actually a thin metal edge) that curves in plan and in elevation. Screen shot below of intent. I want the bottom of the wall to be flat but the top to gently rise and fall. Is there an easy way to do this? I've come close by making a curved wall and pulling the end vertices up and down but this tends to affect the whole length of the wall and if you split the wall it results in a pointed peak. Thanks all

-
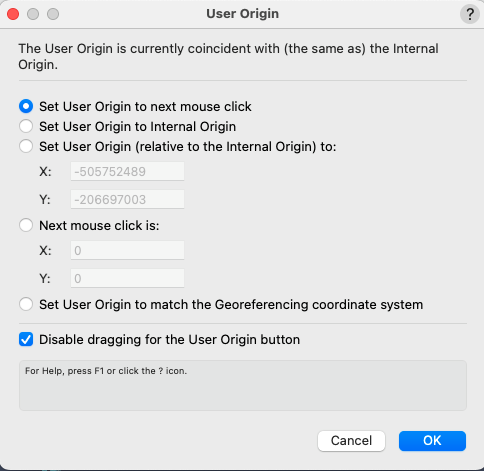
Hi, Ever since following these steps i've not had an issue with Revit users. The VW model imports correctly their end - but you need to set the VW 'User Origin' coord to match the georeferencing system before you do (last option below): you can change back after to suit - user origin is a movable/ flexible thing and doesnt affect the core set-up of the file. You also need to make sure you change angle to true north to match the Revit user's set-up (assuming they are lead and you follow their set-up). This depends on whether they have a false north. This was a bit of trial and error for me as depends which way round the degree arc they've gone but becomes obvious if you have an auto cad Topo survey in correct position. If the Revit model is already orientated to true north then no problem. Lastly VW (as far as I can tell) doesnt allow you to have a false Z value whereas Revit users often have this. In this case I tell them it's as simple as clicking on our model and giving it a Z value as required. This is easy if the model is otherwise in the correct location. So in simplest terms you need from the Revit user: Their Internal Origin Coord location (dont accept alternative terminology about base points etc. often they dont understand what you're asking if not the BIM technician). Angle to true north. Regards, Jack
-
Hi Kian, This was written for VW 2022 - but I see now 2024 allows you to input N/E coords in Geo referencing menu! Saves steps from above.
-
Thank you both. will explore this
-
Hi All, another of my posts touched on this however it might help to separate the issue out. After some trouble and help from others I managed to get photos of plants to display in the plant schedule. Is there a way to get all the plant images to display as a grid? At the moment I can only get them in columns and if you repeat the column formula across subsequent columns the images just repeat. Thanks, Jack
-
Landmark - Plant Schedule displaying image of plant
Jack2022 replied to J.Aspect's topic in Marionette
almost there ... it started to work when I drag the plant symbol into the drawing. looks like it doesn't work for mixes applied to landscape areas. You need to insert the individual plant somewhere out the way. Now the challenge is to show multiple plants on a grid not just one column. I applied the same =PLANTIMAGE(2) to the next column and it just repeated the first. Any ideas?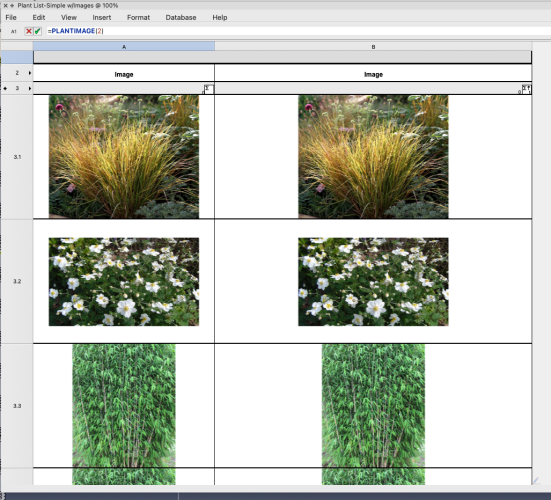
-
Landmark - Plant Schedule displaying image of plant
Jack2022 replied to J.Aspect's topic in Marionette
Like Tom I can get it to show for the more graphical plant but not the plants represented by circles. Still exploring. On another note auto sizing the images causes the image that does work to disappear. custom size results in it returning. -
Landmark - Plant Schedule displaying image of plant
Jack2022 replied to J.Aspect's topic in Marionette
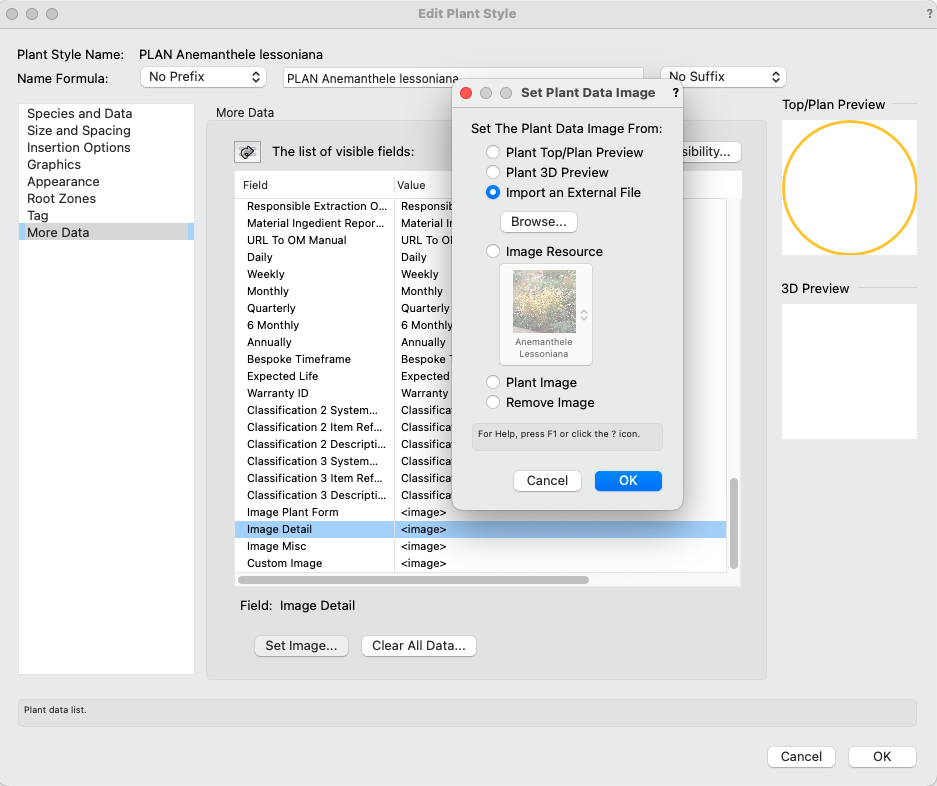
Wonderful thank you I will try that. I previously chose the below option and I also tried to add a plant photo to the resource library then load from there but no luck. first try: second try:

-
Landmark - Plant Schedule displaying image of plant
Jack2022 replied to J.Aspect's topic in Marionette
J6470-PLA-ZZ-OO-DR-L-92301-P01.vwxI've attached the file. I tried the alternative PLANTIMAGE (1..etc) and still no luck. I added a photo to the plant styles of two plants only just to test. Ultimately I'm after a grid of photos of the plants in the landscape areas but if we can get one photo to work I can apply to the others. Thanks for any help. -
Landmark - Plant Schedule displaying image of plant
Jack2022 replied to J.Aspect's topic in Marionette
thanks Pat - I noticed this after I posted and have tried without the left parenthesis too. still no luck -
Landmark - Plant Schedule displaying image of plant
Jack2022 replied to J.Aspect's topic in Marionette
Hi Jeff, I have tried this and I still get a blank cell. Anything else need doing? I have added a jpeg image to every image field in the plant and tried to make a grid of plants images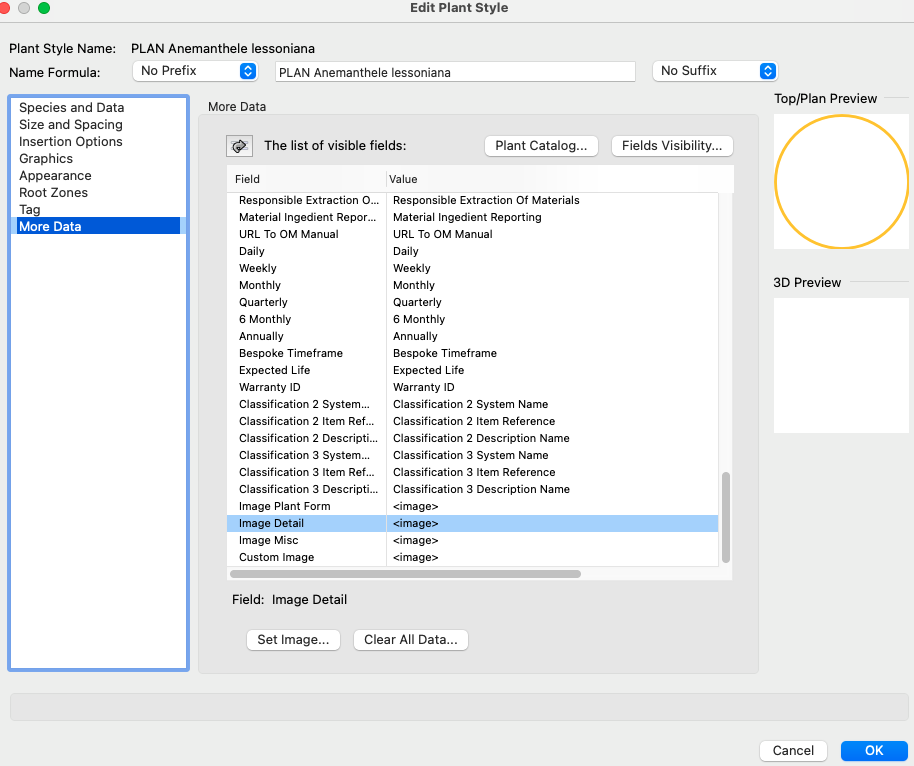

-
Please ignore - all sorted!!
-
Hi All, I am going round in circles with plant schedules (by that I mean making a report). I am using landscape area styles with a different set of plants assigned to each style. So example one style is sunny dry plants while another is shady plants. 2 mixes. I have made all the plants and added them to the styles and included relevant records/plant info to each. Please note I am not setting out the individual plants - just areas with rate and percentage of a mix of plants. I want the schedule / report to show: column 1: Plant mix. i.e Plant mix 1 'sunny dry' which is a style associated to a landscape area column 2: category i.e shrub, perennial etc. (I know there to set these in the plant record) column 3: Plant ID Column 4: latin name column 5: rate/ density (litre of pot) column 6: height column 7: spread column 8: count/number/quantity of plant column 9: notes. A couple of things I and struggling with: I want to group the plants into their plant mixes so column 1 should contain plant mix 1 'shady' and it contains all the plants within that style and below that plant mix 2 'sunny' and the plants in that mix. I don't seem to be able to do this with everything in each sub column arranging alphabetically. I could separate out the mixes onto layers to keep them separate in the table but I can't find an option to separate by layer in VW 2022. Any help much appreciated! Jack
-
Stake Labels Don't Scale Correctly in Viewport - Help
Jack2022 replied to Jack2022's question in Troubleshooting
Thanks all for ideas. I'm going to resize/ reposition the stakes on the design layer to show at the most common sheet layer viewport scale. Not ideal but there you go. The viewport text scale override wouldn't display correctly when exported as PDF anyway. -
Stake Labels Don't Scale Correctly in Viewport - Help
Jack2022 replied to Jack2022's question in Troubleshooting
Just found that although the stakes appear scaled in the viewport - they don't PDF scaled. Just in original design layer size. -
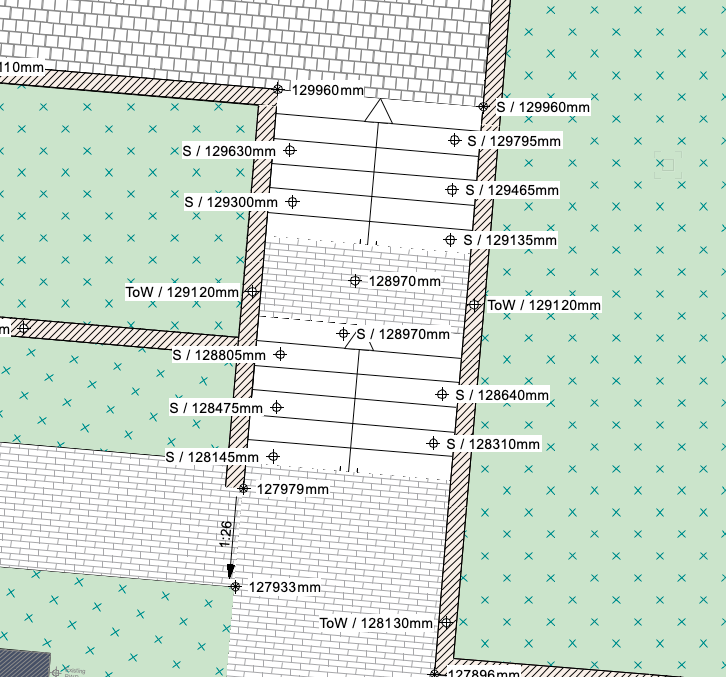
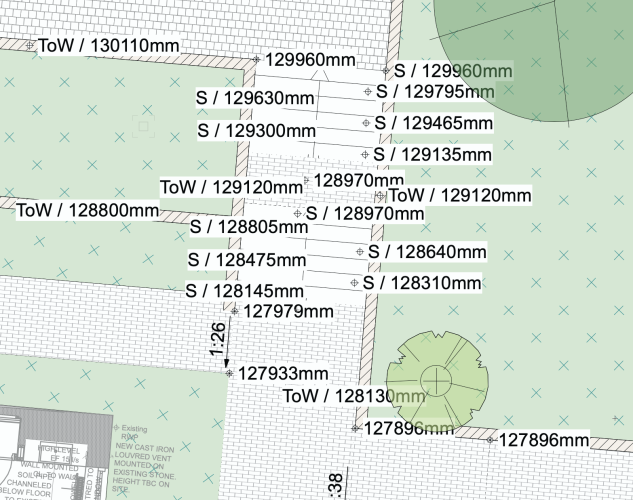
Hi All, I am producing a landscape levels plan and using stakes objects as labels. Usually this is super easy providing the relevant viewport isn't set to scale text it all displays correctly. I want to show the stakes at different scales in different viewports. I have used the Advanced Viewport Properties options to scale the text by two in a viewport. For stake objects positioned Auto or Right they appear correctly once scaled. all stakes positioned as 'Left' scale badly and look messy. Screen shots below. first image shows stakes unscaled. Second image shows stakes once scaled by two in the viewport. notice the stakes on the left of the steps scale in wrong direction. Any help would be much appreciated! Thanks
-
Looks like this only works if the empty/shuttle file you import into doesn't have 'Use at Creation' already ticked before you import. Even if the None class already has a fill attribute set to white when you import. If the host file has it ticked when you import there appears to be no automated way to change everything to another colour.
-
Solved it. went into 'none' class (Revit imports to that as default) - edit - clicked the use at creation box. It then asked to revert all geometry to that colour. Thanks for helping out and narrowing options
-
Same thing - I can click into the groups and its the polygons within that have a black fill attribute which I can change and it works. So its the default colour of the imported grouped polygon I want to change I think. Just had a thought it could be the default layer fill colour. I changed this for the standard layer in the empty drawing but then when Revit imports it creates its own layer. is there a way to change the default layer fill for new layers?
-
If I model anything it colours correctly as per the current attributes settings. The Revit import comes in as grouped 3D polys where the groups are called Revit entities (if that helps).
-
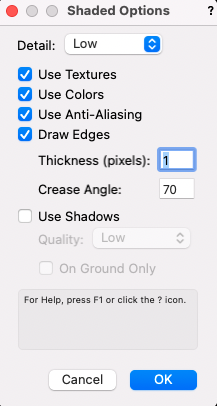
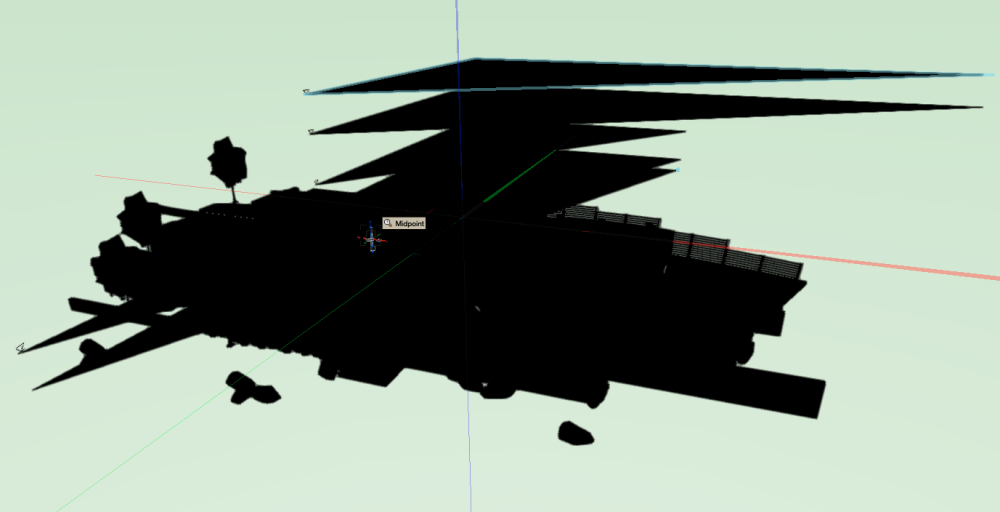
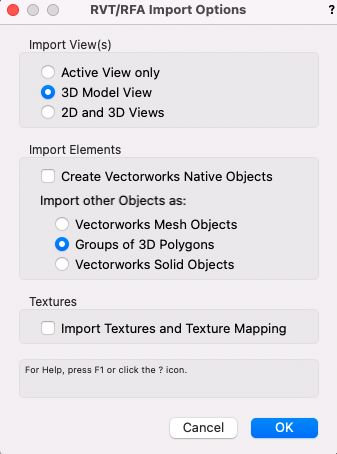
Thanks both. Ive screen shared with two providers of the Revit models and it all looks fine their end. correct colours etc. This is happening with every Revit model we import regardless of origin. I've just received another model from another architect that imports quickly so I can easily test a few ideas - imported black as before (screen shot below) but will try different attribute settings. For the record I'm importing as shown below.
-
I have raised this before but no-one came forward with the same experience. I can't see it being a Revit issue as it happens with all Revit files from different companies with different methods. Something VW is doing to turn everything black on the import/conversion to 3D polygons. example of what I see below. this is a Revit model imported from an engineer but the black attributes issue happens with all models regardless of origin.

-
Hi All, I have still not found a way to import Revit models using the 'Grouped 3D Polygon' option with the polygons having anything other than a black fill. This is making it near impossible to use the imported model without taking hours to enter each group and manually change the fill attribute of each polygon to white so I can see the geometry. The Revit import model is a large building with many rooms. Takes hours to import with thousands of groups. I do not use the other import settings as the grouped 3D Polygon option is the quickest and it still can take hours depending on the models we receive. Has anyone found a way to change the default import fill attribute colour of 3D polygons? Any help is appreciated - I have this across all Revit models we receive on various projects from different architects. thanks