


Jack2022
-
Posts
173 -
Joined
-
Last visited
2 Followers

Recent Profile Visitors
1,616 profile views


-
Thanks Jeff, I had a play with the columns tool and it works well. Can add bases and caps and good control over parameters.
-
Thanks Thomas - will consider floor /level heights as the Z base value on the next one.
-
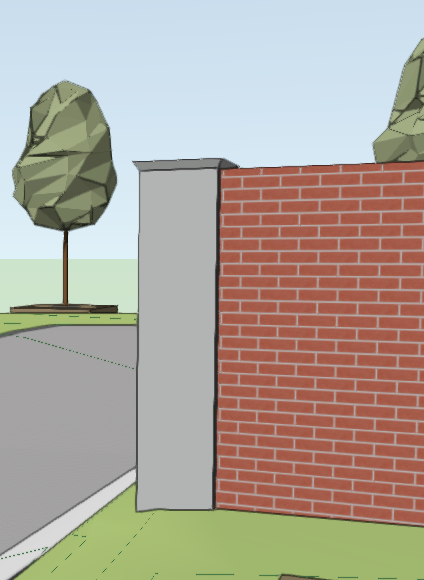
Hi All, Is there a tool to create wall piers for free standing landscape walls? I have googled but no hits. Not sure if these are called something else in the U.S. perhaps. Thanks, Jack
-
Thanks Tamsin - I will have a go with these tools. Kind regards, Jack
-
Hi All, I have recently switched from using aligned hardscapes to draped hardscapes with a site model modified by using grades. Generally it works great! Issue with curved pathways: Is the simplest way to create a curved fall in the site model via nurbs curves set to the DTM class? I saw on one thread where that was suggested. It is ok just a pain when you are modelling top and bottom of kerbs along a falling curve. Also a pain on designs with lots of curves. Maybe a way to create curved grades?? Regards, Jack
-

Site Model not Updating to Align with Hardscapes. VW 2024.
Jack2022 replied to Jack2022's topic in Site Design
Thanks Tamsin - all clear. And it works great now!- 20 replies
-
- 2
-

-

-
- hardscape
- hardscapes
- (and 1 more)
-
Ah - no I don't. Placing a grade limit around the whole site model seems to have resolved it. Grade limits were mentioned on the other thread but not explicitly that you need one around the outside of the entire site to make the grades work as expected (in my case the whole site will be modified hence around the whole site). Many - thanks. This should speed things up no-end.
-
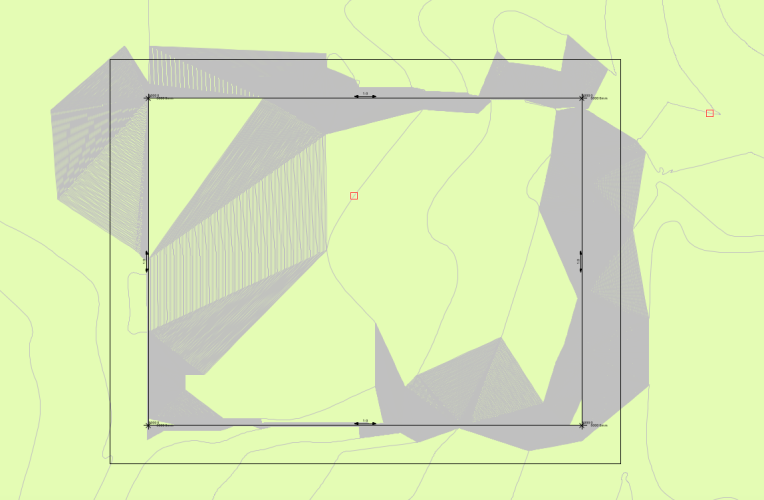
Hi All, This is an issue from another post but it seems to have become lost in a wider discussion there so posting in isolation here. I am hoping to make my workflow more efficient by using site models more. Instead of using stake objects and aligned hardscapes I hope to modify site models using grades and stakes and have hardscapes drape onto the site model. When I link 4 grades to make a square area the centre of the square sits at existing levels instead of an elevated surface inferred between grade points (as I would expect an aligned hardscape to behave between stakes). I understand that this shouldn't happen if the grades are linked. Am I missing a key step? Image below. modifier grades and site model on same layer. Many thanks, Jack
-
Found the answer: you cant fillet while having the plan rotated.
- 1 reply
-
- 1
-

-
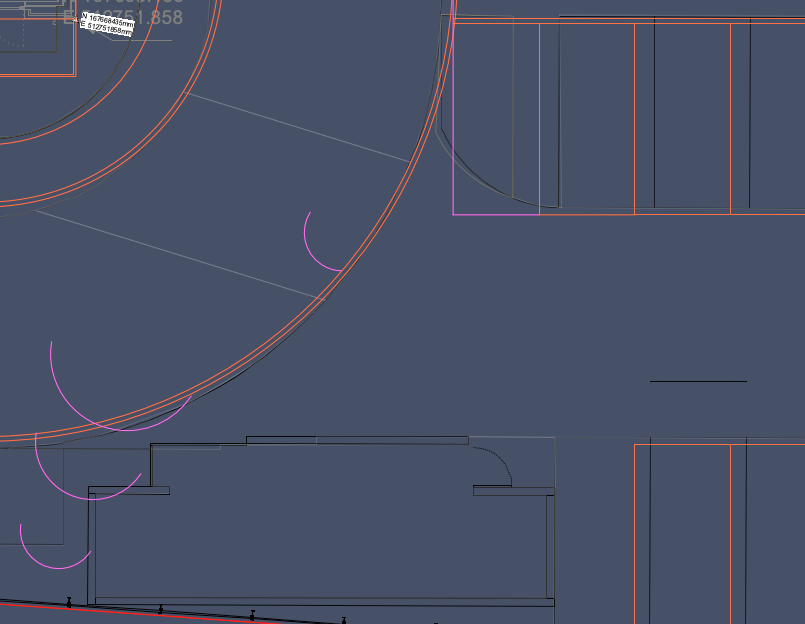
Hi All, hopefully a simple one. When I Fillet two lines at 90 degrees to each other the resulting fillet appears far from the the expected location. Screen shots below: Lines filleted are in purple and the arcs shown too. This happens quite often for me. Any thoughts?
-
Site Model not Updating to Align with Hardscapes. VW 2024.
Jack2022 replied to Jack2022's topic in Site Design
Thanks Tamsin. I now understand that part. I ended up editing my post to narrow down my issues. Are you able to help with my issues? As far as I can tell I have followed previous advice but the issues remain unless i'm missing a key step! Kind regards, Jack -
Site Model not Updating to Align with Hardscapes. VW 2024.
Jack2022 replied to Jack2022's topic in Site Design
@PNWPaul seems to have solved the problem I'm having but I am not really clear on how. I don't really understand the contribution of the Grade Limits tool in this case. My grades are definitely linked but the middle of the square remains at existing height. Same happens for any shape I try. My entire site model will be regraded as no parts of the site will be retained as existing. As such I dont think grade limits apply. Also setting the site model to align to a different layer than objects on its own layer really doesn't seem to work either. I place my site model on one layer, draw grades on another, set site model to align to that layer in its settings and nothing happens after an update. Only works if grade objects/site modifiers are on the same layer as the site model. Many thanks for any help. . -
Site Model not Updating to Align with Hardscapes. VW 2024.
Jack2022 replied to Jack2022's topic in Site Design
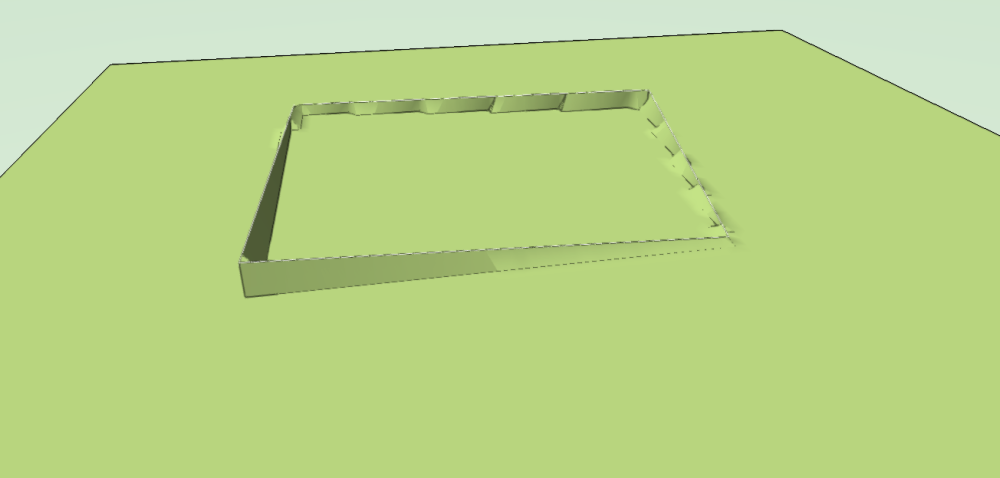
Interesting discussion all. I have been practicing using stakes and grades to set the site model as recommended. I am not yet sure how this will work with curved footpaths as I use Interpolate a lot for hardscapes with curves and site models don't seem to infer between stakes. I have found that unlike hardscapes, site models dont seem to infer between stakes. they just grade to existing very steeply. I suppose grades do this job. Example below is a square area with stakes on corners and grades between. Why doesn't it create a plateau? Also: Do grades and stakes need to be on the same layer as the site model? I changed the setting of the site model to choose an alignment layer but it loses its relationship to the grades and stakes.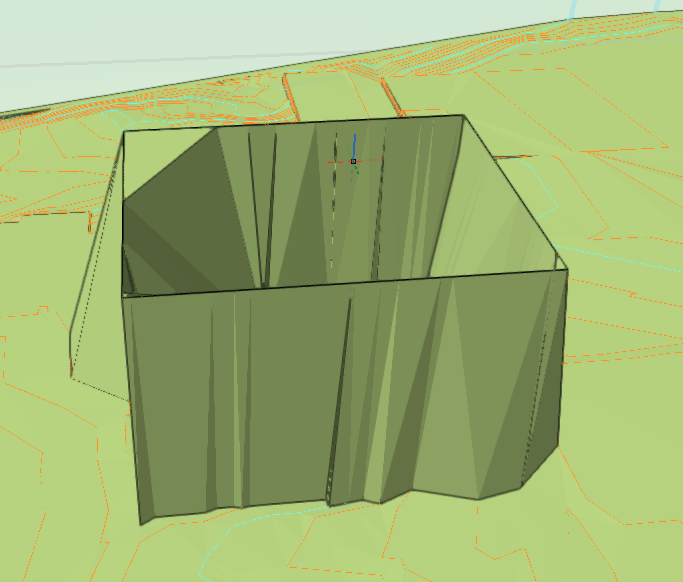
-
Site Model not Updating to Align with Hardscapes. VW 2024.
Jack2022 replied to Jack2022's topic in Site Design
Thanks Tamsin, due to the nature of most of our projects we tend not to use site models as most of our urban brown field site surfaces are replaced with paving or planting. For both we use hardscapes as we find the stake modifier the simplest method to get falls in multiple directions on one surface. I understand Landscape Areas can align to falls but only if the site model is present and correctly sloped between hardscapes. We don't tend to use site models as we don't model kerbs (exhaustive to change when levels are inevitably amended through the project stages). Without kerbs the site model pops up to existing level between hardscapes so we don't bother using site models. One thing thats been bugging me about levels is we use stakes set to 2D/3D graphic only in the design layer to create our levels plans (with grades showing falls between stakes). To create the 3D hardscapes we then need to do it all over again in the hardscape surface modifier mode. The reason we do it in '2D/3D graphic only' first is we can use line tools and dims to measure and work out the levels and gradients. In hardscape surface modifier mode you don't have access to measuring tools for distances. Perhaps we need to start using site models, using grades and stakes there with hardscapes and landscape areas are set to drape. Rather than building the hardscapes then trying to get the site model to align to them. Thanks again, Jack -
Site Model not Updating to Align with Hardscapes. VW 2024.
Jack2022 replied to Jack2022's topic in Site Design
Finding bad hardscapes resolved the moray issue and it now looks good. Still takes a long time to update site model but once done I it looks correct. Some hardscapes had thin extensions down to 0 where stakes were poorly aligned. I didn't know you could crop site models so will try in an idle moment in the future. I was sure there was a way to snap/align to top of hardscape or bottom. Can you remind me where? struggling to find via google.

