


djtowle
-
Posts
37 -
Joined
-
Last visited
-
OK I finally remembered the secret sauce, been a while since I used the reports. I just needed to add a 'count' function to the report columns. duh! So that leaves two questions 1. Is there a way to add the counts directly to a data vis legend. 2. Is there a way to edit (or save) the criteria shown in the 'generate report' dialog for an existing worksheet so I don't have to start from scratch every time.
-
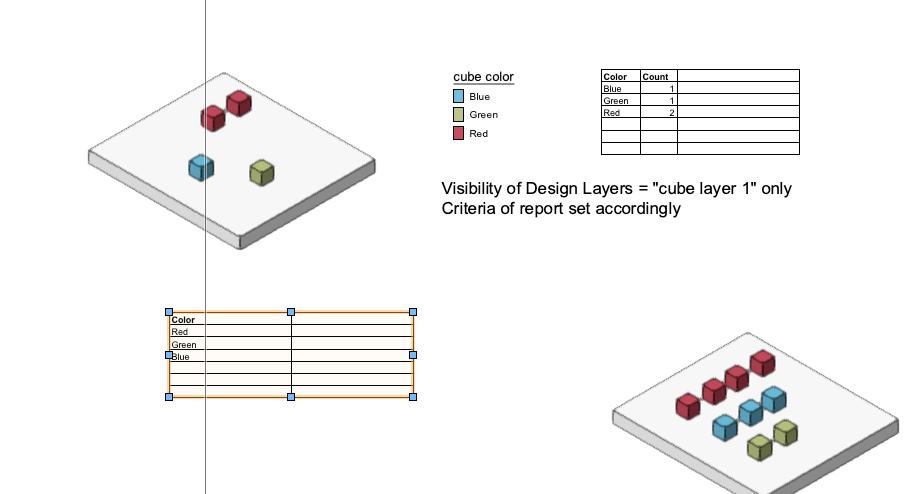
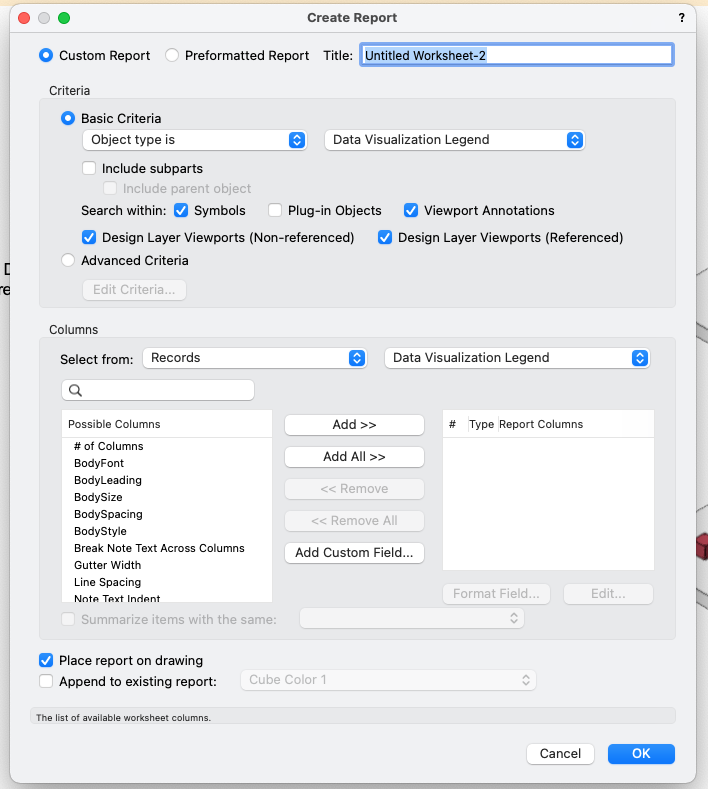
Thank you for the detailed response. You read through my question a bit that is exactly what I am doing, marking things out using data visulizations, but there doesn't appear to be a way to add a count to those legends. 😞 I assume you are using the 'Generate report' command here. I don't use it very often, but I cannot get it display the 'counts' of the colored cubes, see screenshot. I think I am missing a key setting in the generate report dialog. Bonus question: after running the generate report command and placing a little worksheet, is there a way to select the worksheet and change the parameters? Rather than deleting the worksheet and starting over. Also if anyone knows a way to directly list the counts in the data-vis legend .... 🙂 Thanks again.
-
I know there has to be a way to do this but it is eluding me at the moment. Simple Example. Cube symbol - Data record attached - Record ->Color field has 3 potential values say red, blue, green. I would like to do any of the following. 1. Select all of the cube symbols choose record is set to any individual color. (on active layer) 2. Create a legend with the 3 colors and how many of each are in the drawing (on a specific layer not necessarily in the entire file) TIA
-
I didn't see this mentioned in the replys. You can create custom visibilities scripts to hide objects from the 'custom visibilies' menu. I have one for hide selected, hide un-selected and show all.