Zsombor
-
Posts
81 -
Joined
-
Last visited
Content Type
Profiles
Forums
Events
Articles
Marionette
Store
Everything posted by Zsombor
-
I just can't upload the sample file. Any idea, why?

-
I figured out this: Stake objects to existing site- duplicated the layer and changed stake settings to proposed sites. Created a record format for Z1 and Z2 height data for the stakes. Created a report for both layers with stakes with x,y,z coordinates and Z1 Z2 records. In the report of existing stakes copied the Z column to Z1 column. The Z column of the proposed report copied to Z2 column of existing report. created a data tag for both Z values and height difference created a data visualisation tried to upload the file but failed. maybe next time.
-
I have it checked (enable online content), but still cant see lot of libraries listed on vectorworks site under LIBRARIES & OBJECTS AVAILABLE IN THE VECTORWORKS RESOURCE MANAGER Do someone have any idea?
-
What about this: 1. place stake objects on existing dtm 2. place stake objects on the same points, on propsed dtm 3. create reports for both with X,Y,Z coordinates 4. export to xls, then match the right rows with same X and Y. So we'll get a worksheet with X, Y, Z1, Z2 I can get till this point but unfortunatelly no further. But something like that?: Importing the worksheet itself or making a database from that. Then create a record format for the stake objects and match it with our database, so we get stakes with both Z1 and Z2 heights which we could tag, and make also data visualization. Theres a video on VWX university about this method, but It was quite complicated for me.
-
Thank you! I was also thinking of copied stakes objects on different layers. But my hidden target would be to create a data visualisation, where "color-gradients" codes could show the cut and fill quantity. I could rectangular array the loci, tag them, and the color them. But this would be probably only possible, if I could link both (existing and proposed) height data to one object.
-
Hello, with stake objects there's the opportunity to tag either existing or proposed heights of the site model. It would be great to know a method to tag both of them at the same time, and also the height difference. I was wondering if I could get somehow the x and y coordinates of 2D loci or any other objects, then get the Z coordinate of that X and Y from the site model, both existing and proposed. Maybe is it possible with some reporting features and create a worksheet? And at the end create a datatag to put all de data on the drawing? I hope I could express myself clearly. Thank you for any idea!
-

Site modifiers have no effect on dtm, and freezes when update
Zsombor replied to Zsombor's question in Troubleshooting
Thank you Jeff , I'll check it! I also noticed this, but didn't think it can cause nothing to work. -
Site modifiers have no effect on dtm, and freezes when update
Zsombor replied to Zsombor's question in Troubleshooting
Can geolocating layers cause this ? Now I started with a new file, everything is the same just I forgot to check the geolocating option in layer setup. It seems to work. -
Site modifiers have no effect on dtm, and freezes when update
Zsombor posted a question in Troubleshooting
Hello, I'm quite familiar with site modeling but I'm still get stucked over and over. I have a site model (layer DTM) I have site modifiers (layer szintezés finomterep). It doesn't affects the dtm, altough this layer is checked in the dtm's setup. When I want to update the dtm it freezes. I also made a second easy dtm just to check (layer dtm próba), it consists only 4 stakes. The same happens. Does Anyone have any idea why this happens ? AN1 finomterep geolocated v2024.vwx -
It works like a charm! Really, really thank you for you kind help! Maybe I should give some time for learning scripting... Have a nice day, Zsombor
-
Dear @Pat Stanford, I really apprepriate your kindness, and help! Awesome! It Works! Only one more question: If I undestood your instructions well, it finds always the matching text for the one selected cell. Would it be maybe possible to ask the script to run trough all the cells and give all the matches to the selection? (Just like I would use the shift button during selecting them manually). Or is this operation not possible? Thank you, Zsombor
-
I see! In this case could you please help me with this? I have a list of codes (numbers and letters) in worksheet cells (only A column). I also have texts on a layer and I want to find the matching ones with my worksheet cells. (these are buliding site ID codes). Of course I could do that each by each with finding text command, but I gave it a try with AI. But really, only if it makes fun!
-
@Pat Stanford, thank you for your answer. I don't want ask anyone to write me a script. I thought it'll be just a small failure in an easy script like this.
-
I asked AI to write me a script with the function named in the topic. It gave me this, but it doesn't work. I'm an outsider, what do you think, is it a mess or are there just some small bugs in it? PROCEDURE SelectTextObjects; VAR worksheet : HANDLE; num_rows : INTEGER; row : INTEGER; cell_data : STRING; text_objects : ARRAY[1..1000] OF HANDLE; i : INTEGER; BEGIN { Get the active worksheet } worksheet := GetWSByName('hrsz'); { Get the number of rows in column A of the worksheet } num_rows := GetWSCellNumRows(worksheet, 1); { Loop through each row in column A of the worksheet } FOR row := 1 TO num_rows DO BEGIN { Get the data in the current row of column A } cell_data := GetWSCellFormulaN(worksheet, 1, row); { Find text objects that match the data in the current row of column A } text_objects := FindText(cell_data); { Select the text objects that match the data in the current row of column A } FOR i := 1 TO Count(text_objects) DO BEGIN SetSelect(text_objects[i], TRUE); END; END; END; Run(SelectTextObjects);
-
@Tom W. I see, I really appreriate your help with this detailed description!
-
@Tom W. @JuanP, @Pat Stanford, Thank you for your answers, now I can understand it better! To summarise it, I just want to know which workflow is better in your opinion: Workflow1: First locate the site I have to work with, and also adjust the internal origin with the geolocate tool. I put the user origin to the same spot, but when I have to export a georeferenced DWG, I put it permanently to the 0,0 point of the projection system. Workflow2: I don't use the geolocate tool, I move only the user origin close to the site.
-
Hello, I'm confused about internal and user origins, could you please help me with this? First I thought that internal origin can't be moved, it's always at the zero point of the projection system. But we also have a user origin which one can be move to anywhere, so vectorworks can calculate with low coordinates. Now I know tha internal origin can also be moved with geolocate tool. My questions: 1. If I can move the internal origin next to the site, what is the meaning of the user origin? 2. After moving the internal origin close to the site, I could still import a georeferenced DWG file to the right place after checking the georeferenced file option in import setup window. Excellent! But why it doesn't work the same way when I want to export a DWG file? I check the georeferenced option, the layers are also georeferenced, but in the exported file I have the coordinates regarding to the close internal origin, instead of the projection systems zero point.
-
Thank you, I could manage it by editing the workspace. Strange that I had to do it manually.
-
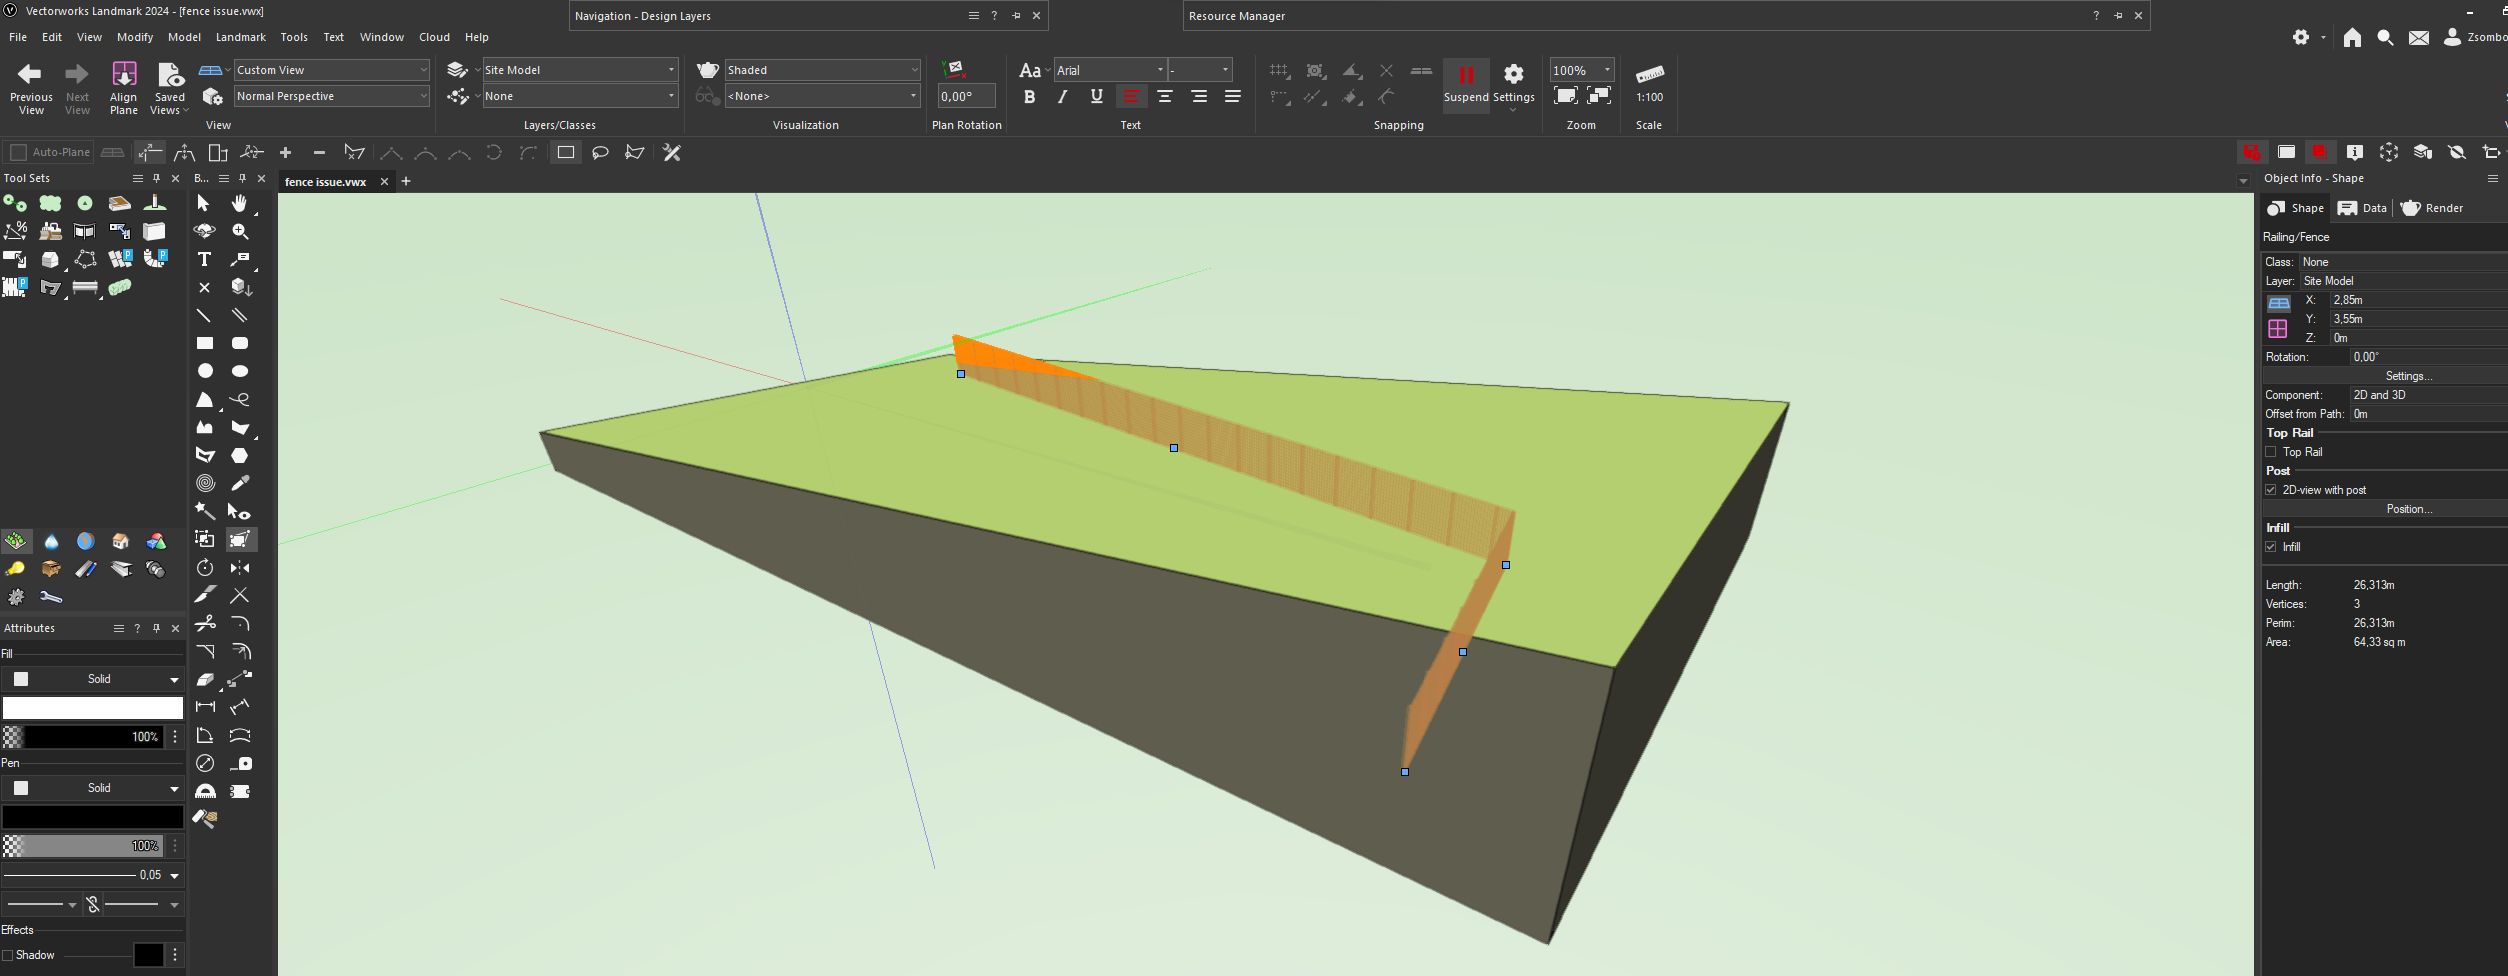
Hello Everyone! Strange: I have only the old possibilities, no new fence features. The fence doesn't follow the surface, and there's no possibility to add gate... Is there some hidden trick I missed? fence issue.vwx

-
Nomad- make it useable for on-site work
Zsombor replied to Zsombor's question in Wishlist - Feature and Content Requests
I haven't found a good one. Have you? -
Nomad- make it useable for on-site work
Zsombor posted a question in Wishlist - Feature and Content Requests
I'd need the ability to use Nomad also for on-site work. I'm a landscape architect so I can't always use my laptop for that. When I have to walk many miles and make notes now I have to work on paper. It could be much easyer with an app which could also use the tablet's GPS for geolocate my position on the plan. Basic editing tools and exiting tree tools would be also great. Thank you! -
Site Model not affected by Site Modifiers Vectorworks 2023
Zsombor replied to TeeMuki's topic in Site Design
I got this message from Tech Support: This issue has been reported as a bug recently and currently being investigated by our engineering team. Here is the bug number for your reference: VB-195594 -
Site Model not affected by Site Modifiers Vectorworks 2023
Zsombor replied to TeeMuki's topic in Site Design
@Katarina Ollikainen, thank you for your help, I spent hours figuring out how to make this feature work. I hope that this will be really rectified, becouse I think it has much more meaning in a 2D layout than in 3D. best regards Zsombor Balogh -
Site Model not affected by Site Modifiers Vectorworks 2023
Zsombor replied to TeeMuki's topic in Site Design
Hello , if I can join this really interesting discussion, I'd have also a site modeling question: There's the opportunity to see cut and fill volumes with different colors in 3D view. It's really nice, but it would be much better to see it also in 2D top view. There's an option in site model settings/ graphic properties/ site analysis for that but I have no idea how to see the result. Could you please help me solving this issue?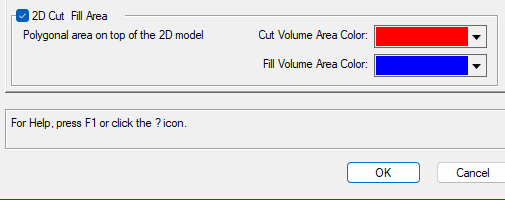
-
Why site model cut and fill appears only in wireframe?
Zsombor replied to Zsombor's question in Troubleshooting
Thank you Jeff! I'll inform you in case I would find some answer for this. Best regards, Zsombor