mdrohn
-
Posts
28 -
Joined
-
Last visited
Content Type
Profiles
Forums
Events
Articles
Marionette
Store
Everything posted by mdrohn
-
With more and more fixture manufacturers making GDTF files available, I frequently have to import several of these when making a new drawing. The current workflow requires multiple steps to import through the File > Import menu, which is quite awkward to navigate since it currently contains 30 options. It would save time and be a lot more convenient if I could simply drag-and-drop onto the application window as can be done with PDF's. For extra credit, allow the user to re-order or hide items on the Import submenu so the more commonly used ones are easier to find. For extra extra credit, allow all valid file types to be imported via drag and drop.
-
When the Windows taskbar is set to auto-hide, it can be revealed by moving the mouse cursor to the bottom edge. VW 2024 however, does not allow this when the application window is in full screen display. VW 2023 and previous versions did not have this bug. Allowing the taskbar to be accessed when the application is full-screen is typical and expected behavior across all Windows applications.
-
Thanks for that explanation, that is very interesting! Having a stand-mounted version and a rigged version is precisely the kind of symbol differentiation that we use, however in our workflow we WANT to see separated counts for both versions in the summary. That really helps us very quickly look at a plot and see how many of each variety we need to order regarding stands, diffusers, specific rigging hardware, and other accessories (before anyone says, there are no existing symbols for many of the accessories we frequently use and in any case, it's much faster and easier to just use the symbol name or model name to indicate what is needed). I can see the merits for being able to count multiple symbols together, but the way my collaborators and I use VW, where we frequently need to generate new lighting symbols quickly, the current implementation opens up a pitfall that results in false information being displayed. I lose a lot of productivity from cleaning up symbols to avoid this issue, because more often than not the other users who make them aren't digging into the LIR to change the data fields to make sure they are unique. Could there perhaps could be an option added to the tool, so the user can choose which kind of counting priority they want? Anyway, even given all the above, it certainly seems like some of the existing count behavior is buggy, particularly when the OIP data for instrument and/or model info doesn't match what is in the symbol LIR (as with the rectangle objects in my demo file).
-
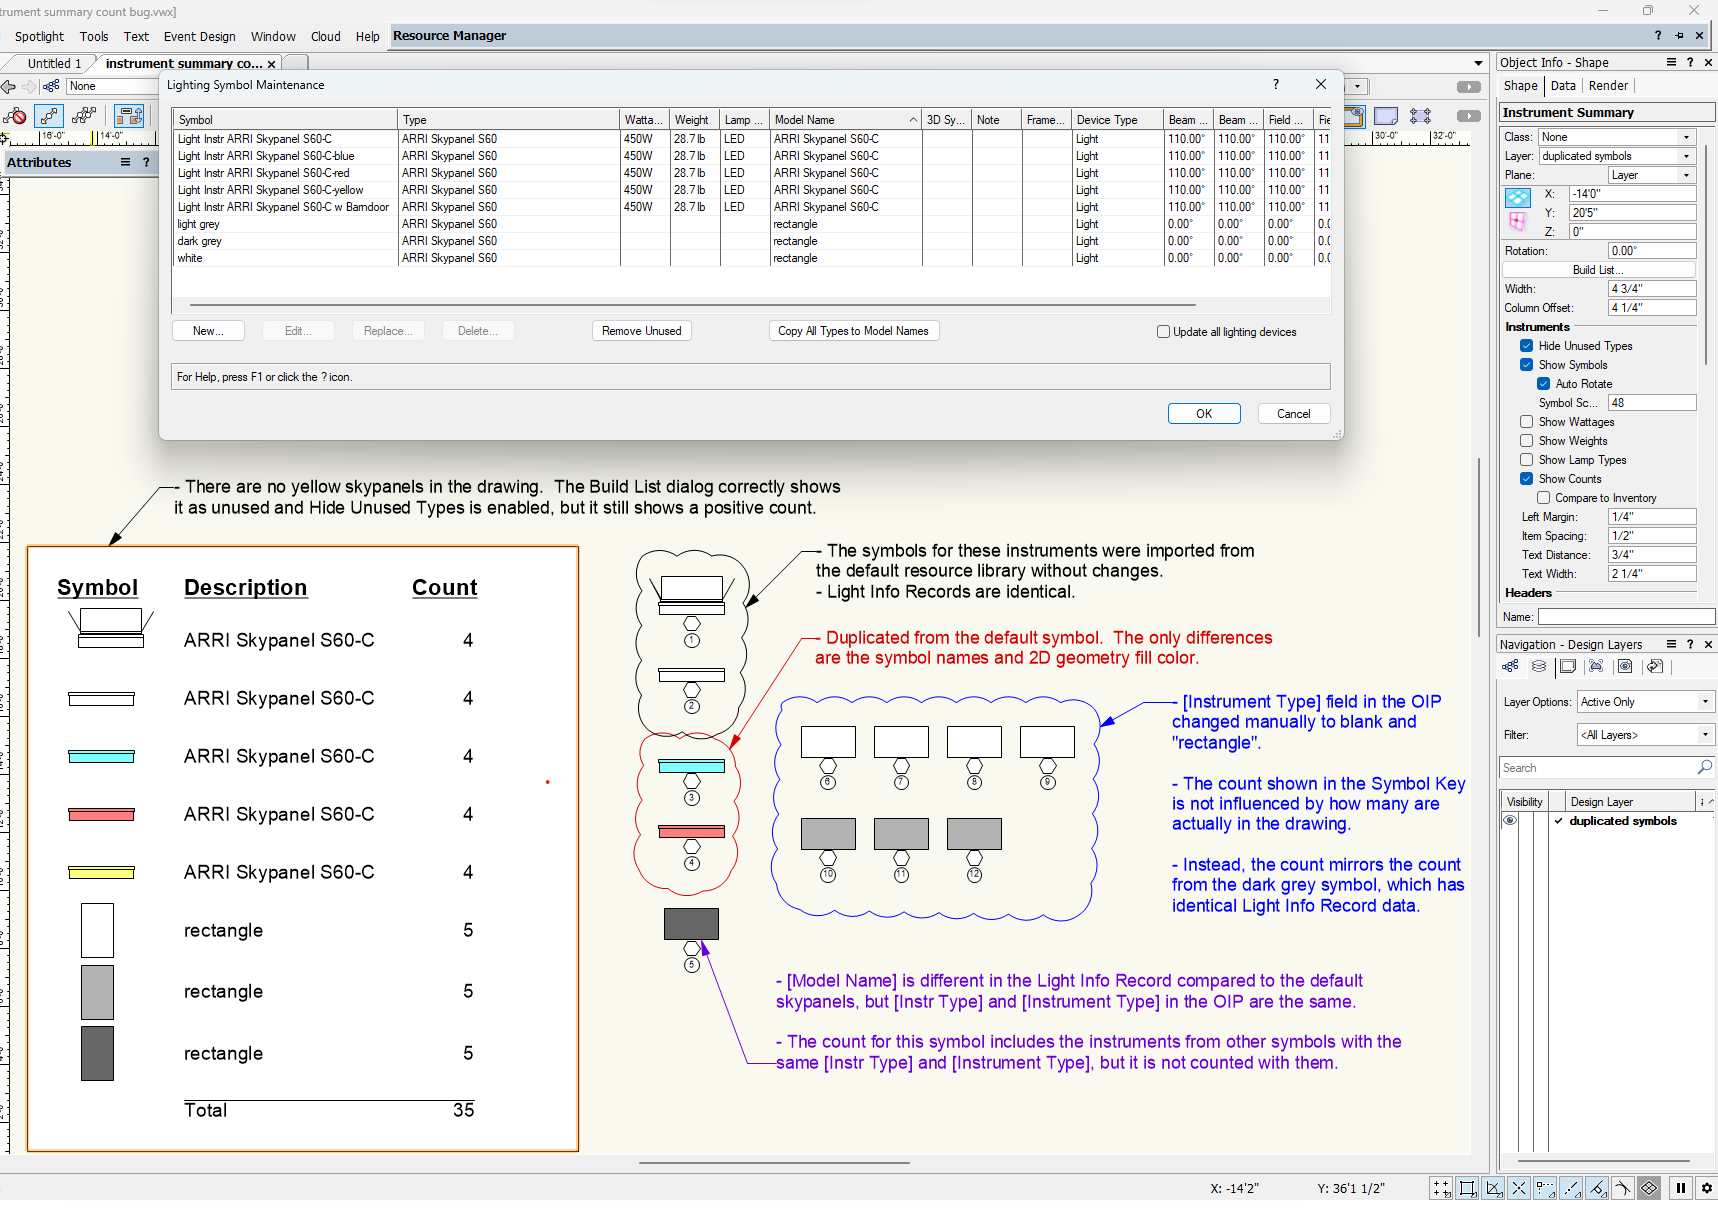
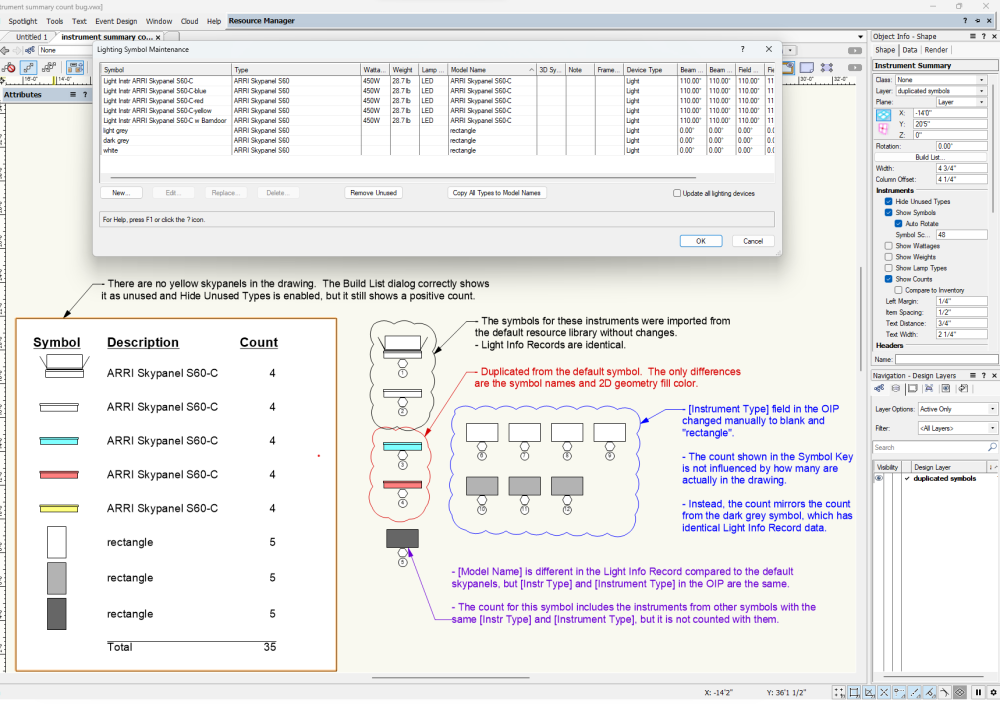
This is an active bug in Spotlight 2023 SP6, but I've seen it for a few years. The attached file and screenshot show what's happening, so I'll try to keep the post itself as short and to the point as I can. Synopsis The Instrument Summary Tool's Show Counts function gives false results when you have multiple lighting device symbols with certain identical data in the Light Info Record (LIR) and OIP. Specifically, the [Inst Type] and [Model Name] fields in the symbol LIR and the [Instrument Type] field in lighting device OIP's are involved. Description As seen in the screenshot, There are 12 instruments in the drawing, but the counts in the Instrument Summary are wrong. The Instrument Summary list is organized by symbol name, with each symbol having a separate line and its own count. The root issue appears to be that symbol name is not the top-most criterion used for counting. This means that instruments generated from different symbols can be counted together on the lines for each separate symbol, multiplying the true number. In the demo drawing, I have four instruments generated from four discrete symbols representing Arri Skypanel S60-C's. The two black and white symbols were imported directly from the resource library, then the red, blue, and yellow versions were created by duplicating the original symbol and changing the 2D geometry color. Because the relevant fields in the LIR's are identical, they all get counted under each symbol. Note in particular that the yellow symbol is not even present in the drawing, but still shows the count for the other four due to the bug. It's worth pointing out that anyone using the two black and white skypanel symbols taken from the VW resource library will encounter this bug without having made any customizations. There are other examples in the resource library of sets of symbols with identical LIR's which will cause this bug out of the box. I created the bottom three rectangle symbols in the Instrument Summary from simple 2D geometry which I turned into a symbol, attached the LIR and copied the [Inst Type] field from the skypanel symbols, then duplicated. I included the Lighting Symbol Maintenance dialog in the screenshot to show the LIR values of the various symbols. The counting bug takes on different behaviors depending on which of the data fields match and which don't, as noted in the screenshot. The bug variations for the rectangle symbol counts come from the [Instrument Type] in the OIPs being different from [Inst Type] in the LIRs, whereas they are the same for the skypanel symbols. For the dark grey rectangle devices, the OIP [Instrument Type] matches the skypanel device OIP's, and for the white and light grey rectangles it is different. Comments FWIW I have encountered this bug numerous times through sharing files and collaborating with other users on film set lighting plots. As a team, we frequently create customized variations of the resource manager lighting device symbols, most commonly to represent instruments which are not in the resource manager, or for different accessory buildouts. It is quite easy to duplicate a symbol, tweak the geometry or colors, then begin using it without updating the LIR fields, but it is rather tedious to make sure each symbol variation has unique data in the relevant places to avoid this bug. In my experience many Spotlight users aren't familiar with the finer points of using the Light Info Record in the first place and don't know how to update it. To my mind, the ideal solution would be to fix the count algorithm so it uses symbol name as the first distinguishing criterion, as that would remove the requirement to give each symbol unique data in the LIR and OIP. Thanks as always for all the work the mods and devs put in to keep VW humming. instrument summary count bug.vwx
-
Vectorworks crashes when i copy and paste a lighting instrument
mdrohn replied to Rick van der Heijden's question in Troubleshooting
Hi Rick, It would be helpful to have more detail--is this happening for all lighting instruments, or only a specific one? Is it a customized fixture, or something taken straight from the VW library? Details about your computer specs would also be helpful. And lastly, if you can post the VW file where this is happening, that would be the best way for us to evaluate what's going on. -
I have a suspicion: the edge of a 4K screen is typically 2160 pixels high, and the edge of a 2K screen is typically 1080. In Windows 10 you will only be able to mouse across where the edges of both screens intersect (as determined by the screen layout shown in windows' Display settings). So at a maximum, only 1/2 of the 4K screen will align with the 2K screen, and you won't be able to mouse across where it doesn't. Try mousing over at a different spot, and/or adjust the monitor arrangement. FWIW Windows 11 added a setting to change the behavior for moving between different-size monitors so the mouse can always pass across instead of being blocked.
-
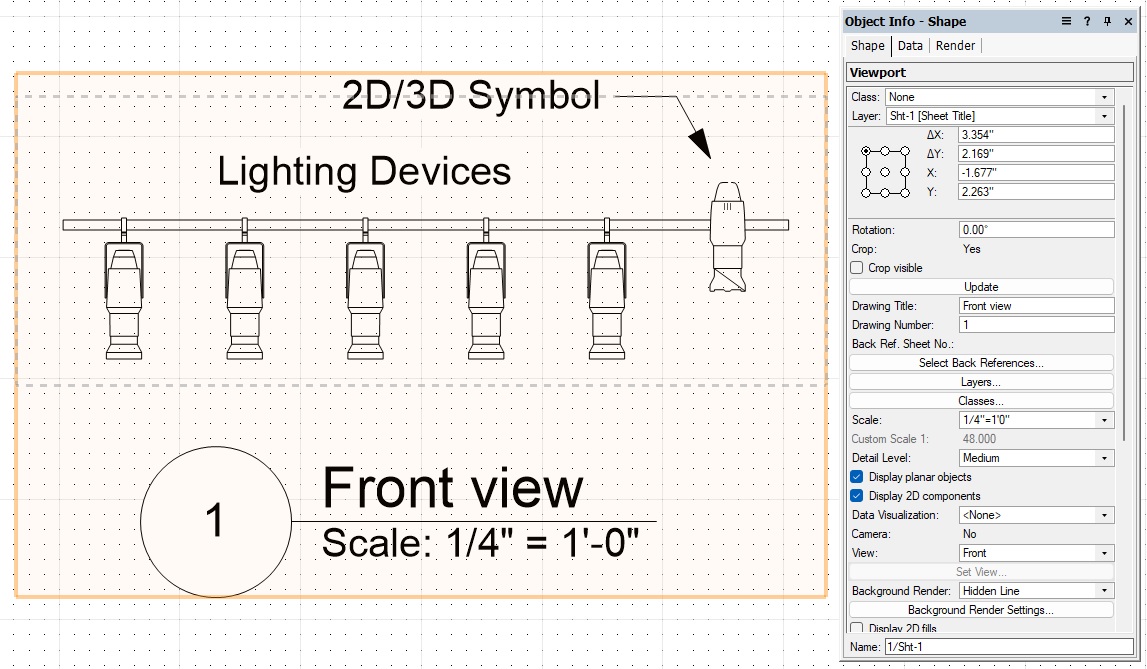
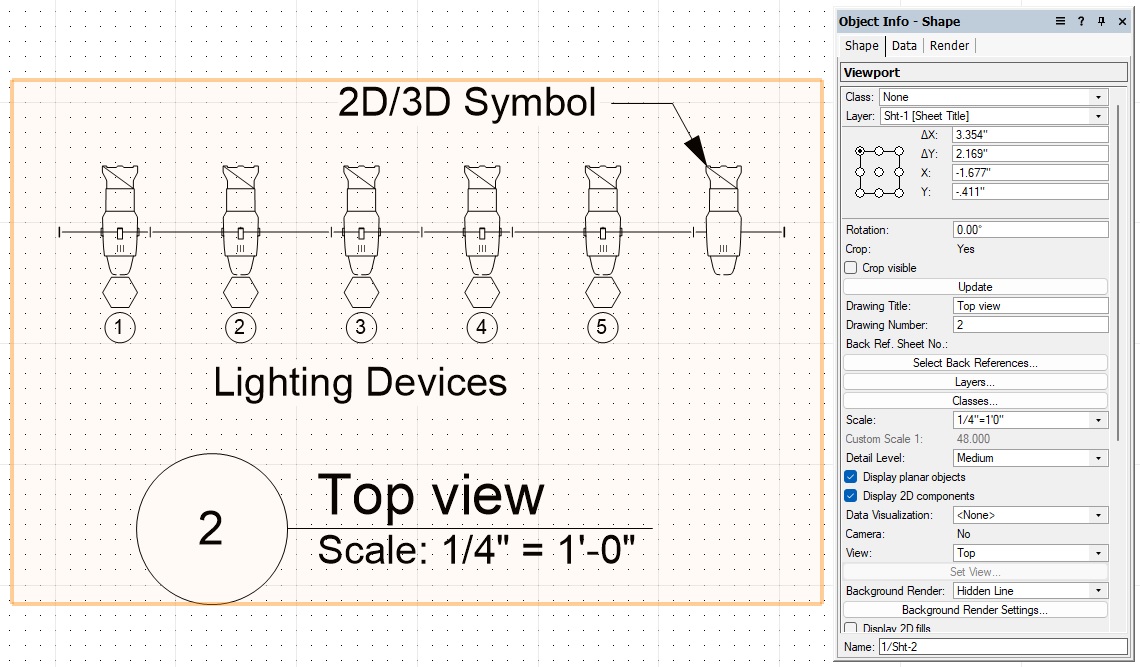
I have defined the Front 2D symbol component for the lighting device symbol shown in the drawing, but that 2D component is not displayed in a hidden line viewport in Front view The first image shows five lighting device objects and the 2D/3D symbol from which they were generated, in a hidden-line viewport which has "display 2D components" enabled. The base symbol correctly shows the 2D Front geometry but the lighting device objects do not. The second image shows the same objects with the viewport set for Top view. Note that the 2D symbol Top geometry is displayed, but the 3D geometry is also still visible. The expected behavior is that the 2D symbol geometry will override in all views and the 3D geometry will be suppressed, for both the lighting device objects and the symbol. VW 2023 SP2 1209998927_viewport2Dgeometrybug.vwx


-
Label Legend Not Behaving as Expected
mdrohn replied to SharpToShutter's question in Troubleshooting
The internal geometry of the 2D symbols for the container shapes (circle, triangle, hexagon) somehow got moved off the origin point. You have to edit the individual 2D geometries to correct it (the symbols are in the resource manager in the "containers" folder). edit: what markdd said 🙂 -
These bugs are still active in SP5, including the one referenced in my previous post that I thought was fixed
-
@aboultin While we're here, could you look at another old bug report I submitted in January? That one hasn't been acknowledged yet, and I just checked and the bugs are still active in SP5--I just want to make sure it's on the radar.
-
Thanks Adria, glad it's getting attention
-
Bug is still active in SP4
-
Bump - this bug is unresolved and still active in 2022 SP 3.1.
-
Yes, in December
-
This bug is unchanged in SP3
-
FWIW these bugs are mostly unchanged in SP3, except perhaps the one regarding text object color on the design layer not being restored after toggling BW display mode (this one appears fixed)
-
[major bug] [2022 SP2] [Spotlight] Label Legends are broken by SP2
mdrohn replied to mdrohn's question in Troubleshooting
@mjm I'm in motion pictures so the range of info needed and use the plot is being put to is probably off kilter from how a lot of the Spotlight tools were intended. We use the top plan both to guide the rig and to generate a pdf map for the gaffer to reference on an ipad while lighting. The only info we really need on the plot by each fixture is channel and universe/address, and the exact placements and styles of the labels are chosen to avoid crowding and maximize clarity and readability. I almost never use fixture-specific label legends, and typically tweak the label positions anyway. It's always mostly about the desired text style and whether DMX info is included or not. -
[major bug] [2022 SP2] [Spotlight] Label Legends are broken by SP2
mdrohn replied to mdrohn's question in Troubleshooting
This is fixed in SP 2.1 🙂 -
Screen plane has been deprecated in VW 2022, but you can enable it as a legacy feature: Document Prefs > Legacy 2D tab
-
2022: How is this possible? Two objects both show y = 0'0"
mdrohn replied to mjm's question in Troubleshooting
The line is at a small angle, which is making the end points offset slightly. Select the line, make sure the center control point is active, and change the angle to 0. Then everything lines up. -
I'm trying to make everything shown in a sheet layer viewport appear black and white (ideally grayscale), but I can't get it to work. My typical workflow starts from imported PDFs of set construction floor plans, which I use as the bottom layer for lighting plots. The PDF's are created by another department and often contain a lot of color coding which is useful for their intended purpose, but undesirable for mine. What I want is to make the PDFs display in grayscale so the information is retained, but doesn't compete with the lighting plot colors. It would be great if I could set the PDF to display in grayscale as an option in the OIP, but I will settle for being able to do so within a viewport on a sheet layer. Intuitively, I expected the "Black and White Only" setting in the viewport advanced properties to do just that, make the viewport black and white only, but it doesn't work on PDFs (or at all on Shaded or Renderworks renders; see attached demonstration file and video). What is strange, and makes me think a bug may be in play, is that with B&W Only checked, PDFs shown in a sheet layer viewport are in fact displayed in grayscale while the screen is being panned or zoomed. As soon as the screen view comes to rest however, the PDFs return to displaying in color. When B&W Only isn't checked, PDFs are shown in color during screen view movement. So it seems clear that setting does in fact toggle whether it is displayed in color or b&w; unfortunately not in a way that can be constructively used. The attached video shows this dynamic in action. Is this WAD (which would seem very strange), a bug, or am I missing some other setting somewhere? While experimenting with this issue, I also noticed a few other odd behaviors: - Wireframe renders of text objects do not obey the "Adjust Flipped Text" setting -- but similarly to the above, they do obey it while the screen view is changing, then return to the un-adjusted flip. - Viewports also show the same "only while the view is changing" display behavior if Document Preferences > Black and White Only is enabled. There are some further inconsistent and unintuitive results in how sheet layer viewports show BW or color in various render styles when this setting is enabled. - Viewports do not consistently flag for update when BW settings are toggled. - Text object did not restore its pen color when Document-level B&W is toggled, and a viewport which shows the object is updated to show the change from color to b&w (as loosely demonstrated in the video). viewport BW.mp4 viewport bw.vwx
- 8 replies
-
- 1
-

-
- sheet layer viewport
- viewport properties
- (and 3 more)
-
Using the 2D polygon tool in Inner Boundary Mode (paint bucket) on geometry within a viewport annotation layer produces faulty and unexpected results. The bug is such that the tool cannot be used properly in that situation without performing several extra steps. I originally encountered this bug while working through the VW Intermediate Concepts Course video on Viewport Annotations. The bug can be easily reproduced by following that video using the course progression file #15, which is provided at the top of that course (I am attaching a smaller and simpler file for demonstration below, and a video showing the bug in action). The videos for that course were produced using VW2019, but using VW2022, the demonstrated workflow produces the bugs described here. I tested on two separate 2022 installations and the behavior was the same on both machines (both Win 10). The bug did not occur using VW 2020. Here are the steps to reproduce using the demonstration file below: 1) On sheet layer 1, edit annotations on the viewport (the bug is more easily observed when the viewport is positioned away from the origin point). 2) With nothing selected, set the fill in the attributes palette to a hatch or tile. Most aspects of the bug occur with any fill type, but there are additional elements with those fills. 3) Activate the 2D Polygon tool with Inner Boundary Mode active (paint bucket). 4) Click inside the various faces of the viewport geometry to trigger the bug. Two different groups of buggy behaviors will result: A) Some of the polygons are created in the wrong position (at a further offset related to the offset of the viewport render geometry's origin from the sheet layer origin). These objects are otherwise normal, except when created with a gradient fill, which does not display correctly. B) Some of the polygons are created at the expected position, but display most fill types incorrectly, and cannot be moved by many of the normal methods. The type B polygon instances cannot be moved by dragging, entering XY values manually, or via the move command. Recreating them via Copy or Cut and then Paste converts them to properly functioning objects. Whether a given polygon is type A or B changes depending on the order in which they are created, so clicking on the facets of the viewport geometry in a different order can result in different bug types being produced for a given facet. The attached file and video demonstrate the bug in action. 2D poly tool - annotation layer bug.mp4 2d poly - viewport bug.vwx
-
[major bug] [2022 SP2] [Spotlight] Label Legends are broken by SP2
mdrohn replied to mdrohn's question in Troubleshooting
That is very illuminating, thank you. My typical workflow is to use the same label legends on multiple different fixture types, and having no symbol in the 2D label layout is an intuitive visual indicator to me that it's a multi-purpose label. -
[major bug] [2022 SP2] [Spotlight] Label Legends are broken by SP2
mdrohn replied to mdrohn's question in Troubleshooting
Thanks Kevin, I appreciate the response and attention to the issue. For what it's worth, I very much like the ability to have generic labels which are not associated with any particular symbol, and use that capability quite a lot. If the fix requires including a default symbol, can it just be a locus? -
[major bug] [2022 SP2] [Spotlight] Label Legends are broken by SP2
mdrohn replied to mdrohn's question in Troubleshooting
I've revised the post to show more specific conditions that trigger the bug, and attached a demonstration file