


JennaFoxley
-
Posts
11 -
Joined
-
Last visited
Content Type
Profiles
Forums
Events
Articles
Marionette
Store
Posts posted by JennaFoxley
-
-
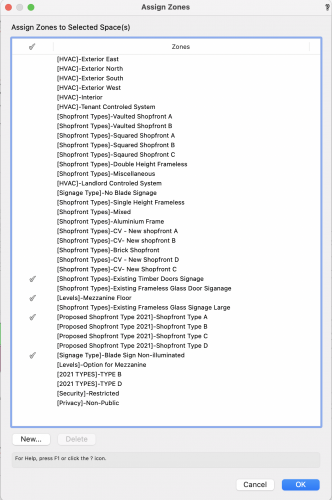
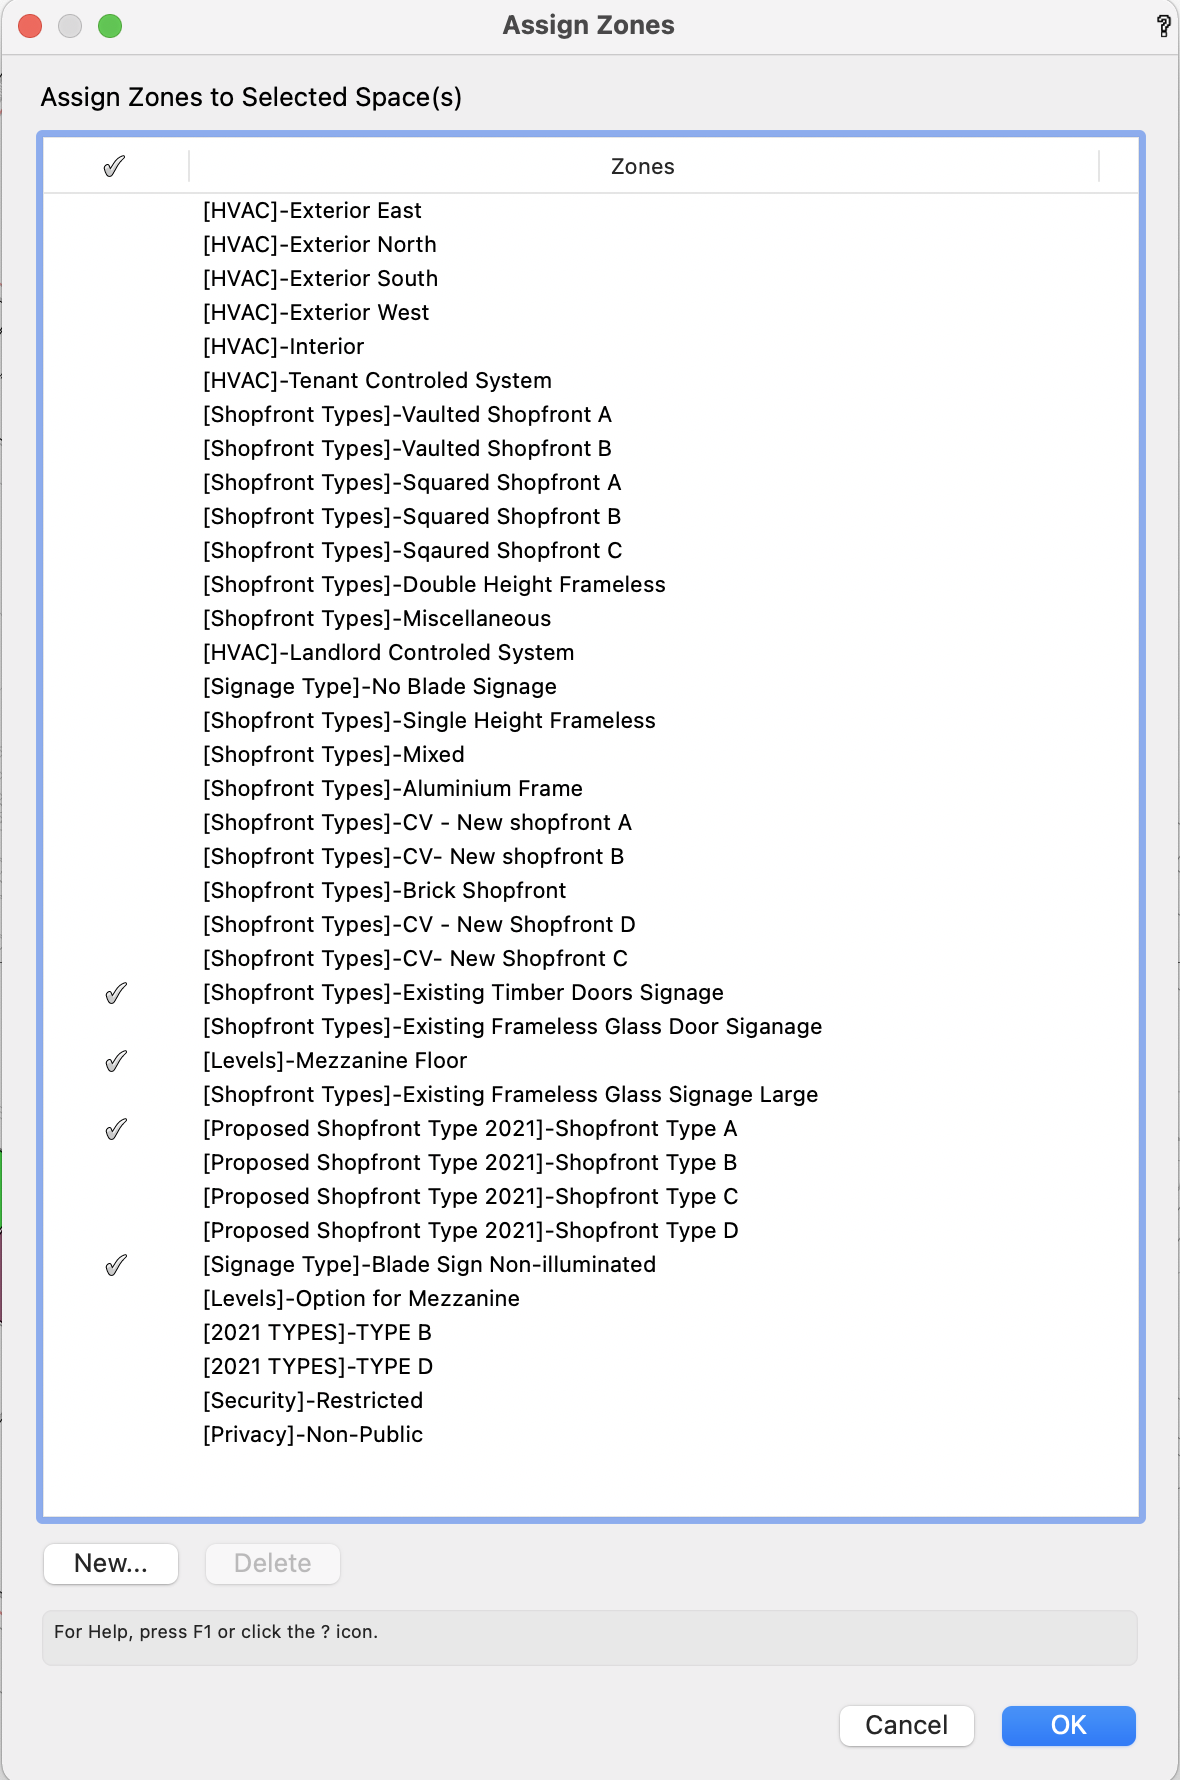
So in order to have data visualization colour all the units in they have to have the same amount of zones ticked. This doesn't really work when i tick the assigned zones for which units have a mezzanine floor because then they have one extra zone ticked and won't appear in the same list. Do you think it would be better to call off the shopfront types etc in additional data rather than zones?
-
@Tom W. Oooh i think you've cracked it!! It has just changed colour. Amazing thank you, this has been really bugging me.😅
-
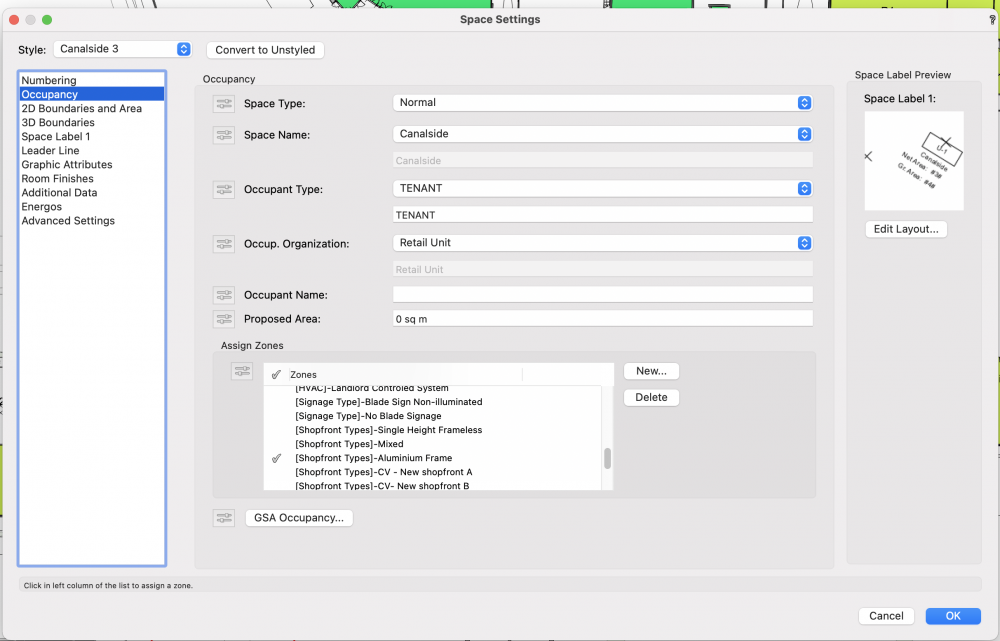
I've used the same style for every unit so they should be the same. I've attached a screenshot of my zone settings. It's odd how they all have the same style but the data visualization only picks some of them up.
-
How can you tell what assigned zone it's in? I'm not sure, but i know the other yellow shops have the same shopfront type ticked so i presumed it should do the same thing. @Tom W.
-
Thanks for your help, yes i have also tried assigning them through the settings it still seems to not pick it up.
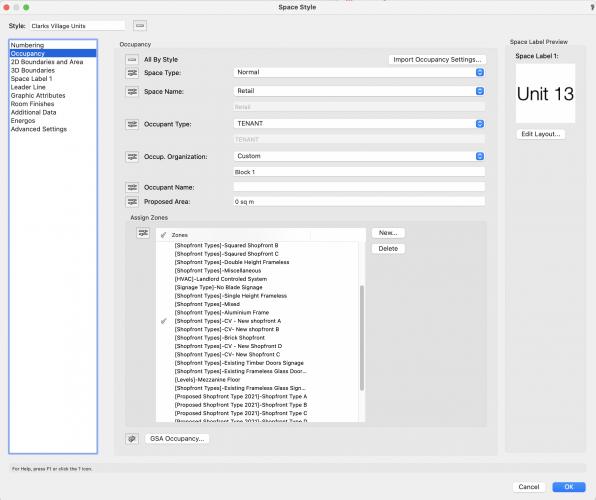
We want to add multiple data to each space, for example in this case i want to tell the space it'll have a certain type of new proposed shopfront but i want to call off what it has now as existing too.
Do you know how you can control where the assigned zones go to? I cant seem to figure out how they end up in ' Assigned zone 1 etc.'
-
I've attached a few screenshots below.
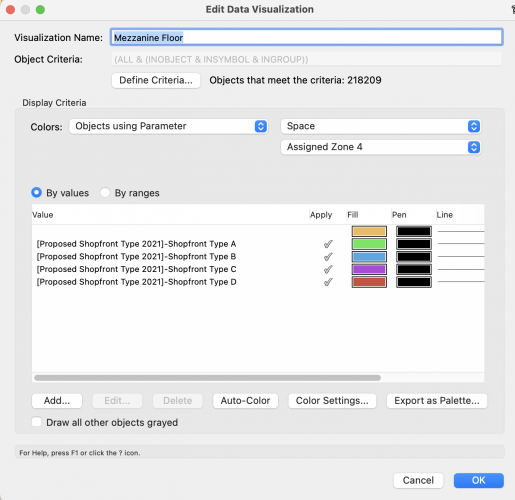
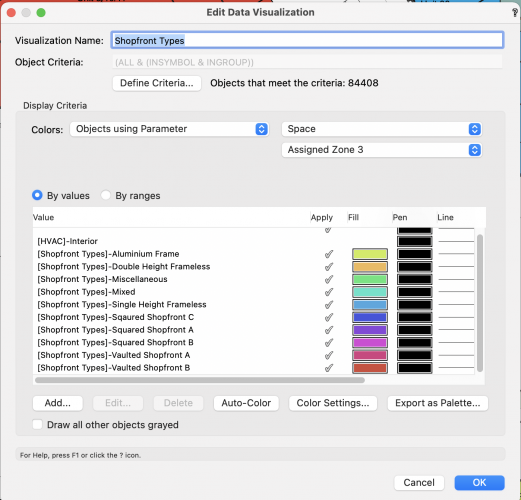
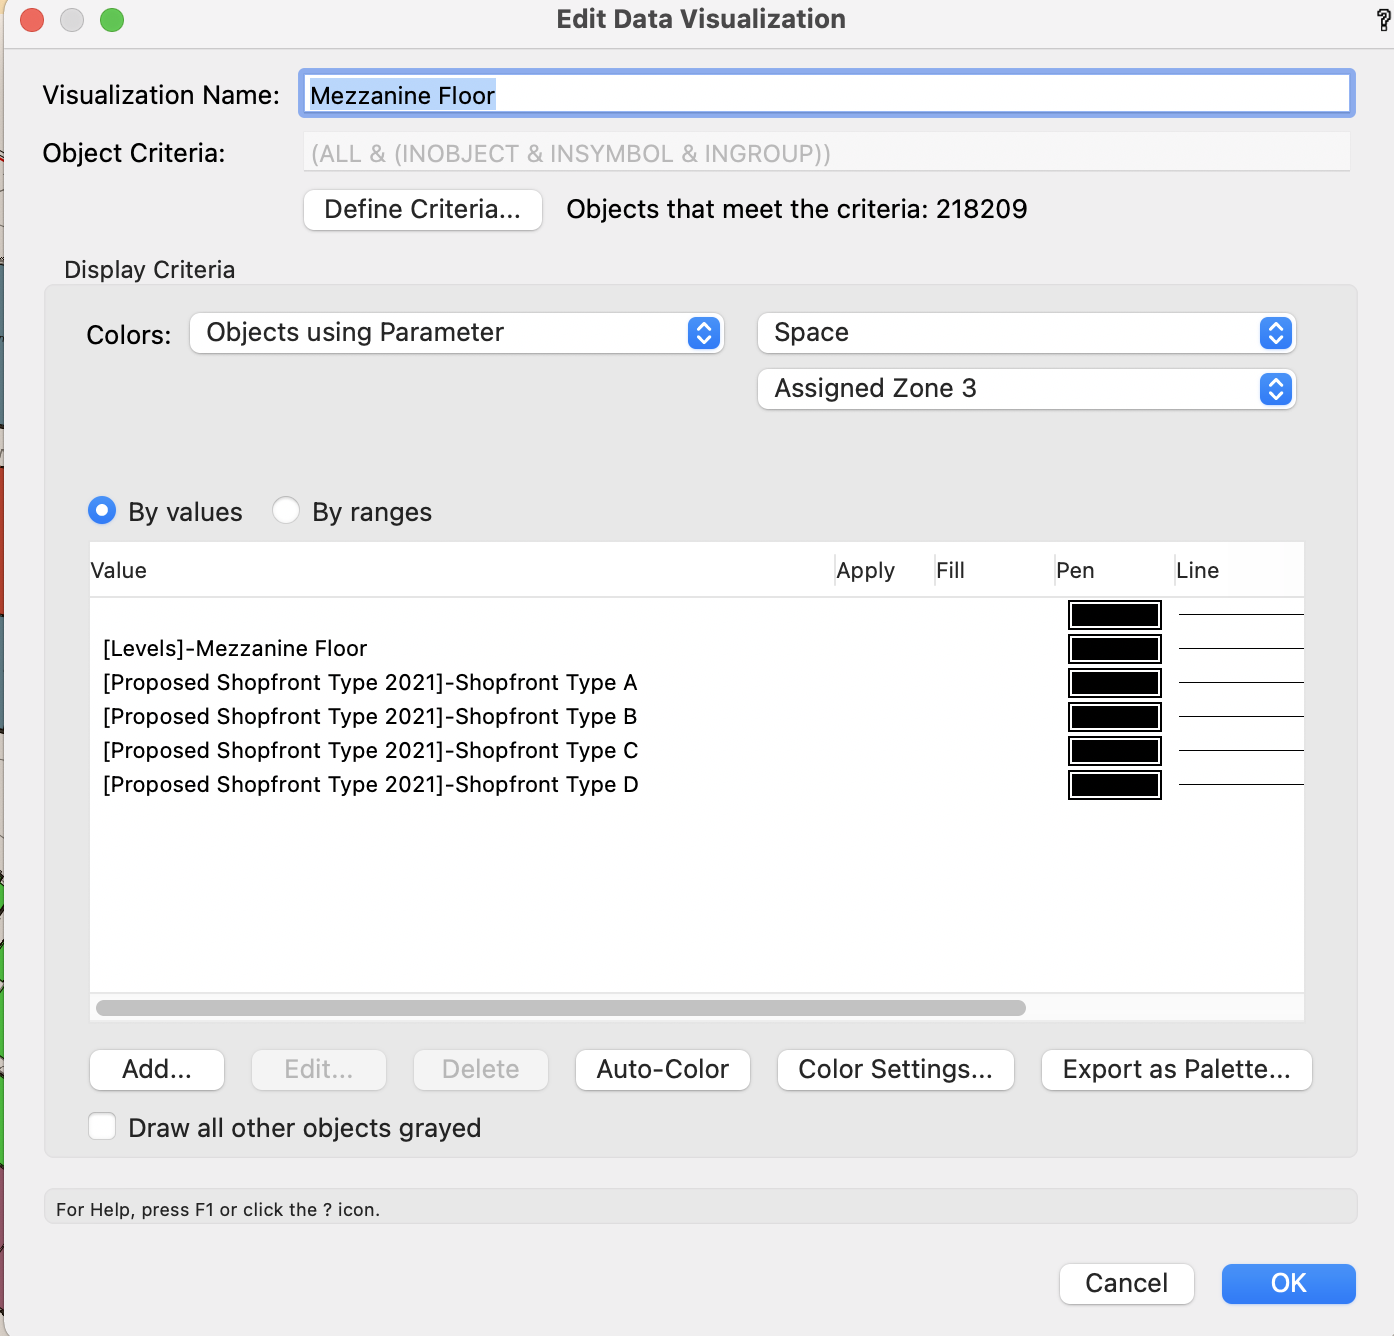
It looks like my 'Proposed shopfront types 2021' zones have gone into multiple assigned zones, as theyre in both |Assigned zone 4 and Assigned zone 3. But i'm not sure where you can control what assigned zones they go into.
When i apply the data visualisation from 'Assigned Zone 4' it only highlights some of the spaces and not all of them even though they have the same zones ticked.

-
Hi everyone,
I've drawn several spaces using the spaces tool and assigned zones to them, but when i run my data visualization its only colouring in some of them. Can anyone think why this is? Also is there a way to edit already assigned zones.
Can't seem to find much on this subject matter
-
Yes sorry, Ive attached some screenshots for more context.
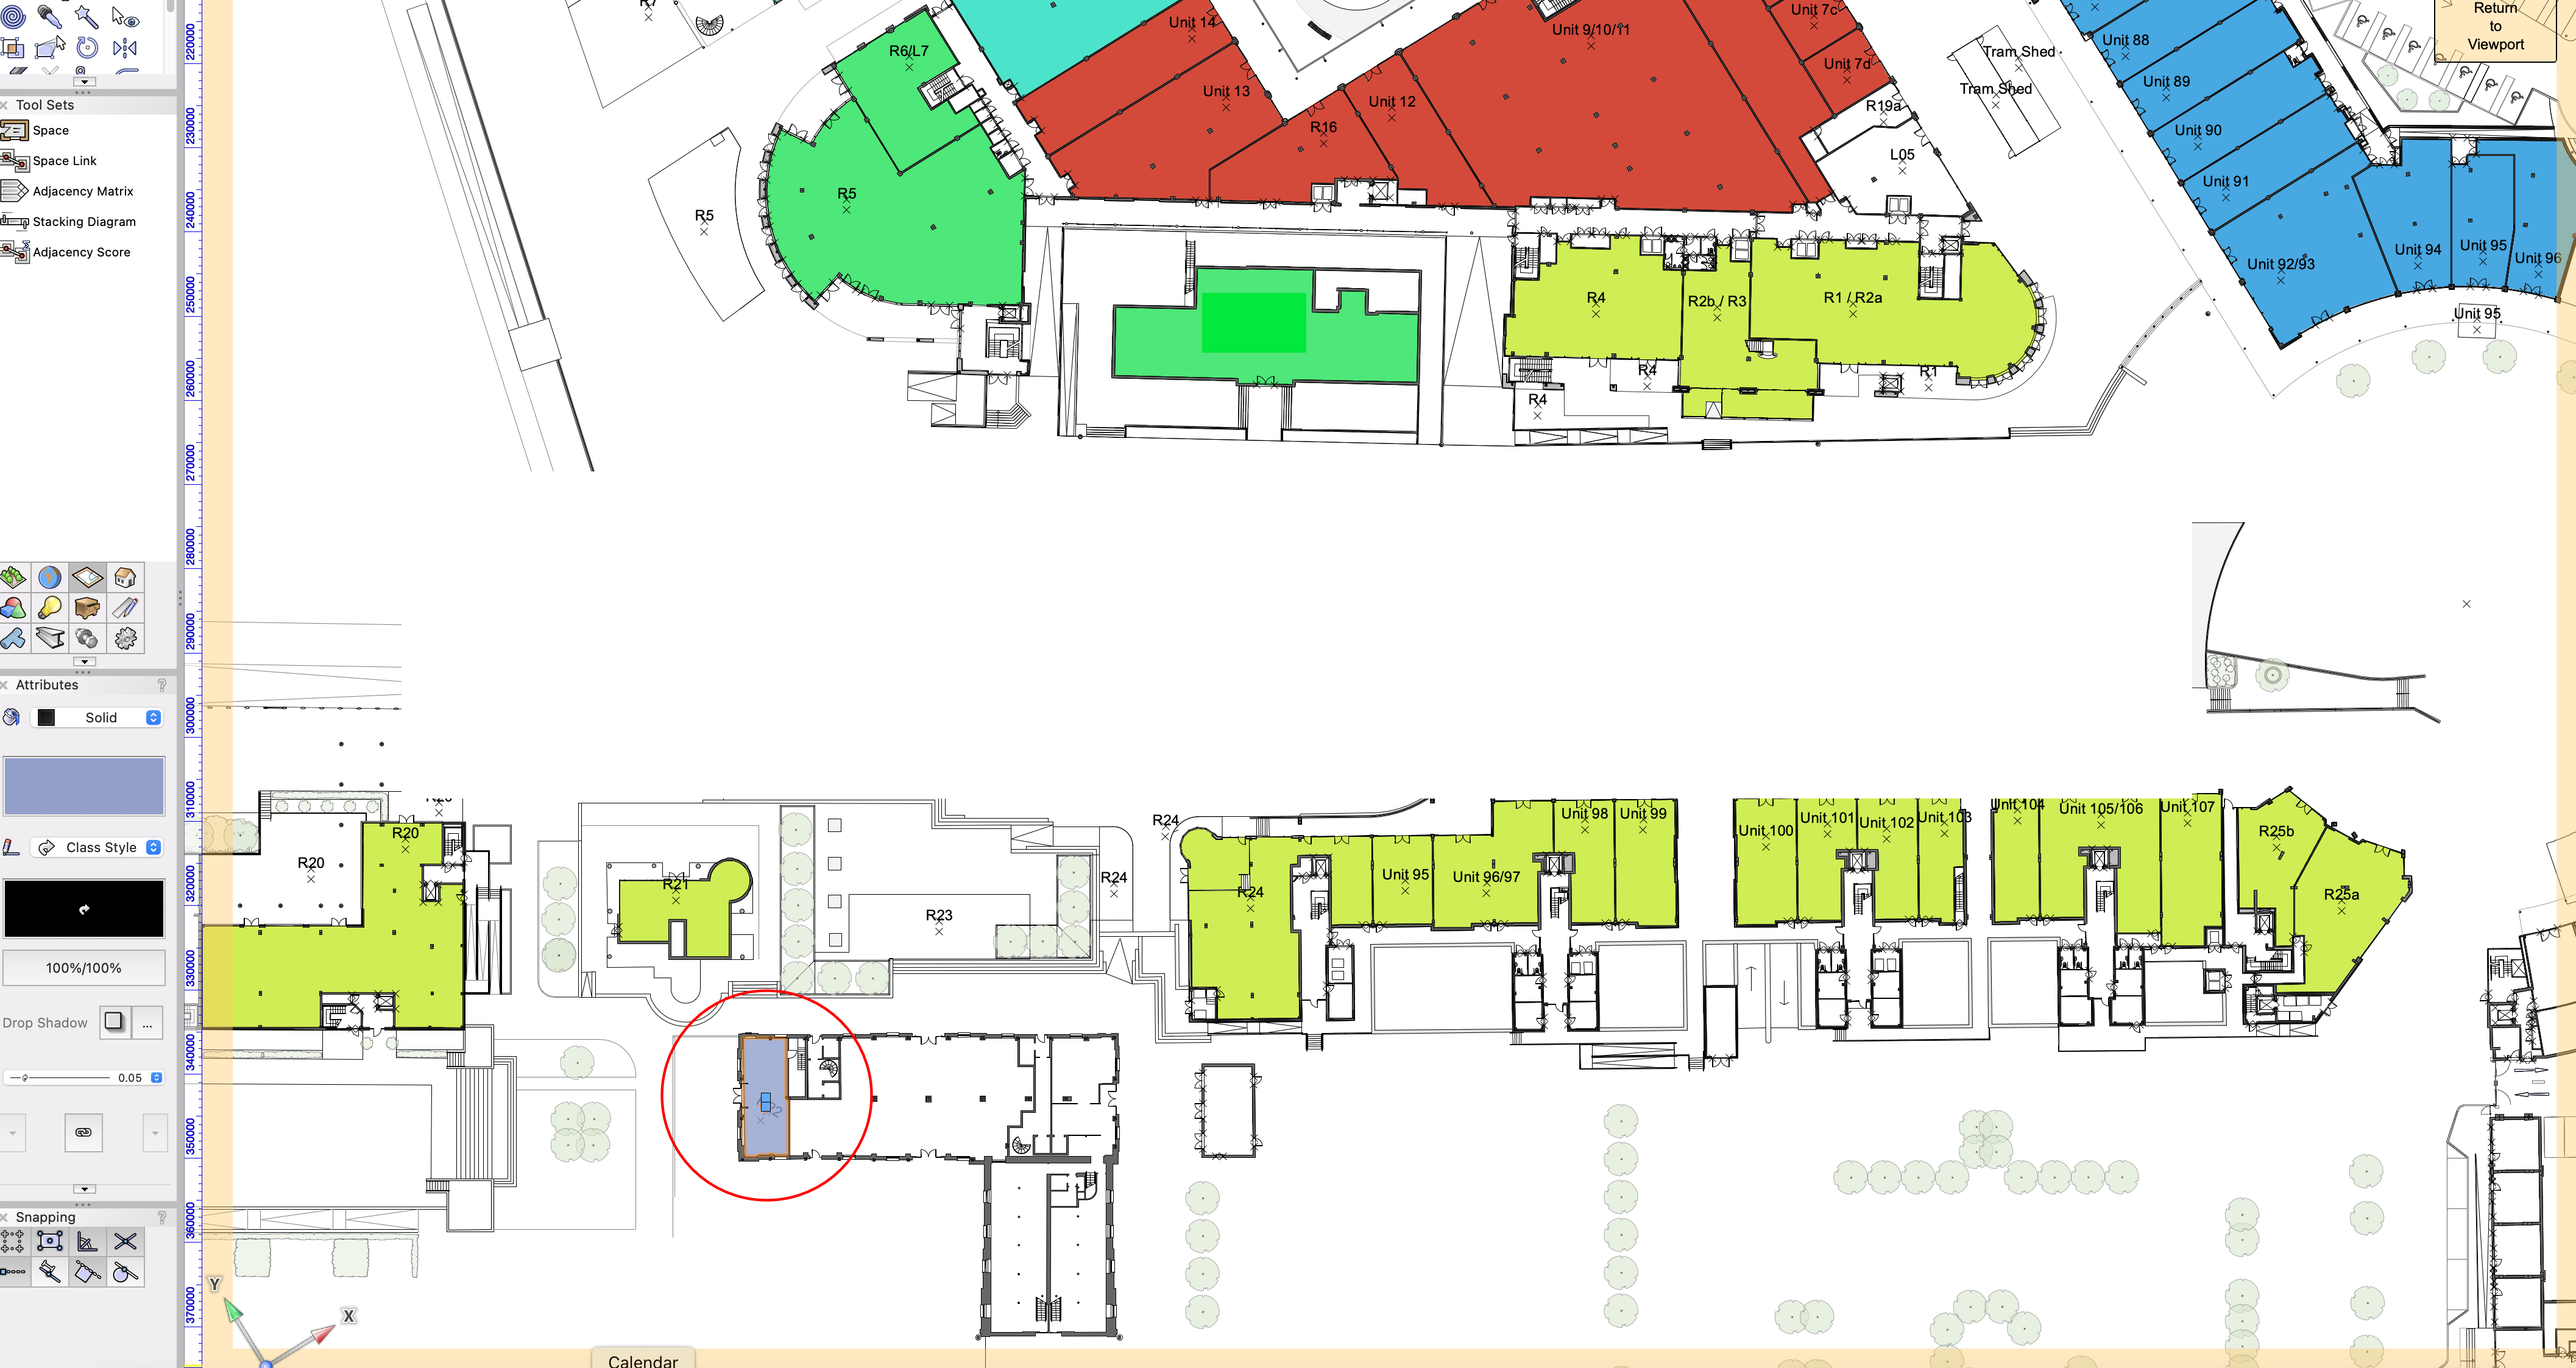
The unit i'm trying to add in is the 'R22' unit circled in red. I've drawn over it with the space tool and used the same style as the other units but for some reason the data visualization won't colour it in and it just stays in the fill colour it was given when drawn (See attributes tab). For that particular unit i've said it has a aluminium shopfront (In the assigned zones) so with the data visualization it should be showing the lime green colour the same as units 95/96/98 etc.
Has anyone got any thoughts on why it's not picking it up? The settings all look the same so i'm stuck.

-
Hi everyone,
Wondering if anyone can help me in regards to putting restrictions on DWG exports. We regularly have to send DWG's of our drawings to various different consultants and usually we just delete out the stuff we don't want to give out but i just wondered if there was a smarter way of doing this.
For a bit more context, I've spent the past lockdown drawing over every unit in a retail plan using the space tool so i could input all the data needed for each space so we can just pull out the information when we need it. But I'm just not sure on how i would then just send the information of one unit to a consultant (in DWG format) which wouldn't include all the other information on the other units.
I'm currently looking into project sharing but so far i've seen that only works when you're all working on vectorworks which often the consultants we work with aren't.
Any advice would be helpful! 🙂
-
A Colleague previously used the space tool to create spaces for all the unit areas on a retail plan so we could pull out the different areas etc. We also use it alongside data visualization so we can visually see on a plan what retail units have a projecting sign etc. I'm trying to add a unit by drawing over it with the space tool and i have used the same style as the other units but when i add my data visualization it doesn't fill it with a colour. I have made sure there is a fill colour in the attributes tab when i draw the space and the settings look the same as the other units so i can't figure out why the data visualization isn't picking up this particular space.


Export as DWG - Sheet layer only
in General Discussion
Posted
Is there a way to only export the sheet layer to DWG. We have to often send DWG's to other people involved in the project but don't want to give them all the information on the design layers.