


Pat Stanford
-
Posts
12,615 -
Joined
-
Last visited
Content Type
Profiles
Forums
Events
Articles
Marionette
Store
Posts posted by Pat Stanford
-
-
If you can share the script someone will be glad to look at it. I will when I can, but I am leaving on a trip later today.
-
The FillBack, FillFore, etc. are setting the defaults for the document. Any new object drawn will use those attributes.
It sounds like you actually want to set all of the attributes to be ByClass so that when you change the class of the object the attributes will change also.
Check out the SetLSByClass (and all of the other ByClass functions) to set the attributes by class. If you use the offline function reference, you have the option to "View By Class" at the upper left. Then check out the section title Object Attributes to see all of the functions that can be used to set object attributes.
The off-line function reference is in the VW application folder VWHelp:Script Reference:ScriptFunctionReference.html
-
I sounds like you want to make sure you have the Allow Numeric Keypad Entry for Instant Data Bar Activation option in the second set of options.
I you don't have this selected, then by default the numeric keypad is used to switch between the standard views. 2/4/6/8/5 Front/Left/Right/Back/Top. 1/3/7/9 Iso views. 0 Top/Plan.
-
For an object that already exists you need to get a handle to the object and use SetClass or SetClassN.
-
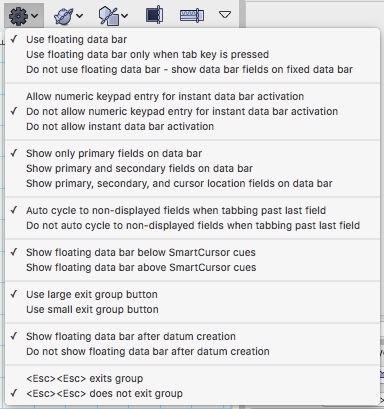
You probably want the first set to be either Use Floating Data Bar or only when tab key is pressed.
Also make sure that one of the top two options in the second set is selected.
-
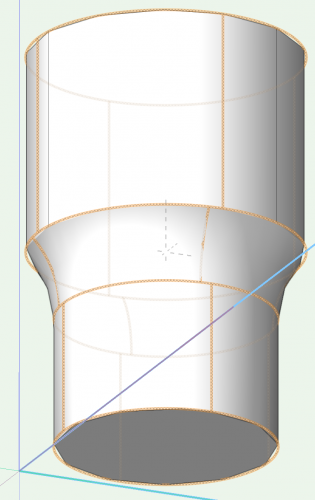
The black holes appear to be a 2018 issue. They do not show in 2020.
You should be able to just Update the viewport and not have to go between render modes. Or maybe since Wireframe is not a render more you do or you won't get the update button. Maybe use Hidden Line instead of wireframe?
Good luck.
-
4 hours ago, line-weight said:
Thanks again for taking the time to do this.
I've looked at the file. Changing the date using your script doesn't change the object visibilities in that viewport, I'm not sure why*
I think I understand the logic though: the script looks at the build and demo date for each object and then sets the other record to 'true' or 'false' according to the requested date.
Then the viewport DV uses that value to decide whether or not to display the object.
This means it wouldn't work if I wanted several viewports, each showing the state of existence at a different date. But I think you are suggesting that this could be dealt with by having a 'true/false' field for each desired year. So the record could have a bunch of true/false fields called "exists in 1955", "exists in 1970", "exists in 1991" etc. And the script would populate some/all/none of those fields as necessary.
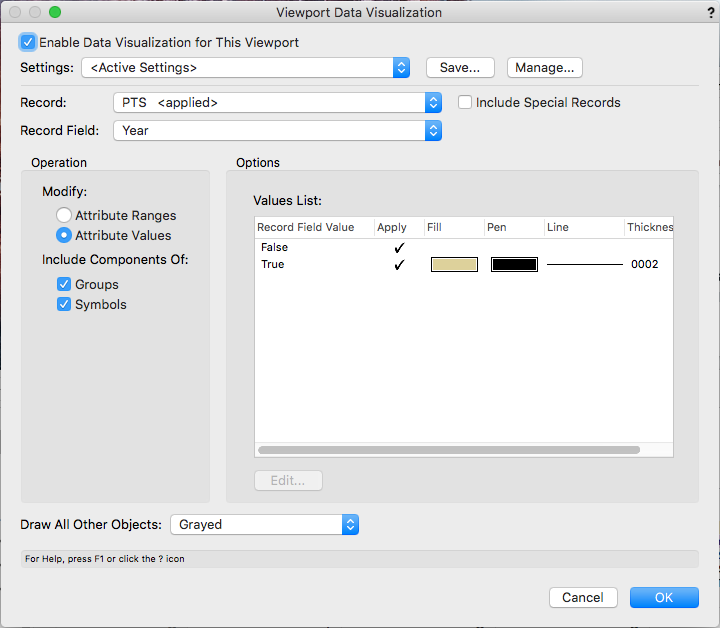
* When I look at the viewport DV settings in your file, for the 'Data Visualisation-4' viewport, I notice:
- 'Enable Data Visualisation for This Viewport' is not ticked (I think it should be?)
- It's set to 'Record Field': Build (I think it should be set to Record Field: Year)
- Under Record Field: Year, in the values list, 'False' is set to show with pen/line thickness (I think it should be set to fill=none and pen=none)
Having changed the above, it still didn't work.
The script does seem to tick/untick the true/false box correctly (when I look at the objects on the design layer), but somehow the DV is not doing what it should.
I have it working here in both 2020 and 2018. Visualization in 2020 has been greatly enhanced, so if you really need to do this, you should at least consider upgrading.
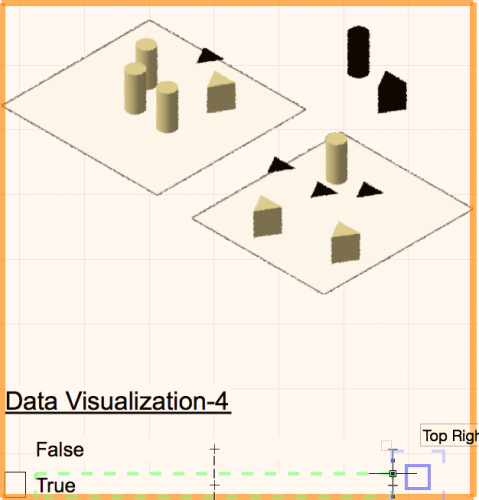
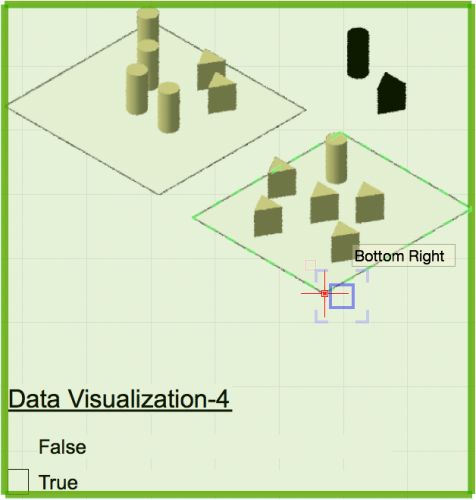
There is a very limited set of dates, so only a few dates will show a difference. I know everything will be visible in 1955, nothing will be visible before 1900 or after 2000, and at least some items will be invisible in 1991.
You are correct. If you need multiple dates we can either modify the script to give you boolean fields for those dates or give you multiple scripts that store the data into different fields that can be used on different viewports.
You are correct that the Enable should be on and the Record Field should be Year. For False the pen and fill should be None. I don't know why it is not working for you. Unless you are using OpenGL where it did not seen to hide objects properly.

Year 1991
Year 1955
-
I am out of ideas. You should probably contact Vectorworks technical support directly. Sorry.
-
Glad it is working for you now.
There is also a similar set of folders under Defaults that contain what shows up as Default Content for a number of tools. That would have been my next suggestion.
You would probably also be better off putting your files into either a Workgroup Folder or your User Folder rather than in the Applications folder. Anything in the Applications folder could go away if VW decides they need to make a change during a service pack installation. If you decide to leave the file in Applications, make sure you have a backup somewhere else just in case.
I don't know of a way to force the title block to match the paper size automatically, but after placement you can change it to an Unstyled title block and set the Title Block Scale Factor to get it to the size you need.
Probably best to create different styles for different paper sizes so that it will always look the same at that paper size.
-
If you are on a Mac it appears you can use Symbolic Links to accomplish this.
A Symbolic Link(SymLink) is like an alias on steroids and basically tells the operating system to treat a single file or directory as if it exists in multiple places.
During my test, I used a SymLink from the Settings:DWG_DXF folder in my Workgroup folder back to the Settings folder in my User folder. Then when I saved a DXF Export Setting file it showed up in my Workgroup folder.
This is a system level function and must be done from the Terminal. Make sure you make a backup before you start playing.
The command I used was:
sudo ln -Ffs Path/to/workgroup/folder/Settings/DWG_DXF Path/to/User/Folder/SettingsThe sudo stands for Super User Do. This will require an administrator password and will allow a function that you do not normally have permission to do to occur.
The command to make the SymLink is ln. The -Ffs are the options. The Fs allow an existing folder to be unlinked and deleted. The s makes a symbolic link and is required if you want to link folders.
After you type in the first part of the command you can drag the folder from a finder window into the terminal window to paste in the two paths.
With the source path on Dropbox or a server, and the destination in the User folder, any saved settings from any user should show up in the Workgroup folder and be accessible by anyone else in the workgroup.
You may want to set up an extra workgroup folder for this kind of saved settings rather than use a single generic workgroup folder for everything.
Sorry it took so long to make time to try this.
-
OK Here is a version very lightly tested in VW2018 SP3. OpenGL rendering does not seem to work properly, but wireframe, hidden line, and Renderworks do.
-
Have you either restarted VW or chosen Refresh Libraries from the gear icon at the top left of the Resource Manager?
Exactly what folder path did you store the file in?
-
 1
1
-
-
One more try.
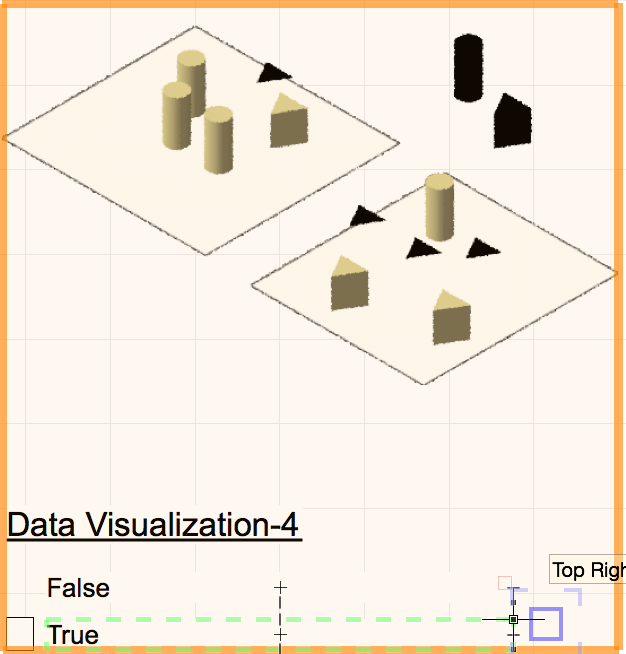
Take a look at the attached file. VW2020.
Run the script named Set Year Boolean. Try a value of 1955. You should be able to update the top right viewport and see all of the "buildings/chairs/etc"
Run the script again and set a year of 1991. You should get a view showing a reduced set of objects.
Some of the objects have a Record ('PTS') attached. The script goes through and sets a boolean field based on buildings that have a built date of before the year you set in the dialog and a demoed date after the year you set in the dialog.
The visualization then sets the Fill and Pen on objects that do not have a TRUE value in the record to None.
The script could be modified in a number of ways to allow for multiple options. Perhaps easiest would be to set a field for each year (or a subset of desired years) and populate that field appropriately.
When you modify dates or add buildings you would have to rerun the script, but it should not effect the visualization in any other way.
-
9 hours ago, line-weight said:
I think that having saved views set up could potentially work, if those visibility settings could flow through to a sheet layer viewport, although I don't really see how that could happen. A downside of this approach is (I think)that I'd have to re-perform the custom selection process, and redefine the relevant saved views, each time I added a new object to the model.
Yes that's a good idea, a way to get around the limited filtering abilities of DV. I think this could work well, as long as the method of setting line/fill to none doesn't have any unexpected side effects.
Never mind. My idea of using Custom Visibility does not appear to work. The objects hidden on the design layer show in the viewport.
So we are back to using Data Visualization. 😞
So again, do you have a limited set of dates that you need? Or is this a dynamic situation where you could need to generate any date at any time?
-
8 hours ago, line-weight said:
Would it be feasible to create a script that could interpret a class name, and then use it to apply visibility settings to a viewport?
So for example if the class name is 1870-2004 (or some other standardised naming), the script can take the requested view date (let's say it's 1950), find whether it is between 1870 and 2004, and if so, set that class to be visible in a selected viewport?
This could certainly be scripted, but I think this may be the worst of all possible solutions. You would need to have a separate class for each possible built/demo'd combination. Potentially this could end up as one class for each building.
-
I was just playing with @JMR idea and you can certainly use Data Visualization to do as he said and hide the objects with None fill and None pen. It will probably depend on if the views are rendered and if so, in what mode.
My original idea about using the Custom Visibility functions would have to apply to the Design Layer and then should (not yet tested) flow through to the Sheet Layers. If they have to be rendered in a Renderworks style that takes a long time and you want to keep the Viewport Cache, that probably won't work very well. If you are using OpenGL for quick renders, then the script can be included as part of a Saved View used to go to specific sheet layers/viewport and you can probably get what you need.
A combination of the above ideas using a script to attach a record (or set a Record.Field) to each object that should show in a given viewport coupled with the None fill, None pen for objects that don't have the record should be what you are looking for.
Or maybe a record with a field for each year. The script would then go through and populate each of the year fields based on if the building existed then. That would definitely be able to be handled by Data Visualization.
-
The real trick to the above is to realize that any of the criteria can be used as a formula in a cell (either with or without the IF statement) to return a boolean (true or false) value that can then be used for other comparisons or summaries in the worksheet.
-
1
-
-
Yes, you can.
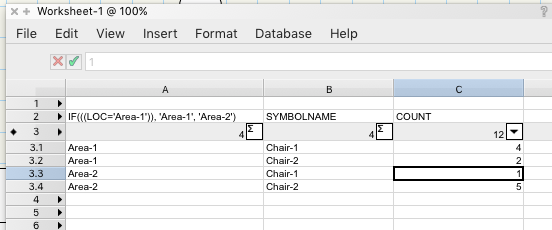
Assuming you can create a criteria for the database rows that limits the selection to only items that are in two areas, add a column with a formula of:
=IF(((LOC='Area-1')), 'Area-1', 'Area-2')
This will give you the name of the area for all the items. Click the disclosure triangle and choose the Summarize Items check box.
In the next column put a formula of:
=SYMBOLNAME
Click the disclosure triangle and choose the Summarize Items check box. This should give you a list showing one row for each symbol in each area.
In the next column put a formula of:
=Count
This will give you the number of each symbol that is summarized in each subrow.
-
1
-
-
Are you getting the other snap hints?
As long as Snap to Angle is selected in the Snapping palette you should be getting the extensions lines to show when you are vertical or horizontal. Are you getting the 30/45/60° extension lines showing? Are you getting the snap hint text to show?
The "Y" key on your keyboard will toggle the snap hint text on and off so it is possible you accidentally hit that and turned them off.
-
While DataVisualization may not do what you want, it would be a fairly simple Vectorscript to set custom visibilities based on a date that a building existed. If you are interested, I can explain in more detail, but the idea is exactly what you have above. Attach a record with fields that show when the building was build and when demolished. The script would then just take a data as input and set the custom visibility of all objects that were built before the script data and not demolished until after the script date.
-
2
-
-
Yet again @zoomer and I think differently. Rather than fillet 325 edges, I would create a complete negative of the hole (small cylinder of the correct length for the inside of the hole, large cylinder equivalent to where the fillet should end for the "outside" of the hole. Add solids and then fillet between the two) then duplicate this as I describe using the cylinder above and subtract solids.
It does not matter how far above the plate the subtracting surface goes, so make it big enough that it is easy to handle.
-
2
-
-
@zoomer That is certainly possible, but I have never noticed it. But I usually keep my 2D and 3D conversion resolution set to high or very high, so it is possible that the conversion it does is just good enough for me.
Also, I rarely use the Push/Pull tool and usually do separate parts and Add Solids/Subtract Solids. Just being old-school (and lazy to learn the new ways) on my part.
-
Or Extrude your board and then extrude one cylinder which is the same dimensions as your hole(s) and located at the correct x/y/z to put the whole into the board.
With the cylinder Selected, use Duplicate or Duplicate Array to make the pattern of 325 holes.
Select the Board and all 325 cylinders and Choose Modify:Subtract Solids. Make sure the board is highlighted and click OK.
You should end up with a board with 325 holes.
-
1
-
-
Restart VW to make sure it is not just a temporary problem.
Use the Workspace Editor to add them back into the palette.
-
1
-


Script issue
in Vectorscript
Posted
PushAttrs;
TF:=GetCustomObjectInfo(ObjName,ObjH,RecH,WallH);
CurrentCl:=ActiveClass;
FillBack(256);
FillFore(257);
FillPat(1);
PenPatN(2);
PenSize(6);
PenBack(256);
PenFore(257);
PenPatN(2);
The above lines store the old attributes settings (Push Attrs) and set the attributes that objects drawn during the execution of the script will use. The PopAttrs at the end of the script returns the settings to what they were before the script was run. If you really want to use the class attributes, everything from FillBack to PenPatN could be deleted.
IF (PBuildMat = 'wood 1 x 3')|(PBuildMat = 'wood 1 x 4')|(PBuildMat = 'wood 2 x 4') THEN BEGIN
            FillFore(46529,34664,22800); {0=black}
            FillBack(46529,34664,22800); {65535=white} END
ELSE BEGIN
            FillFore(52428,52428,52428); {0=black}
            FillBack(52428,52428,52428); {65535=white} END;
These lines control the color that the fill is set to. If you want to use the class attributes you could eliminate the IF/Else and just use SetFillColorByClass;
IF TF=True THEN BEGIN
  NameClass(CMClass);
  SetClLSN(CMClass,2);                        {Line style}
  SetClPenFore(CMClass,0,0,0);                {Pen fore color}
  SetClPenBack(CMClass,0,0,0);                {Pen back color}
  SetClFPat(CMClass,2);                        {Fill pattern}
  SetClFillFore(CMClass,cRed,cGrn,cBlu);    {Fill fore color}
  SetClFillBack(CMClass,cRed,cGrn,cBlu);    {Fill back color}
  SetClUseGraphic(CMClass,TRUE);            {Use gfx attri at creation}
  SetClLW(CMClass,180mm);                    {Line weight}
END;
This section sets the attributes of the class based on the RGB values you specified earlier in the script. But it does not tell the object you are drawing to use the class attributes. But the next line switches the active class so that the class you set the attributes for is not active. So this code is not really doing much for you.
I don't know exactly what you are trying to accomplish, but if you want to use the class attributes, you need to change the first block to make all the attributes ByClass instead of the settings that are shown. Then when you change the class the object will use the class settings. And if you do this you can simplify the script to remove all of the RGB setting code as that will all be done in the class setup.
If you want to manually set the attributes as you are doing that is fine, but you can't manually set the attributes and then also expect them to use the class settings. It is one or the other.
If you are using attributes by class you probably don't want to change the class attributes in the script that is drawing the objects as everything else in the file using those class attributes will also change. You will probably need to have a wood class and an aluminum class and set the object in the correct one rather than setting the attributes manually.