


Tbai
-
Posts
17 -
Joined
-
Last visited
Content Type
Profiles
Forums
Events
Articles
Marionette
Store
Posts posted by Tbai
-
-
Hey @Gregi,
Thanks again for looking into this. Just had time to test it out.
You were correct. Once I removed the propoerty set away from the pre-set data manager, it works like a charm!
Much appreciated!
-
Hi @Gregi !
Thank you for creating this node! I gave it a test. It works perfectly to delete ALL IFC data attached to any objects.
It's good to have this node too, but maybe I mis-interpreted what I'm looking for here...Each object got IFC data attached shows this nest of info/data below:
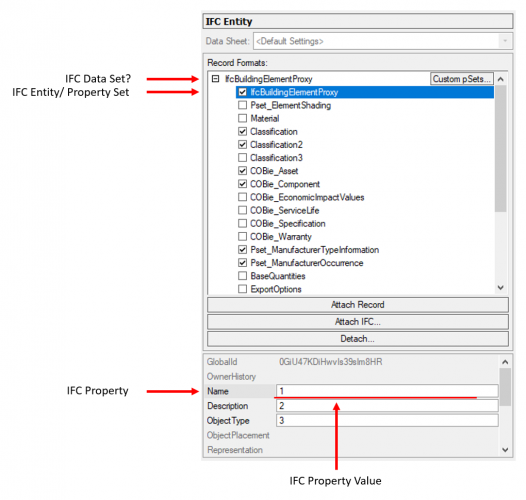
The node you created ended up removing the entire IFC Data Set (tbh, the naming system is so confusing🤦♂️. The IFC Data Set and the first line IFC Entity (Property Set) both called the same...? not sure if I got it correct here)
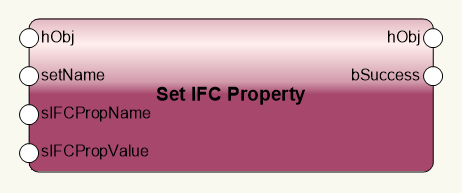
I'm looking for a node to remove or untick only 'ONE line' of IFC Entity/ Property Set (equivalent to a record? For example, to untick the line 'Classification' with all other still remain the same) Something like the opposite of the 'Set IFC Property' node maybe...? I guess the sIFCPropValue part would be redundant.

Again, thanks for any help in advance!
-
Hi Marionette geniuses!
I wonder if there's an opposite node for
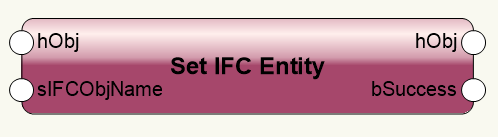
or a way to workaround to untick/remove IFC entities that were previously attached to objects.
Data Manager has been really helpful attach/manage new IFC data, but when I tried to remove any unwanted entity/data in Data Manager, they still remain in the Data tab in OIP. Only gave me the option to manually untick them in the OIP if this makes sense. I was hoping it can automatically unactivate removed entities...Data Manager is still under developing from what i read, hopefully this will get improved!
I've checked the collection of various nodes shared by AlanW and tried searching across the forum, but got no luck. If it already exists, could you redirect me to the post please?
Thanks in advance!
-
Thank you so much for your prompt reply and solution @Marissa Farrell !
Wow didn't expect to be this simple🤣
-
 1
1
-
-
Hello Marionette geniuses,
I'm trying to put together a network that drops grids of points over/within multiple polys.
I managed to get it to work on a SINGLE poly, learnt from a couple of brilliant examples on the forum, but had no luck get it to work on MULTIPLE ones...I've tried Repeat Node, thanks for sbarrett's tips in another my question post, but it's not doing what I want it to do, apparently...Couldn't get the input lists in the same length.
I'm not sure if this is even viable based on my poor scripting knowledge...
Thanks in advance if anyone could offer some tips or advice. See the attached example file. Hopefully all makes sense.
-
Thank you @sbarrett for your very informative and detailed answer to my questions! That's excatly what I was looking for.
Still need to get my head around when to use Sequence and Series...😃 -
Hello Marionette geniuses,
I'm trying to create a wrapper to fillet multiple 2D polys at once by a customisable radius input for a larger network in 2021. I got it to work on a single poly, but it just won't convert all vertexs on multiple objects. It only converts one of the polys as intended, the rest only got either the first or the last vertex converted.
I think I may misunderstand how 'list' works in the context for my lack of scripting knowledge...Lists don't return data respectively? how do I tell data goes back to the corresponding objects...?
Any tips would be much appreciated! See an example file attached.Thanks in advance!
-
 1
1
-
-
Thanks for getting back to me!
28 minutes ago, Tamsin Slatter said:Data Visualization in 2021 DOES include the ability to override the opacity on fills. It also offers the chance to create a blend of colours between two selected colours, and to export these as a named colour palette.
That's brilliant! Good to know. Will try it out in the new version. What about Image Fill? Don't know if you had a chance to look at the file I attached. I set my fill overrides to 'Image' and the result doesn't look quite right. Seems they show in a wrong scale somehow. Do correct me it's already fixed in 2021 though.

 30 minutes ago, Tamsin Slatter said:
If the fill is something that requires a named resource (such as a hatch or image), then the resource would need to be the same across a file set. Another option would be to have a resource file, that is used to reference resources into a number of files across the project. But this comes with a health warning. Referencing resources in this way can be disastrous unless everyone is well aware that editing a resource will cause it to update across the entire project!
Thanks for the suggestion. When you say to have a resource file, do you mean literally reference another Vectorwork file with the Fill palattes saved in? yes, I can see it will cause a mess...I thought you can't edit a referenced resource unless you break the reference?
-
Thanks for your prompt reply @Nikolay Zhelyazkov and looking into the problem! Yes, that's what I was trying to do.
1 hour ago, Nikolay Zhelyazkov said:The problem with this approach is that Revision Data in TBBs is actually not document wide, each revision is unique and separately attached to TBB objects. This means that we do not store data in the record formats as in Issue Data (which makes FormatField formula work) and that is why you get empty results with your FormatField calls.
That all makes sense.
1 hour ago, Nikolay Zhelyazkov said:hat is why I think that maybe Issue Data will be more suitable for your workflow, as it is document wide and you can have a worksheet that looks the same as yours if you have some revision data in the document too. However, if you do not want to mess with both Revision and Issue data, you could simply create issues only, then change the formula in your Project Revision History Report for Current Revision to be just for the issue data record Current Revision value from the database row UI as shown in the image below
Thanks for the suggestion too. I guess that's the best bet to batch putting in issue date now and then using Title Block Manager, and use the formula setting you showed.
Much appreciated
-
Sorry to bump this, the demonstration at the very end of the webniar by @Tamsin Slatter below was just quite impressive. Would be good to know If data visualization only works with solid colours, or it might get fixed in 2021? Anyone else tried it out or mmay have similar issue?
Also, I just realized the way how data visualization extracts Fill might be the same as how viewport class overide does...? So techinically, even Image Fill works well with scales, it still won't work across files unless have all colours/images named the same in both files
https://university.vectorworks.net/mod/page/view.php?id=617
Thanks
-
Sorry for bringing this old topic back up again. I've been looking around the forum to work out how to create a Customised Revision History Worksheet.
Thanks for answering all these worksheet questions since July 2018, but after viewing all those posts I still couldn't turn it over in my mind😅 It would be appreciated if you could help on the problems I have...Btw, I have checked out the Project Revision History and Sheet Revision Log reports in 2020. Don't get me wrong. They are briliant, but they're just not quite fitting in my company's working flow...
We tend to only use Revison Data and use it for issuing as well the same time, so people don't bother entering both when they are mostly the same all the time. Here comes the question. In the Project Revision History report, it still use Title Block Issue Data.Date. I'm trying to work out if we can use Title Block Revision Data.Date instead. I tried the following methods to get it to work:
1. Replace the formula in the report right away, the cell will just show nothing.
2. I set up a new Database by =DATABASE((PON='Title Block Border')), and put ='Title Block Revision Data-4'.'Date' in the column. But will end up in following.
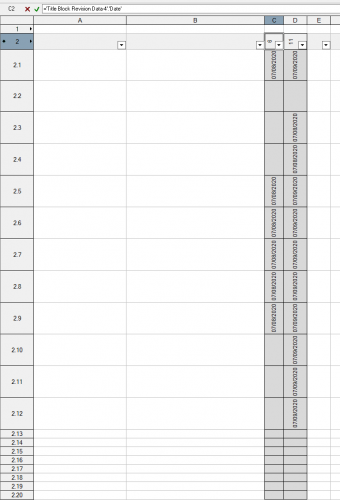
3. Last but not least, I tried formulas below in a single cell, nothing worked.
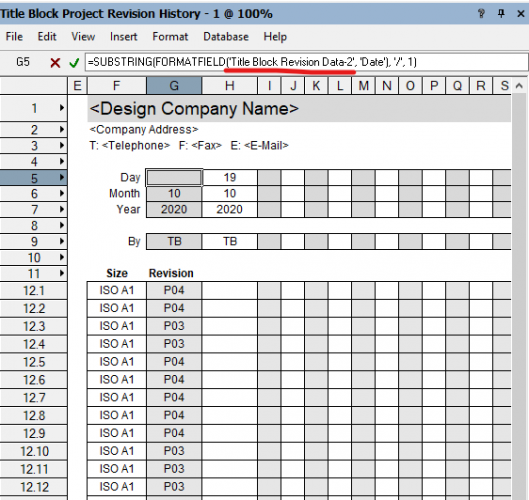
a. =SUBSTRING(FORMATFIELD('Title Block Revision Data-4'.'Date'), '', 1)
b. =SUBSTRING(FORMATFIELD('Title Block Revision Data-4', 'Date'), '', 1)
c. =SUBSTRING(FORMATFIELD('Title Block Revision Data-4', 'Revision Date'), '', 1)
d. =SUBSTRING(FORMATFIELD('Title Block Revision Data', 'Date'), '', 1)
So just wondering if I'm doing something wrong, or it's just not possible. From the second method can clearly see the data is there tho...🤦♂️ See below the outcome I'm trying to get to:
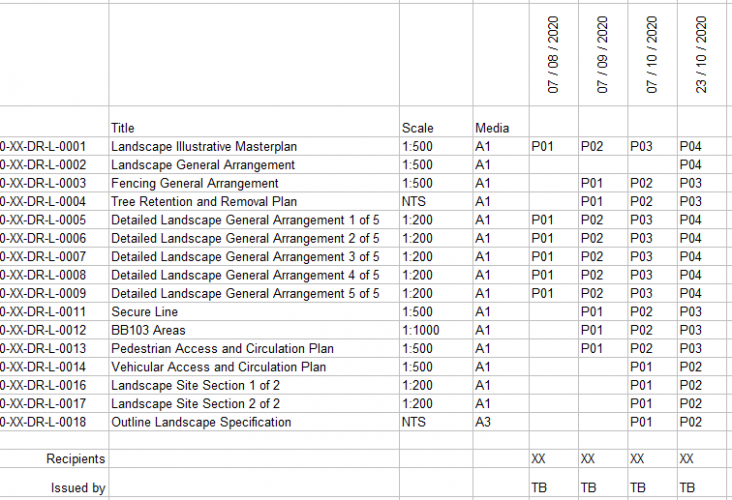
Had a second thought, I think it could be there's no 'record destination' enclosed to the single cell...but I'm not really sure how to include (R IN ['Part Data']) in the formula from there🤔
Thanks for helping!
-
Hiya,
I was looking for an alternative solution for viewport class override to quickly turn black/white plans to coloured on sheet layers across different files following a 'preset' palatte. I'm aware of you can group and copy the viewports through, but if classes, fill colours or line types named differently, you won't get the same result by eyedropping the viewports.
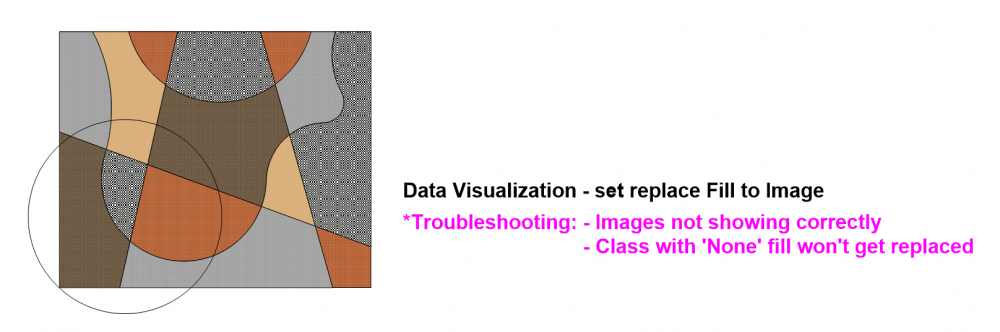
I just switched to 2020 and gave Data Visualization a try since Vectorworks 2020 got quite some update on it. If I just set my data visualization preset to replace classes's Fill to Solid colours, it works great (except for you can't change opacity and shade setting, and anything set to none in classes won't get replaced/ applied), but it seems struggling get the image fills right using data visualization preset (on both design layers and sheet layers).
If any of the above doesn't make sense, please see my testing file attached.
Thanks for helping
-
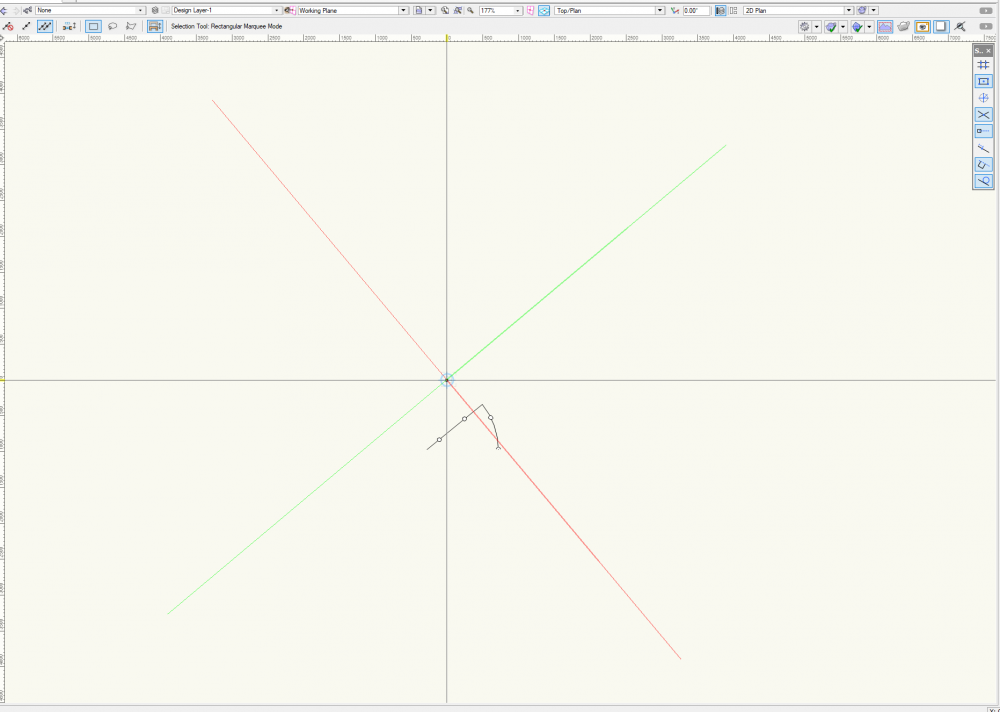
Same problem here...Everytime reset/update a marionette object, the whole plan rotates back to 0 degree although the axes are showing correctly. I know using saved views could solve it easily but it's just a little annoying...
Just wondering if this has been solved yet?
Thanks
Thomas


Gradient Cut Fill Site Model Visualization
in Wishlist - Feature and Content Requests
Posted
@Tony Kostreski
I believe it's not achievable through site model settings...Site model settings only allows to do elevation analysis (low to high = dark to light ) like below or cut and fill only in red and blue shows where cut and fill.
It definitely has much practical use. I'm working in a landscape design practice and we have been often asked for a quick cut and fill excersice (to work out initial building FFL etc.) before civil engineers provide a thorough one at earlier stages.
Also it would be really helpful during consultation with aborists and tree officers (in the UK), so we can work out how deep the development would require to cut into the existing ground.
See below for graphical reference by 3D civils.