


Ethan R.
-
Posts
436 -
Joined
-
Last visited
Content Type
Profiles
Forums
Events
Articles
Marionette
Store
Posts posted by Ethan R.
-
-
Hello,
Working ona project and the ground plans are in Microstation .dgn format.
Anyone have any brilliance on how to get into VectorWorks?
Thanks!
EJR -
https://blog.vectorworks.net/2017/05/designs-made-walking-simtread-2-5-software
I found a blog-post for SimTread - can't find much else?
-
Do you remember which?
-
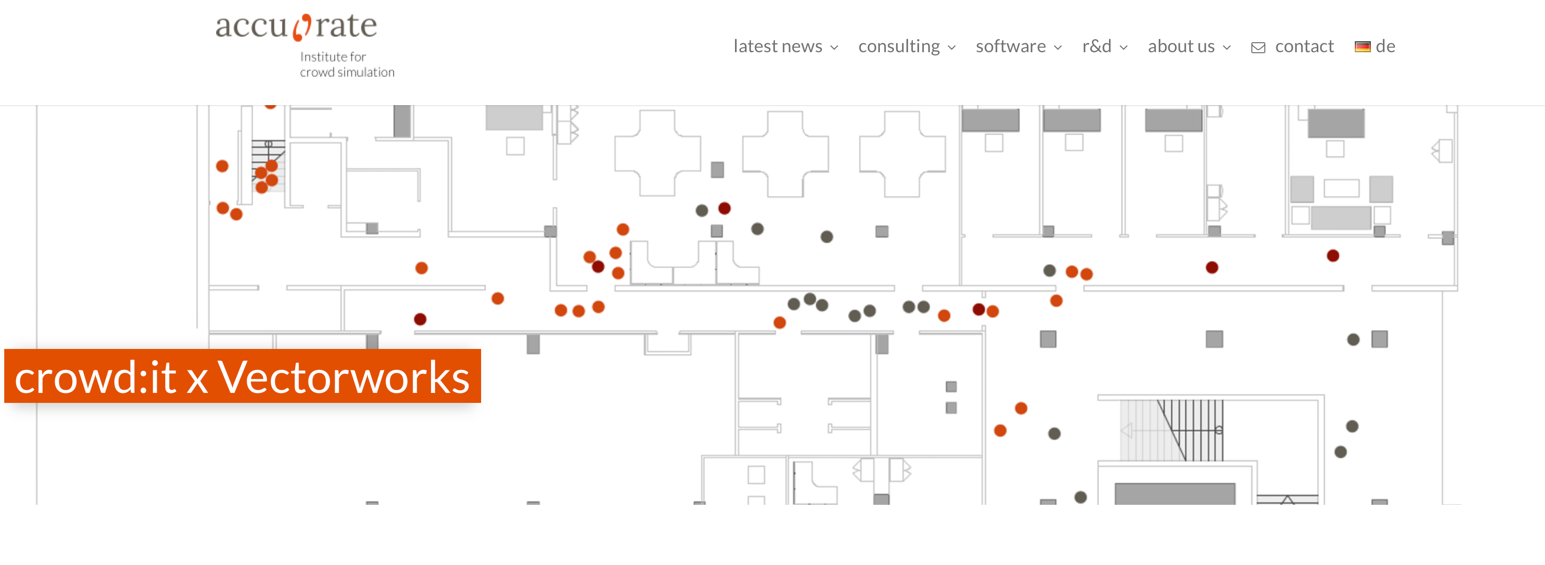
In VW 2019 there was a plug-in to work with CROWD:IT
https://www.accu-rate.de/en/en-crowdit-x-vectorworks/
What happened to that?
Is there any other Crowd Simulation tool?
We are looking for pinch points in our design and want to play with fire code compliance, etc.
Thank you

-
Bumping this for a muslin material. I'm looking to make a scrim and it would be quite useful 🙂
-
was this a bamboo symbol by chance?
-
On 4/8/2020 at 9:53 AM, line-weight said:
We've been complaining about this for about 100 years now and very little has improved, in terms of fixing existing broken stuff, and making things more consistent. So I doubt much is going to happen in the next 100 years. @abshapi see this thread:
https://forum.vectorworks.net/index.php?/topic/49017-my-wish-vw2020-to-have-no-new-features-please/
Your experience is the same as mine - the closer you look, the worse it gets. It's become a familiar process
Oh yes we have! Forget new features - fix the ones that are tere.
-
I'm so happy to see this tool grow and grow !
-
 1
1
-
-
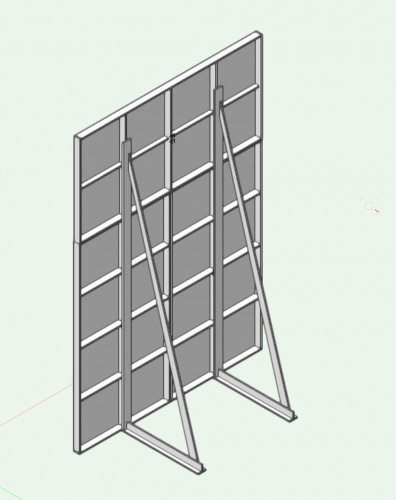
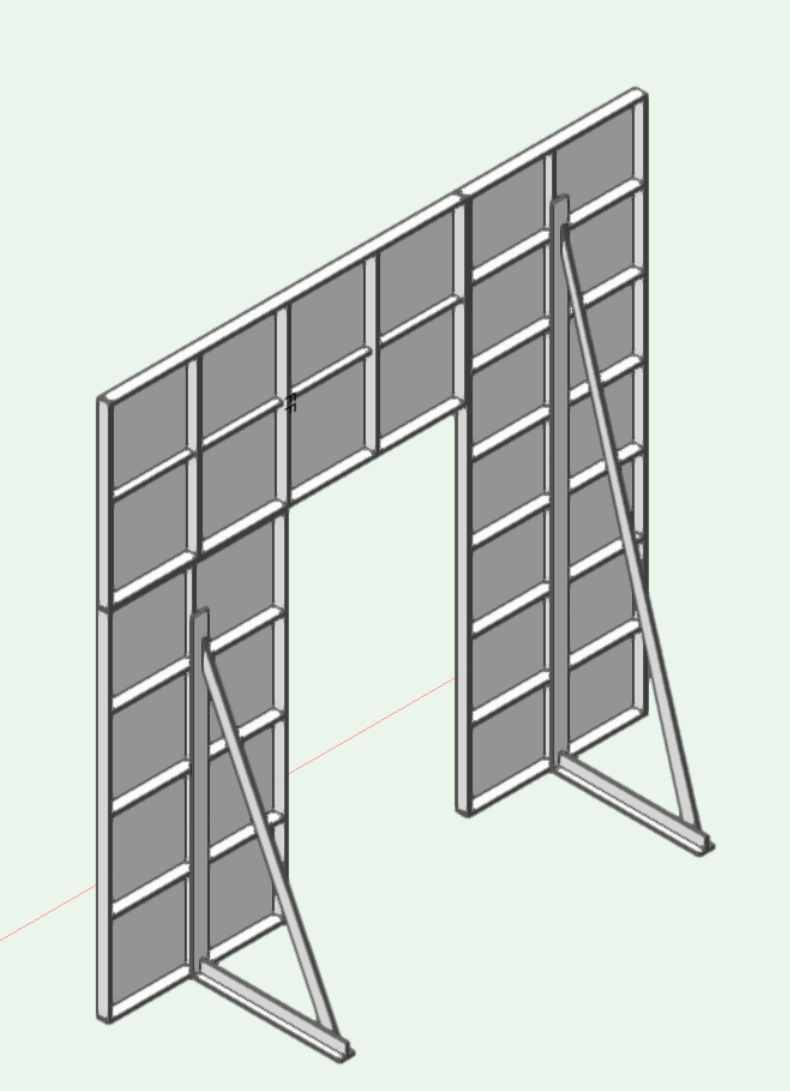
2 hours ago, michaelk said:
If you're trying to figure out the relationship between the height of the brace and the height of the flat,
Was not trying to do that. By setting bracing to 0 and face to 0, I was still getting the outside frame 🙂
-
5 hours ago, michaelk said:
Set the ribs to "none"
Set the Covering Depth to 0.
Turn on the center jack.
+ set framing width/depth to 0
Thanks !
-
Hi -
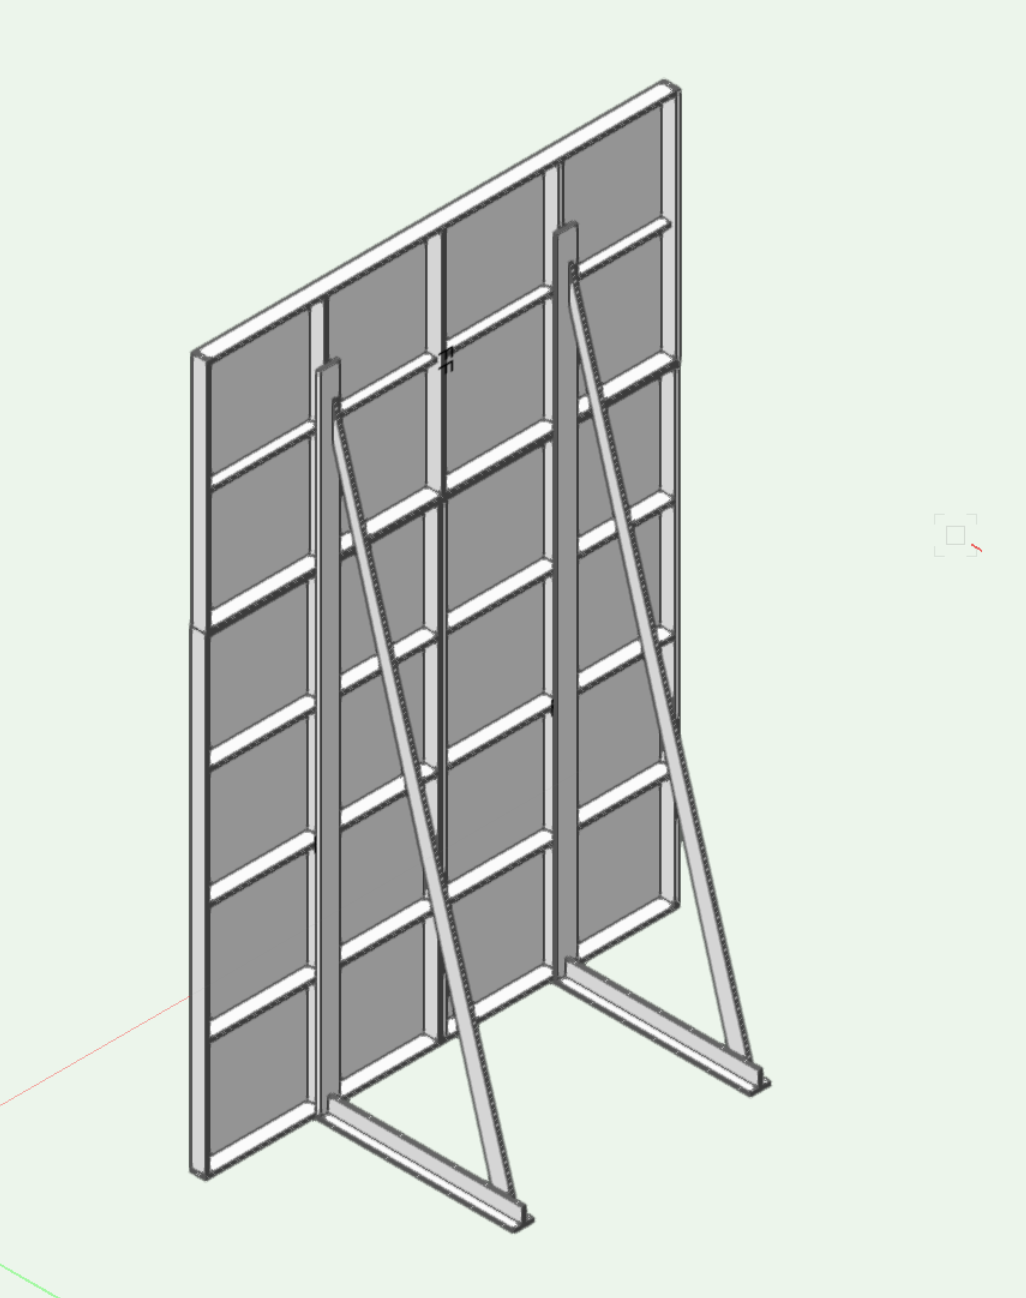
Is there way to have jacks span multiple flats?
ie. if I'm making 12' high wall with 4x8's ?
Thank you 🙂

edit - add image -
8 hours ago, michaelk said:
v1.2. The long-ignored Andrew Dunning Bug™ is finally fixed. Some day we'll need flats again.
Amen brother !
-
Is there a way to copy a custom color scheme between the different Visualizations ?
I have 3+ schemes and 7 colors / scheme.
Looking to create consistency across them all.
Thank you 🙂
-
I haven't been able to work it with spaces, but have it going with Data Viz
-
Working it with Data Viz ... could be longhand?
 Working i
-
Hello all,
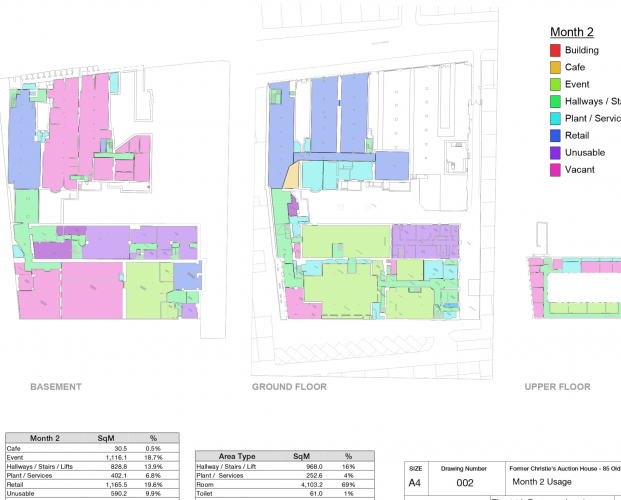
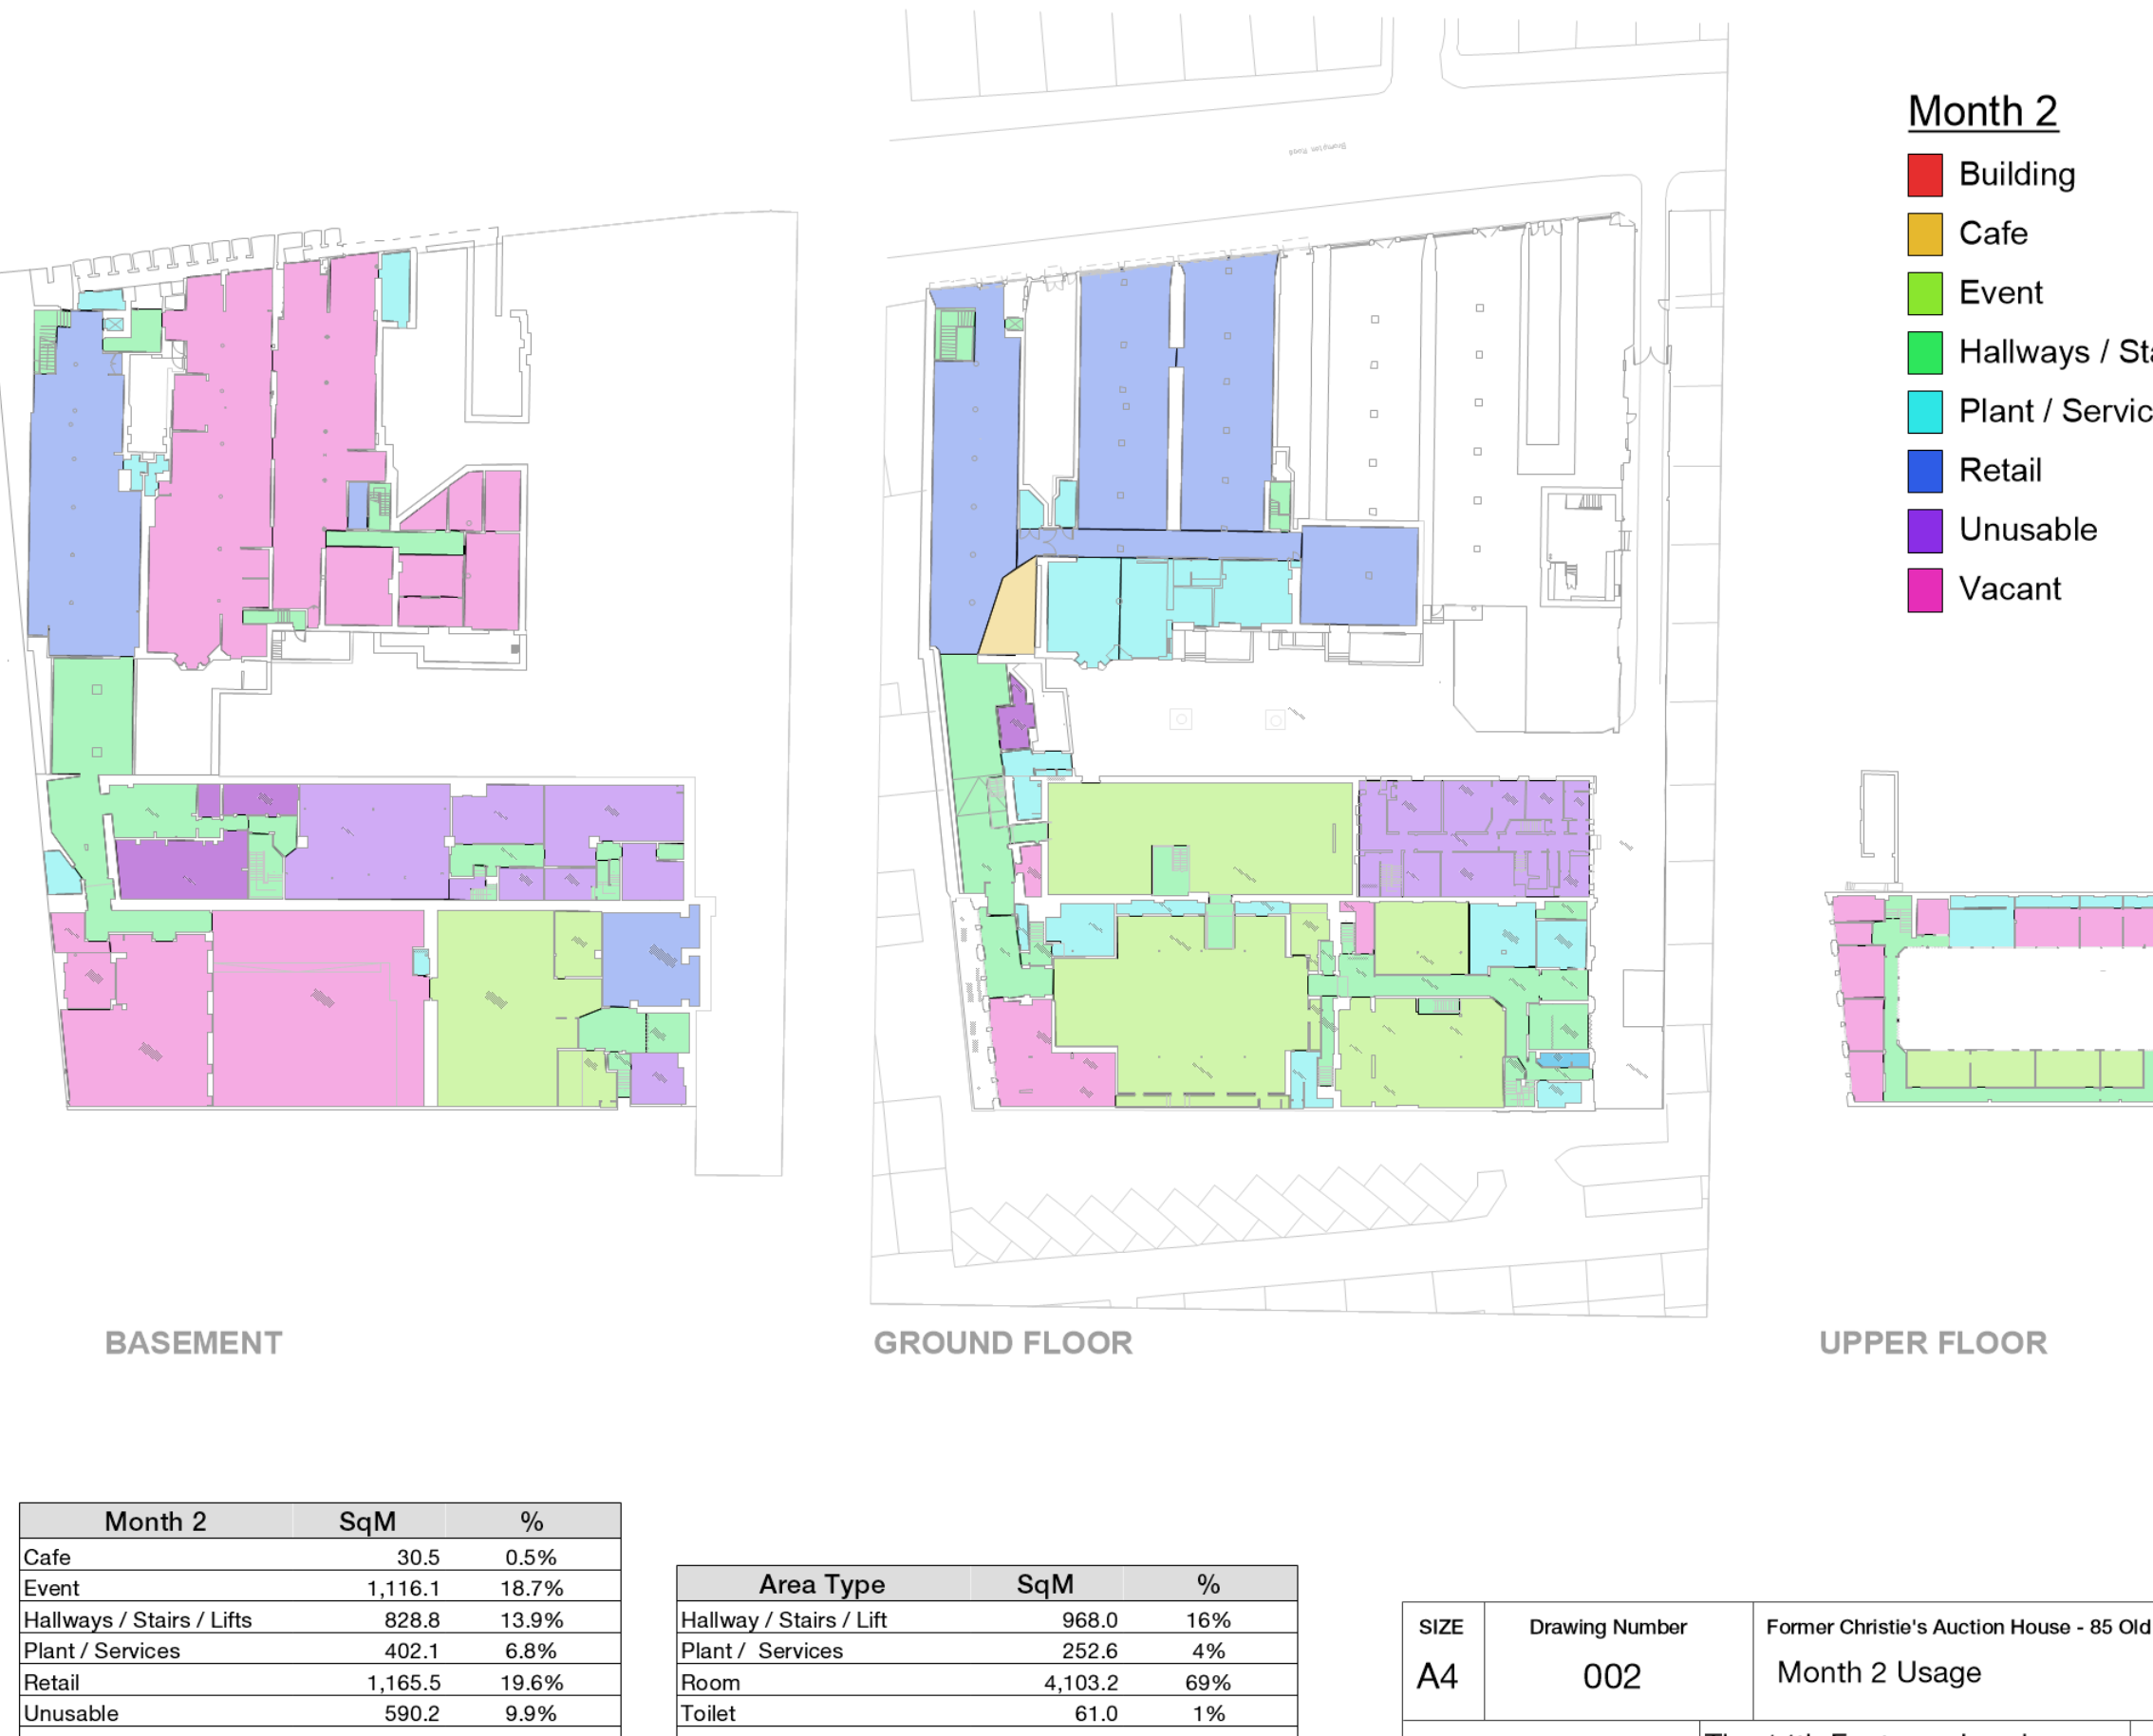
I have a project that requires me to show how space use changes over time.
I'm new to space planning and having a bit of a bear of this.
example:
-
Space 1
- Month 1: Build-Out
- Month 2: Retail Use 1
- Month 2: Retail Use 2
- Month 7: Buildout
- Month 8: Exhibition
- Month 14: Tear-Down
- Month 15: Vacant
-
Space 2
- Month 1: Build-Out
- Month 2: Multi-Purpose Event Space
- Month 6: Buildout
- Month 8: Exhbitoin
etc ..
This could also be reorganized by time
-
Month 1
- Space 1: Build-Out
- Space 2: Build Out
-
Month 2
- Space 1: Retail 1
- Space 2: Multi-Purpose Event Space
As a final product
I would like a series of color coded plans showing Usage per Time Period
It would great to be able to generate a worksheet from the same data to allow easier manipulation.
Thank you
Ethan
-
Space 1
-
@Pat Stanford Thank you
Reading this; I'm thinking that it is probably faster to simply bash this out on 15 Sheet Layers! 🤣
I'll give it a go and see how we do!
For reporting - maybe copy past into excel?
-
Thanks Pat
I have a unit with about 9 "Spaces" or "Areas"
I think what you say is correct
QuoteProbably the best way would be to create a custom record format with a field for each scenario (or month) and fill that in for each space. You can then use that data to either generate lists or to use Data Visualization to change the display attributes of the spaces.
Over the course of time, the spaces will change use
example:
-
Space 1
- Month 1: Build-Out
- Month 2: Retail Use 1
- Month 2: Retail Use 2
- Month 7: Buildout
- Month 8: Exhibition
- Month 14: Tear-Down
- Month 15: Vacant
-
Space 2
- Month 1: Build-Out
- Month 2: Multi-Purpose Event Space
- Month 6: Buildout
- Month 8: Exhbitoin
- etc ..
This could also be reorganized by time
-
Month 1
- Space 1: Build-Out
- Space 2: Build Out
-
Month 2
- Space 1: Retail 1
- Space 2: Multi-Purpose Event Space
As a final product
I would like a series of color coded plans showing Usage per Time Period
It would great to be able to generate a report from the same data
-
Space 1
-
I need to define space use over time.
ie. month 1 -> usage scenario A
month 3 -> usage Scenario B
is spaces the right tool for this?
Can someone help me with a good tutorial?
Thank you
Ethan
-
I've had a Gigabyte Aero for the since Nov 2017 - and it is still doing rather well.
A log of guts for a good price.
I've heard the new OLED versions are pretty slick!
(though I think they are only 15")
-
The sketch-up model imported perfectly!
-
I find this intermittent as well.
Nothing solid to report here 😞
-
On 4/18/2020 at 8:00 PM, EAlexander said:
@Brendan Gray@Charlie Winter - Very cool ! Thank you.
-
we have all noted this for years.
The new model of 'annual release' to justify subscription packages is the culprit.
This - i belive - is a practise started by apple wit the iPhones and has come to dominate the industry.
Gone are the days when software could refine itself over years. The push for new features now outways basic functionality; and we are all dealing with bloated software.
Anyone wonder why Acrobat is over 1GB of code?
-
3
-

Microstation .dgn file import?
in General Discussion
Posted · Edited by Ethan R.
Yeah - found a few online solutions - was hoping form something simpler and Mac!
what I found is:
https://www.autodwg.com/dgn-to-dwg/default.aspx