-
Posts
359 -
Joined
-
Last visited
Content Type
Profiles
Forums
Events
Articles
Marionette
Store
Everything posted by The Hamma
-
Deleted
-

Encrypting Python Scripts with external libraries
The Hamma replied to GioPet's topic in Python Scripting
Thank you -
This will display each for two seconds although the watch cursor does not appear to work on windows. CrossInteger = 1307 Crossconfig = 'LgCrossC' vs.AlrtDialog('Hit ok to see ', CrossInteger , ' = ' , Crossconfig, ' for 2 seconds') vs.SetCursor(CrossInteger) vs.Wait(2) CrossInteger = 1308 Crossconfig = 'HandC' vs.AlrtDialog('Hit ok to see ', CrossInteger , ' = ' , Crossconfig, ' for 2 seconds') vs.SetCursor(CrossInteger) vs.Wait(2) CrossInteger = 1309 Crossconfig = 'ArrowC' vs.AlrtDialog('Hit ok to see ', CrossInteger , ' = ' , Crossconfig, ' for 2 seconds') vs.SetCursor(CrossInteger) vs.Wait(2) CrossInteger = 1310 Crossconfig = 'SmCross' vs.AlrtDialog('Hit ok to see ', CrossInteger , ' = ' , Crossconfig, ' for 2 seconds') vs.SetCursor(CrossInteger) vs.Wait(2) CrossInteger = 1311 Crossconfig = 'WatchC' vs.AlrtDialog('Hit ok to see ', CrossInteger , ' = ' , Crossconfig, ' for 2 seconds') vs.SetCursor(CrossInteger) vs.Wait(2) CrossInteger = 1312 Crossconfig = 'TextBarC' vs.AlrtDialog('Hit ok to see ', CrossInteger , ' = ' , Crossconfig, ' for 2 seconds') vs.SetCursor(CrossInteger) vs.Wait(2)
-
Yes that works. Thanks for the tip. I downloaded the SDK. Seems like this info should be written down in a better format thank looking through an XML file.
-
The python script it does not seem to accept the variable "LgCrossC" or "ArrowC" in python I tried with numbers and I did not see any change in the cursor appearance. import vs integer = 6 down =False while integer != 0: click = False #define click variable pt = 0 # define pt variable while not click: #waits for click click, pt = vs.MouseDown() #assigns coordinates to pt vs.SetCursor(integer) vs.Wait(2) vs.AlrtDialog(integer) integer = integer - 1 Also what does the "import vs" command do? I can't find any documentation. It doesn't seem necessary for the script to work.
-
Does vs.SetCursor work in python scripts. I can't seem to make it work.
-

Encrypting Python Scripts with external libraries
The Hamma replied to GioPet's topic in Python Scripting
Does this run the external scripts? What would be the format If i wanted to place a python script next the the .vsm and run that script from within the vectorworks python script? -
Ok so it appears if you run a second script from within a first script using the "vs.DoMenuTextByName('Name', 0)" command the variables from the first script are not passed to the second script called but the variables in the second script are passed to the first script. So what I did was create two scripts. The first script renumbers the viewports that were pick selected by the second script. To make this work you have to add the second script to the workspace. This works with no errors. First script named "VP Label (Consecutive)" """ Script Name: VP Label (Consecutive) This script will renumber drawing labels contained within VP annotations in order picked by mouse. This script is dependent on pytyon script 'VPRenumb_A' 'VPRenumb_A' script needs to be added to the active workspace for 'VP Label (Consecutive)' to work properly 'VPRenumb_A' passes variables 'hVP' and 'numberStr' to 'VP Label (Consecutive)' Revised for VW 2021 David Hamer, 2020 revision 09-19-2020 """ hVP = [] numberStr = '' vs.SetPref(544, 0) #turns of Auto Drawing coordination vs.DoMenuTextByName('VPRenumb_A', 0) #vs.Rpstr_RemoveValues() #import VPRenumb_A #from VPRenumb_A import hVP, numberStr for DL in hVP: #defines handle DL as object of group hVP in order. #vs.SetRField(DL,'Drawing Label','Drawing',numberStr) #VW 2020 Version sets the drawing label to the current active number in sequence vs.SetRField(DL,'Drawing Label2','Drawing',numberStr) #VW 2021 Version sets the drawing label to the current active number in sequence vpNumber = vs.Str2Num(numberStr) # convert number string to number. numberStr = vs.Num2Str(0, vpNumber + 1) #subtract number from sequence then convert number to string. vs.SetPref(544, 1) #turns on Auto Drawing coordination vs.ClrMessage() #clears the message Second script named "VPRenumb_A" """ Script Name: VPRenumb_A This is a dependent pytyon script for 'VP Label (Consecutive)' This script needs to be added to the active workspace for 'VP Label (Consecutive)' to work properly This script should not be run on its own. variables 'hVP' and 'numberStr' are required by 'VP Label (Consecutive)' David Hamer, 2020 revision 07-20-2020 """ import vs hVP = [] #defines list hVP numberStr = vs.StrDialog('Enter and INTEGER to start numbering:','1') #ask user for starting number vs.Message('Click in empty space to end Label Numbering') #displays message vs.SetCursor(1307) h = 1 #defines h as 1 so while loop will start while h != 0: #loops until h has no handle click = False #define click variable pt = 0 # define pt variable while not click: #waits for click click, pt = vs.MouseDown() #assigns coordinates to pt h = vs.PickObject(pt) #selects the viewport at the click point if vs.GetTypeN(h) == 122: #if h is a viewport anno = vs.GetVPGroup(h, 2) #creates group from annotations of selected viewport h1 = vs.FInGroup(anno) #selects the first object in the anno group while h1 != vs.Handle(0): # steps through every object in the viewport selected by the click if vs.GetObjectVariableString(h1, 1166) == 'Drawing Label': #if veiwport object is a drawing label hVP.append(h1) #if step 1 - add to hVP list h1 = vs.NextObj(h1) #get next object in viewport\
-
I was really exited when I read this. I edited the script so it would number the drawing labels in reverse order but no luck same bug. I also tried a script version where it would run the "for DL in hVP" twice and set a dummy number the first run through and then set the specified number on the second run through but yet again same bug. It seems that it is setting them in its own order when it exits the script and if it the number is being used by another viewport when it sets the current viewport then it bugs out. #script to renumber drawing labels contained within VP annotations in order picked by mouse. vs.SetPref(544, 0) #turns of Auto Drawing coordination hVP = [] #defines list hVP numberStr = vs.StrDialog('Enter and INTEGER to start numbering:','1') #ask user for starting number vs.Message('Click in empty space to end Label Numbering') #displays message vpNumber = vs.Str2Num(numberStr) #convert number string to text. vpNumber = (vpNumber-1) #Subtract one number from the starting number as it will be added back in while command h = 1 #defines h as 1 so while command will start while h != 0: #waits for h to have no handle click = False #define click variable pt = 0 # define pt variable while not click: #waits for click click, pt = vs.MouseDown() #assigns coordinates to pt h = vs.PickObject(pt) #selects the viewport at the click point anno = vs.GetVPGroup(h, 2) #creates group from annotations of selected viewport h1 = vs.FInGroup(anno) #selects the first object in the anno group h1 = vs.NextObj(h1) #selects the next object in the anno group while h1 != vs.Handle(0): # steps through every object in the viewport selected by the click if vs.GetObjectVariableString(h1, 1166) == 'Drawing Label': #if veiwport object is a drawing label hVP.append(h1) #if step 1 - add to hVP list vpNumber = (vpNumber+1) #if step 2 - Add a number to the numbering sequence. h1 = vs.NextObj(h1) #get next object in viewport numberStr = vs.Num2Str(0, vpNumber) #converts the number sequence back to a string for DL in reversed(hVP): #defines handle DL as object of group hVP in reverse order. vs.SetRField(DL,'Drawing Label','Drawing',numberStr) #sets the drawing label to the current active number in sequence vpNumber = vs.Str2Num(numberStr) # convert number string to number. numberStr = vs.Num2Str(0, vpNumber - 1) #subtract number from sequence then convert number to string. vs.SetPref(544, 1) #turns on Auto Drawing coordination vs.ClrMessage() #clears the message
-
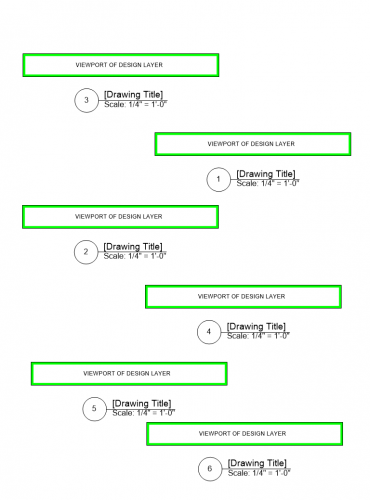
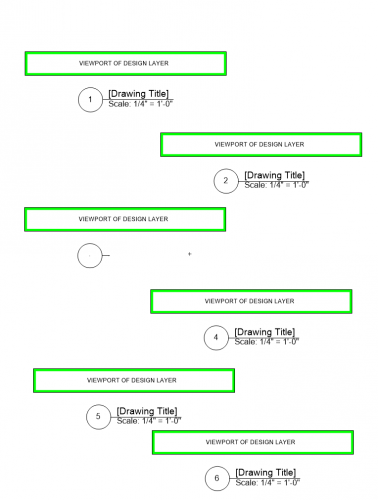
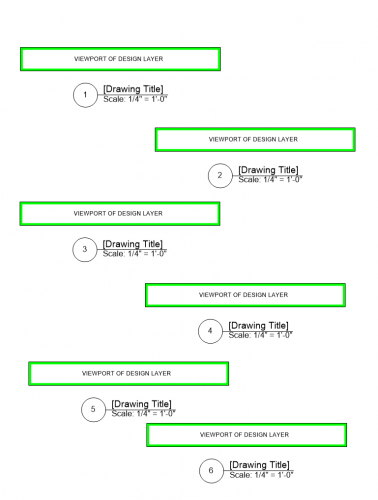
Below are the before and after images of what the script above does. As you can see in picture two not all of the drawing labels redraw correctly after running the script. The third picture is after running the "Reset All Plug-ins" command under tools/Utilities. The following script does not work to reset the drawing labels. Is there a script command that works like the "Reset All Plug-ins" command but only on the plugins that you select or call by the script? def redraweachobj(h): vs.ResetObject(h) vs.ForEachObjectInLayer(redraweachobj, 0, 1, 4)
-
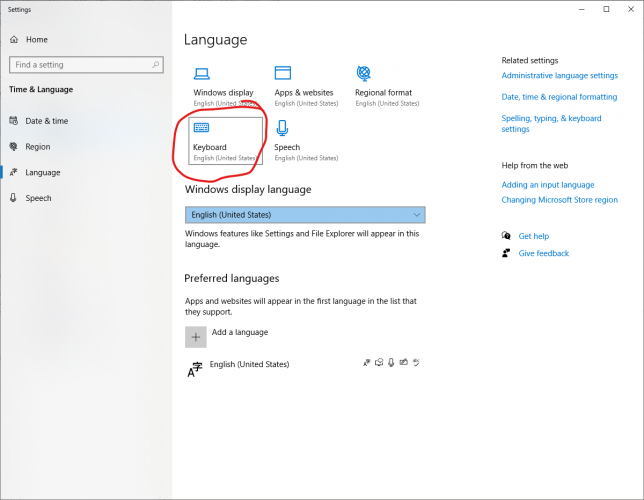
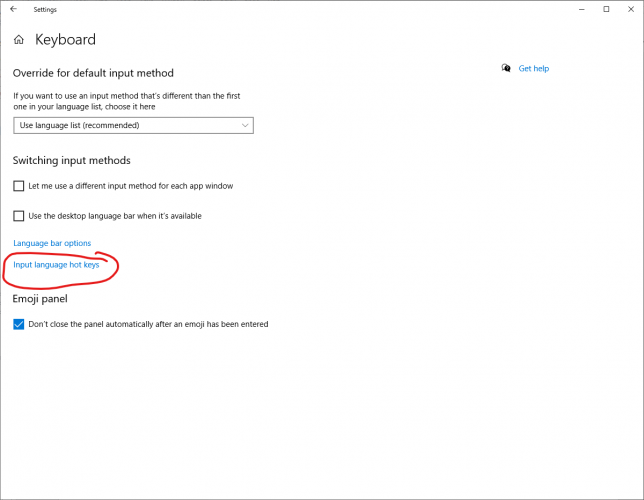
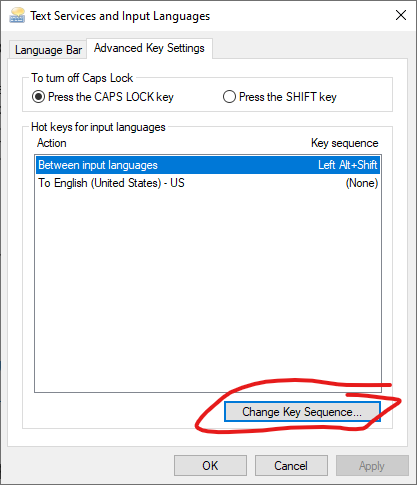
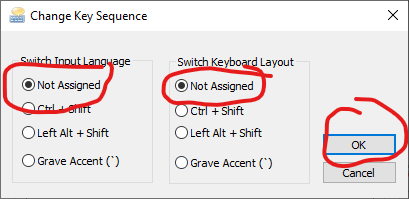
So far I have discovered three Windows programs that interfere with Vectorworks Shortcuts. Geforce Experience Skype Windows Language settings. The first two can be uninstalled and I will attach screen shots on how to disable windows language keyboard shortcuts below. If you discover any more programs that interfere please add them to this thread. #WindowsShortcuts
-
Raymond: I think you are right. I guess there is no way to run a script that calls another script and lets it finish then finishes the script that called it. The only other option I suppose is to have three scripts. One to turn off Auto DC, this script, and one script to turn it back on. It wouldn't be a problem if it was just the confirmation message you get at the end of the script. The issue is that some of the labels do not display correctly after modifying the number and you have to edit the annotations and move them so they refresh. And since the issue arises after the script I can't fix them in the script. I could possibly right a script to refresh the Drawing labels that could be run after this script.
-
In this instance 1=true and 0=false. This simple script will turn if off the Automatic Drawing Coordination. vs.SetPref(544, 0) This one will turn it on. vs.SetPref(544, 1) If I run the first script prior to running the script mentioned in the previous post I have no issue but if I try to disable it during the script it does not register as being off.
-
Thanks that was it but for some reason when I turn it off in the script it still acts like it is on. I checked and it is setting the preference off and then back to the prescript state at the end. #script to renumber drawing labels contained within VP annotations in order picked by mouse. autocoord = vs.GetPref(544) vs.SetPref(544, 0) hVP = [] numberStr = vs.StrDialog('Enter and INTEGER to start numbering:','1') vs.Message('Click in empty space to end Label Numbering') h = 1 while h != 0: click = False while not(click): click, pt = vs.MouseDown() h = vs.PickObject(pt) anno = vs.GetVPGroup(h, 2) h1 = vs.FInGroup(anno) objs = [h1] h1 = vs.NextObj(h1) while h1 != vs.Handle(0): if vs.GetObjectVariableString(h1, 1166) == 'Drawing Label': hVP.append(h1) h1 = vs.NextObj(h1) for DL in hVP: vs.SetRField(DL,'Drawing Label','Drawing',numberStr) vpNumber = vs.Str2Num(numberStr) # {convert number string to number} numberStr = vs.Num2Str(0, vpNumber + 1) #{increment number then convert number to string} vs.SetPref(544, autocoord) vs.ClrMessage()
-
Does anyone know what the Pref # is for Automatic Drawing Coordination? I can't seem to find it in the appendix.
-
Great Idea. Now I can isolate it and now I can get it to run in sheet layers or veiwport annotations if they are the active layer. """ This script assigns selected objects to class "1_Exist-(original class)" and set Construction Phase to 'EXISTING TO REMAIN'. If a in wall object is selected without selecting the wall the script will only change those in wall objects. If a wall is selected it will change the wall and all objects inserted in that wall. If New class does not exist objects original class is duplicated to retain class attributes. To take full advantage of this script use "Data Visualization" to display the "Construction Phase" record objects as desired. 1. Set "Data Visualization" to modify drawings per "Construction Phase" record 2. To make a "Construction Phase" invisible set the attributes of that phase to: Line settings to Fill "Solid White" and Line weight "0" This Python Script may be freely distributed. No warranty provided. Use at your own risk. Vectorworks bug does not show changes to symbols inserted in wall until either: Drawing is saved and reopened. Setting in Data Visualization dialog is changed. Symbol is removed from wall, can then be reinserted David Hamer, 2020 """ # Modifications to any objects happen here def assign(h): CName = vs.GetClass(h) CLen = vs.Len(CName) CNameE = vs.Copy(CName, 1, 8) # Grab First 8 letters of handle's class CNameD = vs.Copy(CName, 1, 7) # Grab First 7 letters of handle's class if CNameD == '2_Demo-': # Check if first 7 letters equal '2_Demo-' CName = vs.Copy(CName, 8, CLen) # if true grab root name of class # check if the class is new, if so delete new class and duplicate objects class and rename. if CNameE == '1_Exist-': CNameN = CName else: CNameN = vs.Concat('1_Exist-', CName) # If not add '1_Exist-' to name ClassCount = vs.ClassNum() # determine number of classes in drawing vs.NameClass(CNameN) # set the name of the class to be applied to handle if new class will be created if ClassCount + 1 == vs.ClassNum(): # check if the class is new and if delete new class and duplicate source vs.ReDraw() vs.DelClass(CNameN) # Delete new class CHandle = vs.GetObject(CName) # get handle to source class NDCHandle = vs.CreateDuplicateObject(CHandle, vs.GetParent(CHandle)) # duplicate source class vs.SetName(NDCHandle, CNameN) # rename duplicate class to name to be applied to handle vs.ResetObject(NDCHandle) vs.ResetObject(h) vs.SetClass(h, CNameN) # name handle's class vs.SetRecord(h, 'Construction Phase') # add record to inserted object vs.SetRField(h, 'Construction Phase', 'Phase', 'EXISTING TO REMAIN') # modify record to inserted object # Passes Handle to "def assign(h):" of PIO or Symbol selected def pio_processing(h): global container # declare global variable to be retained if vs.GetObjectVariableInt(vs.GetLayer(h), 154) == activetype: assign(h) # Runs "def assign(h):" hParent = vs.GetParent(h) # Get Parent handle itParent = vs.GetTypeN(hParent) # Get Parent type if itParent != []: if itParent == 68: # If Parent type is a wall set container to state PIOinwallwasdetected container = 'PIOinwallwasdetected' if itParent == 89: # If Parent type is a round wall set container to state PIOinwallwasdetected container = 'PIOinwallwasdetected' # Passes Handle to "def assign(h):" of every object except PIO and Symbols outside walls selected def object_processing(h): if vs.GetObjectVariableInt(vs.GetLayer(h), 154) == activetype: assign(h) # Runs "def assign(h):" h1 = vs.FIn3D(h) while h1 != []: if vs.GetObjectVariableInt(vs.GetLayer(h1), 154) == activetype: if vs.GetTypeN(h1) == 15: assign(h1) # Runs "def assign(h):" on symbol inserted if vs.GetTypeN(h1) == 86: assign(h1) # Runs "def assign(h):" on PIO inserted h1 = vs.NextObj(h1) def sl_processing(h): # Omit's Viewports in Sheet Layers if vs.GetTypeN(h) != 122: assign(h) activetype = 1 container = 'none' # Declare container var ACName = vs.ActiveClass() # Record name of active class if vs.GetObject('Construction Phase') == (): # Creates "Construction Phase" record if not present vs.NewField('Construction Phase', 'Phase', '<none>', 4, 0) if vs.GetObjectVariableInt(vs.ActLayer(), 154) == 2: activetype = 2 vs.ForEachObjectInLayer(sl_processing, 2, 0, 0) else: # Passes Handle to "def pio_processing(h):" of PIO and Symbols selected vs.ForEachObject(pio_processing, "((((T=PLUGINOBJECT)|(T=SYMBOL)) & (V) & (SEL=TRUE)))") # Passes Handle to "def object_processing(h):" of objects selected except PIO and Symbols outside walls selected # Skipped if PIO or Symbol selected was in wall if container != 'PIOinwallwasdetected': vs.ForEachObject(object_processing, "(((T<>PLUGINOBJECT)&(T<>SYMBOL)&(T<>VIEWPORT) & (V) & (VSEL=TRUE)))") vs.NameClass(ACName) # Return active class
-
I need some help. Apparently this script is editing objects that are selected on sheet layers even though the sheet layer is not active. Does anyone know how to limit the selection to just the viewable and editable layers. I thought about using ForEachObjectInLayer but it does not work for symbols and PIO in walls. """ This script assigns selected objects to class "1_Exist-(original class)" and set Construction Phase to 'EXISTING TO REMAIN'. If a in wall object is selected without selecting the wall the script will only change those in wall objects. If a wall is selected it will change the wall and all objects inserted in that wall. If New class does not exist objects original class is duplicated to retain class attributes. To take full advantage of this script use "Data Visualization" to display the "Construction Phase" record objects as desired. 1. Set "Data Visualization" to modify drawings per "Construction Phase" record 2. To make a "Construction Phase" invisible set the attributes of that phase to: Line settings to Fill "Solid White" and Line weight "0" This Python Script may be freely distributed. No warranty provided. Use at your own risk. Vectorworks bug does not show changes to symbols inserted in wall until either: Drawing is saved and reopened. Setting in Data Visualization dialog is changed. Symbol is removed from wall, can then be reinserted David Hamer, 2020 """ # Modifications to any objects happen here def assign(h): CName = vs.GetClass(h) CLen = vs.Len(CName) CNameE = vs.Copy(CName, 1, 8) # Grab First 8 letters of handle's class CNameD = vs.Copy(CName, 1, 7) # Grab First 7 letters of handle's class if CNameD == '2_Demo-': # Check if first 7 letters equal '2_Demo-' CName = vs.Copy(CName, 8, CLen) # if true grab root name of class # check if the class is new, if so delete new class and duplicate objects class and rename. if CNameE == '1_Exist-': CNameN = CName else: CNameN = vs.Concat('1_Exist-', CName) # If not add '1_Exist-' to name ClassCount = vs.ClassNum() # determine number of classes in drawing vs.NameClass(CNameN) # set the name of the class to be applied to handle if new class will be created if ClassCount + 1 == vs.ClassNum(): # check if the class is new and if delete new class and duplicate source vs.ReDraw() vs.DelClass(CNameN) # Delete new class CHandle = vs.GetObject(CName) # get handle to source class NDCHandle = vs.CreateDuplicateObject(CHandle, vs.GetParent(CHandle)) # duplicate source class vs.SetName(NDCHandle, CNameN) # rename duplicate class to name to be applied to handle vs.ResetObject(NDCHandle) vs.ResetObject(h) vs.SetClass(h, CNameN) # name handle's class vs.SetRecord(h, 'Construction Phase') # add record to inserted object vs.SetRField(h, 'Construction Phase', 'Phase', 'EXISTING TO REMAIN') # modify record to inserted object # Passes Handle to "def assign(h):" of PIO or Symbol selected def pio_processing(h): global container # declare global variable to be retained assign(h) # Runs "def assign(h):" hParent = vs.GetParent(h) # Get Parent handle itParent = vs.GetTypeN(hParent) # Get Parent type if itParent != []: if itParent == 68: # If Parent type is a wall set container to state PIOinwallwasdetected container = 'PIOinwallwasdetected' if itParent == 89: # If Parent type is a round wall set container to state PIOinwallwasdetected container = 'PIOinwallwasdetected' # Passes Handle to "def assign(h):" of every object except PIO and Symbols outside walls selected def object_processing(h): assign(h) # Runs "def assign(h):" h1 = vs.FIn3D(h) while h1 != []: if vs.GetTypeN(h1) == 15: assign(h1) # Runs "def assign(h):" on symbol inserted if vs.GetTypeN(h1) == 86: assign(h1) # Runs "def assign(h):" on PIO inserted h1 = vs.NextObj(h1) container = 'none' # Declare container var ACName = vs.ActiveClass() # Record name of active class if vs.GetObject('Construction Phase') == (): # Creates "Construction Phase" record if not present vs.NewField('Construction Phase', 'Phase', '<none>', 4, 0) # Passes Handle to "def pio_processing(h):" of PIO and Symbols selected vs.ForEachObject(pio_processing, "((((T=PLUGINOBJECT)|(T=SYMBOL)) & (V) & (SEL=TRUE)))") # Passes Handle to "def object_processing(h):" of objects selected except PIO and Symbols outside walls selected # Skipped if PIO or Symbol selected was in wall if container != 'PIOinwallwasdetected': vs.ForEachObject(object_processing, "(((T<>PLUGINOBJECT)&(T<>SYMBOL) & (V) & (VSEL=TRUE)))") vs.NameClass(ACName) # Return active class
-

Construction Phasing Data Visualization (Existing, Demo, New, NIC)
The Hamma replied to The Hamma's topic in Python Scripting
Script has been modified to detect if Design Layers or Sheet Layer is active and Isolate modifications to the active layer type. Also added the ability to modify objects within a Sheet Layer or Sheet Layer VP annotations. Note that classes will need to be enabled in VP dialog after running script in VP annotations otherwise they may be hidden. Only works on objects inserted in walls when design layer is active. """ This script assigns selected objects to class "1_Exist-(original class)" and set Construction Phase to 'EXISTING TO REMAIN'. If a in wall object is selected without selecting the wall the script will only change those in wall objects. If a wall is selected it will change the wall and all objects inserted in that wall. If New class does not exist objects original class is duplicated to retain class attributes. To take full advantage of this script use "Data Visualization" to display the "Construction Phase" record objects as desired. 1. Set "Data Visualization" to modify drawings per "Construction Phase" record 2. To make a "Construction Phase" invisible set the attributes of that phase to: Line settings to Fill "Solid White" and Line weight "0" This Python Script may be freely distributed. No warranty provided. Use at your own risk. Vectorworks bug does not show changes to symbols inserted in wall until either: Drawing is saved and reopened. Setting in Data Visualization dialog is changed. Symbol is removed from wall, can then be reinserted David Hamer, 2020 revision 07-15-2020 """ # Modifications to any objects happen here def assign(h): CName = vs.GetClass(h) CLen = vs.Len(CName) CNameE = vs.Copy(CName, 1, 8) # Grab First 8 letters of handle's class CNameD = vs.Copy(CName, 1, 7) # Grab First 7 letters of handle's class if CNameD == '2_Demo-': # Check if first 7 letters equal '2_Demo-' CName = vs.Copy(CName, 8, CLen) # if true grab root name of class # check if the class is new, if so delete new class and duplicate objects class and rename. if CNameE == '1_Exist-': CNameN = CName else: CNameN = vs.Concat('1_Exist-', CName) # If not add '1_Exist-' to name ClassCount = vs.ClassNum() # determine number of classes in drawing vs.NameClass(CNameN) # set the name of the class to be applied to handle if new class will be created if ClassCount + 1 == vs.ClassNum(): # check if the class is new and if delete new class and duplicate source vs.ReDraw() vs.DelClass(CNameN) # Delete new class CHandle = vs.GetObject(CName) # get handle to source class NDCHandle = vs.CreateDuplicateObject(CHandle, vs.GetParent(CHandle)) # duplicate source class vs.SetName(NDCHandle, CNameN) # rename duplicate class to name to be applied to handle vs.ResetObject(NDCHandle) vs.ResetObject(h) vs.SetClass(h, CNameN) # name handle's class vs.SetRecord(h, 'Construction Phase') # add record to inserted object vs.SetRField(h, 'Construction Phase', 'Phase', 'EXISTING TO REMAIN') # modify record to inserted object # Passes Handle to "def assign(h):" of PIO or Symbol selected def pio_processing(h): global container # declare global variable to be retained if vs.GetObjectVariableInt(vs.GetLayer(h), 154) == activetype: assign(h) # Runs "def assign(h):" hParent = vs.GetParent(h) # Get Parent handle itParent = vs.GetTypeN(hParent) # Get Parent type if itParent != []: if itParent == 68: # If Parent type is a wall set container to state PIOinwallwasdetected container = 'PIOinwallwasdetected' if itParent == 89: # If Parent type is a round wall set container to state PIOinwallwasdetected container = 'PIOinwallwasdetected' # Passes Handle to "def assign(h):" of every object except PIO and Symbols outside walls selected def object_processing(h): if vs.GetObjectVariableInt(vs.GetLayer(h), 154) == activetype: assign(h) # Runs "def assign(h):" h1 = vs.FIn3D(h) while h1 != []: if vs.GetObjectVariableInt(vs.GetLayer(h1), 154) == activetype: if vs.GetTypeN(h1) == 15: assign(h1) # Runs "def assign(h):" on symbol inserted if vs.GetTypeN(h1) == 86: assign(h1) # Runs "def assign(h):" on PIO inserted h1 = vs.NextObj(h1) def sl_processing(h): # Omit's Viewports in Sheet Layers if vs.GetTypeN(h) != 122: assign(h) activetype = 1 container = 'none' # Declare container var ACName = vs.ActiveClass() # Record name of active class if vs.GetObject('Construction Phase') == (): # Creates "Construction Phase" record if not present vs.NewField('Construction Phase', 'Phase', '<none>', 4, 0) if vs.GetObjectVariableInt(vs.ActLayer(), 154) == 2: activetype = 2 vs.ForEachObjectInLayer(sl_processing, 2, 0, 0) else: # Passes Handle to "def pio_processing(h):" of PIO and Symbols selected vs.ForEachObject(pio_processing, "((((T=PLUGINOBJECT)|(T=SYMBOL)) & (V) & (SEL=TRUE)))") # Passes Handle to "def object_processing(h):" of objects selected except PIO and Symbols outside walls selected # Skipped if PIO or Symbol selected was in wall if container != 'PIOinwallwasdetected': vs.ForEachObject(object_processing, "(((T<>PLUGINOBJECT)&(T<>SYMBOL)&(T<>VIEWPORT) & (V) & (VSEL=TRUE)))") vs.NameClass(ACName) # Return active class -
Where you able to write a script to accomplish this?
-
""" This script identifies the name of a texture in the drawing and creates a new class with identified texture assigned to the newly created class. This is useful so that objects can be textured by assigning them to the appropriate class. This Python Script may be freely distributed. No warranty provided. Use at your own risk. If the name of the texture and the prefix exceeds 63 characters the class name will be shortened to 63 characters. This is a Vectorworks class name limitation. David Hamer, 2020 """ ClassPrefix ='I-FNSH-' #Newly created classes prefix TextureList, NumItems = vs.BuildResourceList(97, 0, '') while NumItems != 0: TextureName = vs.GetNameFromResourceList(TextureList, NumItems) TextureClassNameW = vs.Concat(ClassPrefix,TextureName) TextureClassName = vs.Copy(TextureClassNameW, 1, 63) vs.NameClass(TextureClassName) vs.SetClFillFore(TextureClassName,0,0,0) vs.SetClFillBack(TextureClassName,0,0,0) vs.SetClPenFore(TextureClassName,65535,65535,65535) vs.SetClPenBack(TextureClassName,65535,65535,65535) vs.SetClFPat(TextureClassName,1) vs.SetClLSN(TextureClassName,2) vs.SetClLW(TextureClassName,10) vs.EnableCLDropShadow(TextureClassName,False) vs.SetClUseGraphic(TextureClassName,True) TextureIndex = vs.Name2Index(TextureName) vs.SetClTextureC(TextureClassName, TextureIndex) vs.SetClTextureD(TextureClassName, TextureIndex) vs.SetClTextureG(TextureClassName, TextureIndex) vs.SetClTextureL(TextureClassName, TextureIndex) vs.SetClTextureR(TextureClassName, TextureIndex) vs.SetClTextureT(TextureClassName, TextureIndex) vs.SetClUseTexture(TextureClassName, True) NumItems = NumItems -1
-
Revised 08-13-2020 See revision note in new comments Revised 03-30-2022 Download lasted versions at bottom of thread Attached are scripts that I wrote to help with renovation projects. These scripts edit the classing and add a construction phase record to every item selected. PIO's that are inserted in walls can be selected with out selecting the containing wall and the script will only affect those PIO's selected. If the wall is selected it will modify the wall and the PIO's that are contained with in that wall. SCRIPT CLASS MODIFICATION CONSTRUCTION PHASE RECORD 1 Existing Object 1_Exist- (Prefix) EXISTING TO REMAIN 2 Demo Object 2_Demo- (Prefix) DEMOLISH EXISTING 3 New Object No change or return to original Class NEW CONSTRUCTION 4 NIC Object No change or return to original Class NOT IN CONTRACT 5 Remove Phase Record No change or return to original Class REMOVES RECORD FROM SELECTED OBJECTS (ADDED) With the use of the scripts and data visualization you can create viewports that show the construction phases as desired. Attached to this post is a demonstration Video, the two files used in that video, and the four scripts. I added the script to my selected object context menu so when I right click on an object I can access the scripts from there. 2020-05-16 16-42-33.mp4 Construction Phase Demo Unmodified Plan.vwx Construction Phase Demo.vwx
-
Is there an equivalent way to achieve this in vectoworks worksheets? I would like to just display the finish material code and not the material in the finish schedule. In excel I would create a blank column to the right column C and add this formula =LEFT(C5,FIND("]",C5)+1) See attached image
-
Is there a vectorscript command to create new space style from current space handle?


