Martin Crawford
-
Posts
79 -
Joined
-
Last visited
Content Type
Profiles
Forums
Events
Articles
Marionette
Store
Everything posted by Martin Crawford
-
A “by current class” choice in symbols
Martin Crawford replied to Andrew Davies's question in Wishlist - Feature and Content Requests
While it is not an “elegant” solution, I wrote a python script to create an outline of the symbol and fill with a preselected color. I found this to be an easier approach than maintaining multiple symbols of the same thing. When done I put the color on a different class. Not pretty, but it works. You should be able to create a custom plugin that takes a symbol name and color and places and sizes a single symbol definition. You should be able to do this with Marionette and if you post in the forum someone will assist. The support is pretty amazing. I started with Marionette and quickly moved to python as I found it easier for some of the things I was trying to accomplish. I am confident this could be done in Python. I have a recorded training session that walked me through how to do this with menu commands, I will see if I can find the steps. Creating a script should be doable. i am happy to assist, if you need help. Martin -
At the moment I am using a tool and not a menu. You approach is interesting, however I have many different use cases that this approach would not work. The screen is often sliced in the raster to minimize processor. The pixel dimension is used in many places and not always attached to a single object. We often will have door or window cutouts that will also get a pixel dimension attached. Thanks for the suggestion. Martin
-
I have one plug-in that your enter the size, model, screen name and a few other details and it will draw a basic screen. This plug-in places symbols into the drawing. The symbols all have a specification record attached that contains the size in mm and the size in pixels. I enter the model from a dropdown on the plug-in, I then extract all the data from the specification record. This is called Create Screen. The second plug-in is an attempt to replicate the dimensions tool. Currently I enter the model (same way as the Create Symbol), and a scale factor. With this data, I extract the size in mm and pixels and do the math for how many pixels wide/tall the screen is. This is called Create Pixels What I would like is when I use Create Pixels I have way to select the screen it is being attached to (from the Create Screen) plugin, then extract the correct data with need to enter any data. When I run Create Pixels, I always am selecting a corner of the Create Screen object, is there a way to get and record the handle (is that the same as UUID?). I'm not sure how I would go about doing this. The way I'm doing works, however if you have the wrong model or wrong scale, then the math is incorrect. I am happy to send you a copy of the plugins, if that helps, however I would prefer to not publish to the forum.
-
I have a plug-in that calculates the number of pixels for a set of screens. I currently have to manually enter the pixel pitch and scale of in order to calculate the correct pixels dimension. What I would like to do, is have a way to "attach" the object to another object that I can then use to pull the pitch and scale data from. If either changed, then the pixel math would automatically change. I would be similar to how the dimensions feature works currently. Is there a way to create a plug-in that is linked to an object. Thanks Martin
-
Worksheets Selection Not Working
Martin Crawford replied to Martin Crawford's topic in General Discussion
Thanks I have a lot of symbols, around 200 (and growing), so that would be cumbersome. I think they way I'm using classes also won't work. So, I think I will go the record route. It's not perfect and does require some extra documentation for others on the team, but it will work. Thanks for your suggestions, I didn't think of the record solution. Martin P.S. How to I report this as a bug? -
Hi I am having a problems with a selection that has the following: Type - Symbol Layer - Screen Class - Module This works as expected. I need to exclude a few symbols that end in x If I leave the option off completely then I get 8 objects, if I change to 'ends with' or 'contains' I get back 2 objects. If I use the 'does not end with' or 'does not contain' I get a 0. Sometimes Vectorworks is very frustrating as it feels like there is not a lot of testing going on. Can someone confirm the issue and any suggestions on a workaround? Thanks Martin
-
A “by current class” choice in symbols
Martin Crawford replied to Andrew Davies's question in Wishlist - Feature and Content Requests
I would love this feature. Color is a important part of our design process and having multiple symbols for each possible color is not practical. My current workaround is creating a script that duplicate the outline of the object, then assign it a color. I treat it as a plugin, so changing color is not awful. Still the AutoCAD way is much easier. Martin -
Thanks Sometimes the answer is right in front of you. Insert worked great, So far I have cut the amount of time to create a drawing from 4-5 hours to about 2 hours. I think I can cut it down more by creating a few more scripts. I like python coding... Thanks for the assistance.
-
I am creating a script to create about 100 symbols, I would like to place them into various folders. I have the script working except for putting into the correct folder, is there an easy way to create them in a specific folder? Thanks Martin
-
Thanks, I think I can make it work with a combination of classes and layer. And I think I understand the layers and PIO
-
Interestingly, if I create a Marionette node to create two object on two different layers, it works, if I then convert the marionette to an object node, then it no longer works. I suspect because the Marionette changes the parent obj to change a layer, however this fails when working with a plug-in object. Is there a way to have a plug-in with objects on separate layers and classes? This seems like it should be straight forward. Thanks
-
If I run the above as a script everything shows up on the correct layers, however if I create a plug-in object and run the exact same code, everything is on the Screen - Data layer. I was not doing a deselect all and I thought that would be the problem, however it still is not working. Is there something else that needs to be done because I am doing this within a plug-in? Martin
-
Hi I have created a python script to draw LED panels and data lines. The LED panels should be on one layer and the lines on a separate layer. I thought I could use vs.Layer('Screen - Panels') for the LED Panels and vs.Layer('Screen - Data') for the data lines and simply call them before drawing the objects. When the script runs, everything is on the last vs.Layer used, in this case 'Screen - Data'
-
I discovered that trick, what I wasn't able to get it working with python code. I got as far as getting dim in the correct place, however I was unable to figure out how to set the override from python. I manually drew the lines and the text, and I have it working, the only thing I can't seem to figure out is when creating a linear plug-in, how can I determine starting and ending XY of the line. I know I get the length, and that is useful. If I could get the XY then I should be able to determine what side of the line to place the dimension text. Currently I am using a control that ask if it is top/bottom/left/right. It works, maybe not as elegant as I would like... Thanks Martin
-
Thanks. I saw the function, however I thought is was dealing with images and not the worksheet. I should spend more time clicking. Thanks
-
Is it possible to place a worksheet in a drawing, do you do this similar to a placing a symbol? Thanks Martin
-
Is it possible to replicate the functionality of the dimension tool with a Python Script. I need to add a dimension in pixels dependent on a symbol. I would like the ability to add a selection of panel type that would contain the numbers to calculate the pixels. I have this portion of the code working. I understand how to use the linear plugin to get the dimensions and I have that working, I can draw the lines and arrows and place the final text. What I am having problems with is figuring out how to get the correct offset for placing the text, also it would be cool if I could replicate the ghosting that shows what it will look like prior to clicking where the text goes. It would extra cool, if I could select the a symbol that it collects the pixel data from to perform the math, and while I know how to get the data, I'm not sure how I can do the selection of the symbol within a linear python script. Any guidance would be appreciated. Martin
-
Custom Dialog Box In Marionette Menu Script
Martin Crawford replied to Martin Crawford's topic in Marionette
I have a script that create the base panels, and a second that create the color. I have added to the color and order that incorporates the different patterns that I would need. Give all this, how do I draw a line from center point to center given a list of X,Y values? II'm thinking a custom node that takes the list and loops through to creates the line. Does that make sense. Martin -
In the attached file one of the Sequence Node is creating 2x the amount of data that it should. If I enter a 5, I get 10 items in the list. Can you someone check and see if the issue is unique to my computer or a problem with the specific node. I was able to delete the node, add it back and get things to work correcly. However, I am now nervous on how a node could not work correctly. This makes me concerned about the stability and viability of Marionette for production critical use. How can I tell why it's not working? Thanks Martin Sequence_Node.vwx
-
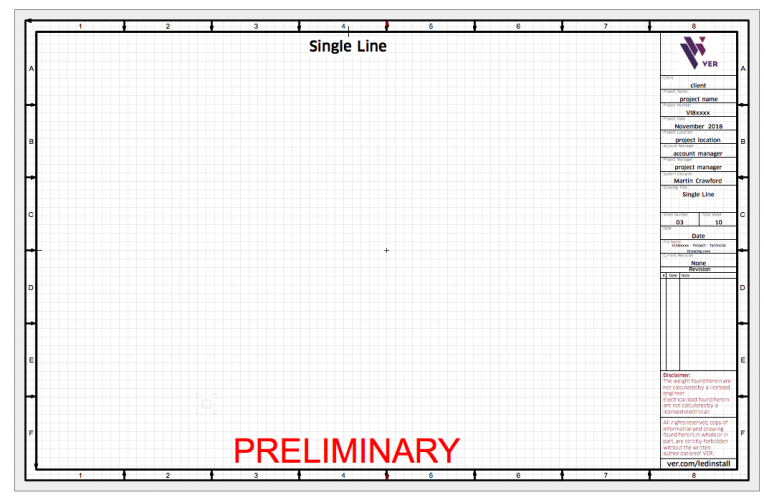
For some reason my drawing borders have arrows that just showed up. Any thoughts on how to fix? I have attached a screen shot demonstrating the issue. Thanks Martin
-
Custom Dialog Box In Marionette Menu Script
Martin Crawford replied to Martin Crawford's topic in Marionette
THANKS! Maybe I should rethink how I approach the problem. I'm thinking three sets of scripts. The first draws the base screen and assigns the ID number. The second creates the color (and lines) and updates the symbol record with the correct data. These would be rectangles the same size as the symbol. The third would be the lines and circuit data for power. I am attaching the script to create the screen, it works except for assigning a name to the rectangle. The rectangle act as a bonding box and I use it for calculating the Sq/m area as well as the resolution of the screen. I also need to get the symbols on the correct layer and class. I am assuming this is easy? I am still working on the color, I have something that sorta of works, I just need to work out a few details. I need to create a list of colors (actually two lists, depending on product), each list would either 12 or 8 pairs of colors. What is the best way to create a list of colors that I can access from the OIP? I agree, baby steps is the best approach. Thanks VER_LED_Install_-_Marionette_Scripts.vwx -
I have a question in viewports and layers. is it possible to create viewport and sheetlayers from a Marioette script? I have a need to create a bunch of objects, group them together, create a view port, then assign to a sheet layer. If so, would it then be possible to add annotations to the viewport, specifically dimensions. Thanks Martin
- 1 reply
-
- 1
-

-
I'm not sure if this is something that is best done using Marionette, a script or a plugin, hopefully someone can help. Attached is a screen shot of a drawing with a pixel dimension. I would like to create a tool that will automatically create this for me. I would like to be able to select two point and input, or better select a symbol, and have the script draw the dimension and calculate the pixel value. Is this possible and if so what is the best approach. Thanks

-
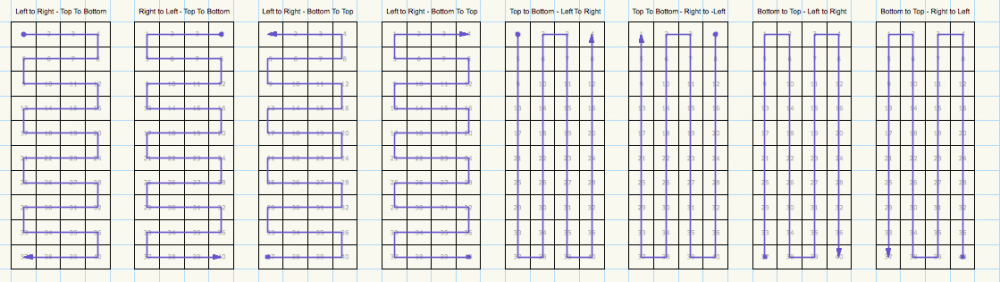
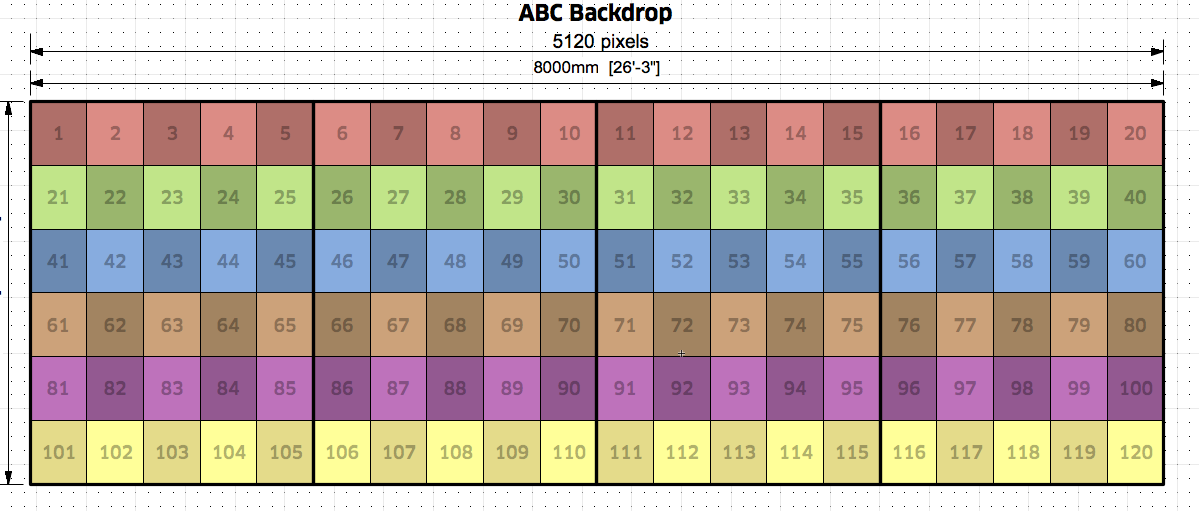
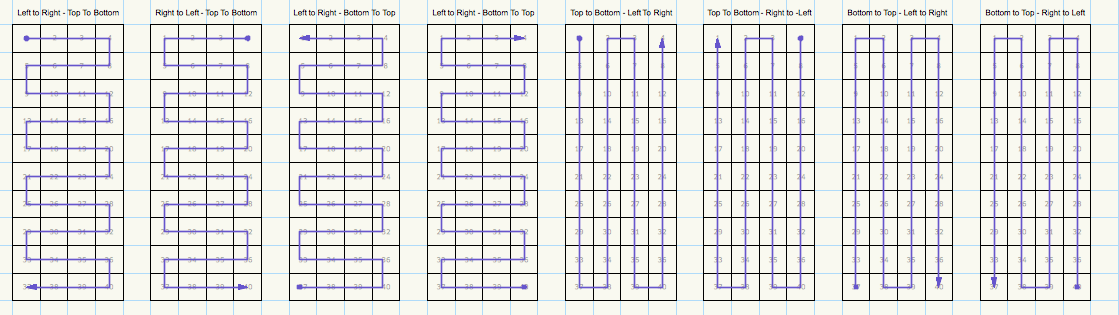
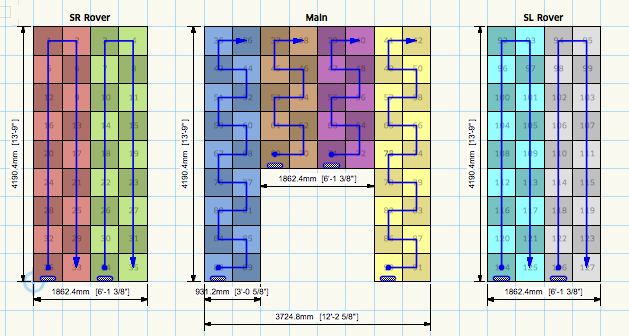
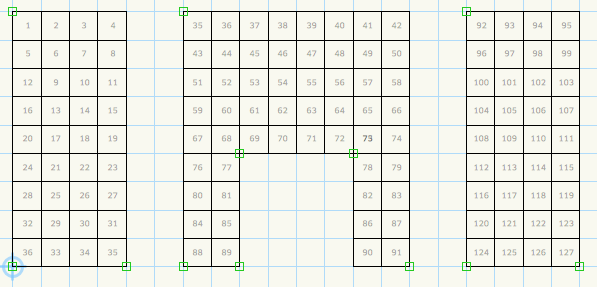
Hi Is it possible to have a Marionette script that pops-up a custom dialog box so I can get input for running a script. I can't really use the OIP as I need to select a the objects, get input, then assign data to the objects. I have attached a few screen shots, The no color or the starting point, the color is the ending point and the last one is the different patterns used to connect everything togehter. The main object is a symbol and the colors are rectangles (I wish a symbol created on none class would inherit that attributes of the class it is on). The arrows attachement are the different way of connecting things together. So I would like to be able to draw the main screen, highlight a section and run a marionette script via a menu command that will add color, arrows and update records. I think I can manage all of those elements, however to work I need to input 4-5 bit of data. For example, the Processor number, port number, starting ID number and the arrow connecting pattern (also a few other details that attach to a record used for reporting). How much of this can be done with a native Marionette script vs a custom node. I don't see an easy way for the patterns in native Marionette and suspect this portion will need to be a script. Thanks! Martin


-
Hi Is it possible to have a Marionette script that pops-up a custom dialog box so I can get input for running a script. I can't really use the OIP as I need to select a the objects, get input, then assign data to the objects. I have attached a few screen shots, The no color or the starting point, the color is the ending point and the last one is the different patterns used to connect everything togehter. The main object is a symbol and the colors are rectangles (I wish a symbol created on none class would inherit that attributes of the class it is on). The arrows attachement are the different way of connecting things together. So I would like to be able to draw the main screen, highlight a section and run a marionette script via a menu command that will add color, arrows and update records. I think I can manage all of those elements, however to work I need to input 4-5 bit of data. For example, the Processor number, port number, starting ID number and the arrow connecting pattern (also a few other details that attach to a record used for reporting). How much of this can be done with a native Marionette script vs a custom node. I don't see an easy way for the patterns in native Marionette and suspect this portion will need to be a script. Thanks! Martin