


MarcW
-
Posts
9 -
Joined
-
Last visited
Content Type
Profiles
Forums
Events
Articles
Marionette
Store
Posts posted by MarcW
-
-
@TomWhiteLight just seen next reply with video - will watch.
-
@TomWhiteLight thanks for the pointer - and the learning curve I'm about to climb. You say "data visualisation" - I have no idea what it is or how to use it, but I'll give it a go. Will start out with the VW help site. 🙂
-
hello all,
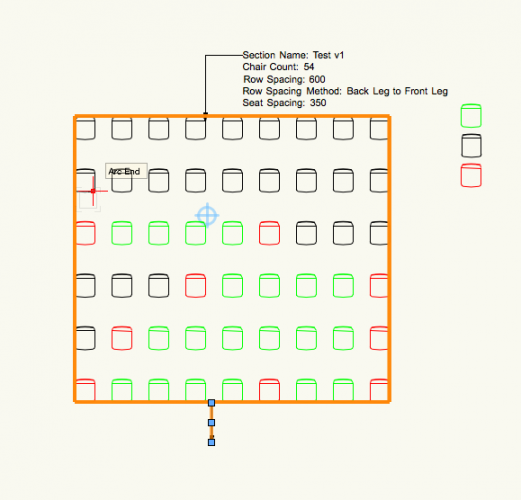
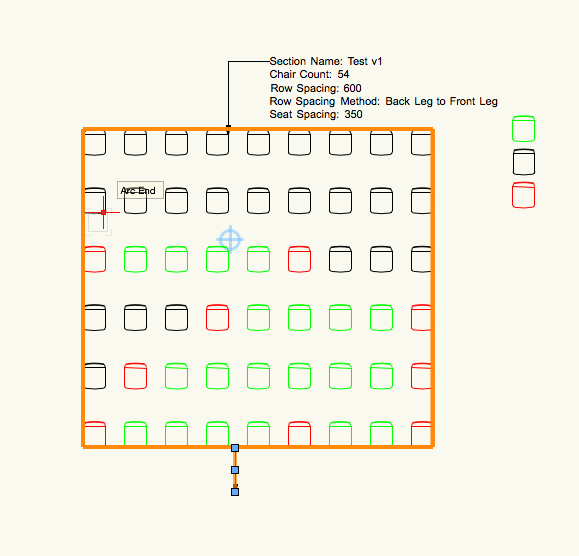
I have been handed a project to auto count seating sections and because of covid restrictions, the seating arrangements that the venue have, in conjunction with their ticketing system cannot (yet) handle the different variations. For instance, for every group of visitors that are in the same "bubble" and who would be allowed to sit together, one seat on either side has to be free. At the moment, this is going to be done manually - yes yes, a right pain in the neck - but I am looking for a way that I can tag each seating section with the different totals of seats, and also the total number of seats. Can I style the tag to recognise the differing symbols that I have used in each section?
In my attached example, the seat symbols are;
black - normal
red - free
green - sold
Am I going about this in the correct/most logical way?
As always, any help greatly appreciated 🙂
-
Hoping for a little guidance
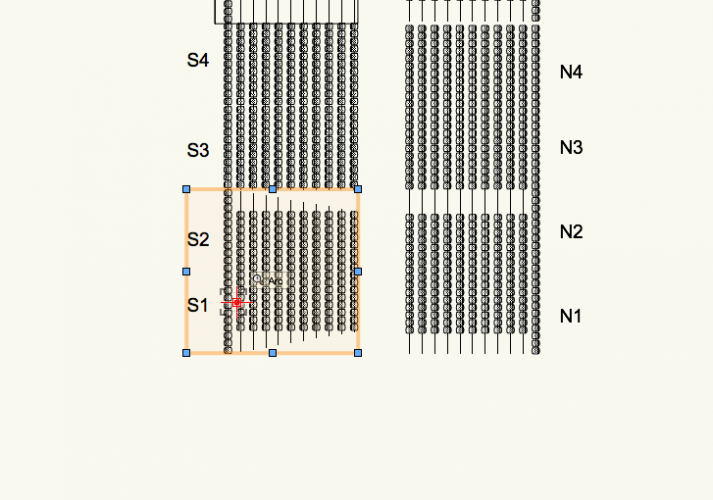
Working with the seating and aisle tools - draw a bank of seating, direction, space the seats, number the seats, name the section - all good so far. Add the aisle tool - again, all good - seating and numbering is as is in situ. I then group the seating bank and the aisles into a group - and all good.
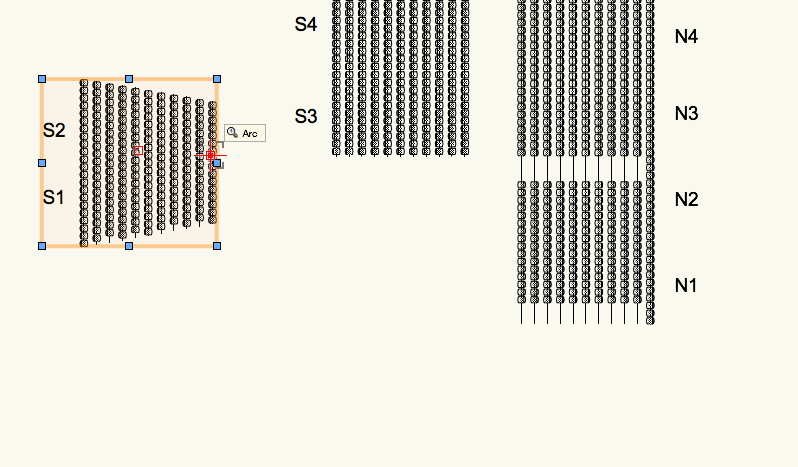
- but, (and here we go 🙂 ) - since these are movable seating banks (in a sports arena - you know the ones - the foldy out tribune ones that can be re-configured to meet demand) whenever I start moving the group around the drawing, the configuration of the seats changes - and only for what I can see as no apparent reason. Even when I hit Cmd+Z, the seating section ends up in some strange place (though I have just tried doing this again, Cmd+Z, to grab a screen shot, but now it seems to work)
Anybody else finding these headaches or is it a known area for bugs within the program itself?
All help greatly appreciated. 🙂
-
@sram27 having the same problem and as a workaround I'm drawing a rectangle over the "clip" and turning that into my viewport.
Have you found the solution to the problem or is it a bug in the new version?
-
hello forum users (first post so go easy :-))
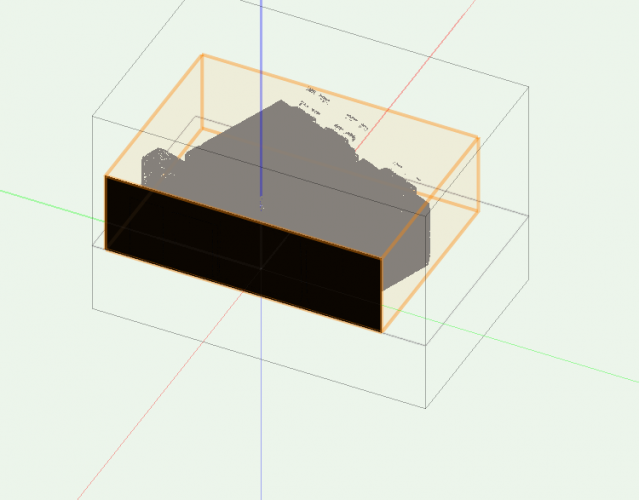
I have been working with a Faro scanner to collect point cloud data. Imported the point cloud into vw (2020) to play with. When I select the clip cube tool, set a clipping side to my desired selection and select "create section viewport", the viewport always seems to come up with a black mask obscuring the desired selection. This is whether I try to place the viewport onto a design layer or a sheet layer.
Is it something to do with the fact that I am manipulating a point cloud rather than other object, either drawn in vw or imported in? I watched a tutorial uploaded 3 years ago that was simply doing what I wanted - but, of course, without the intruding black mask. Below I have added a screen shot to better illustrate my dilemma.
Looking forward to the replies
best regards
Marc
-
No prob. Found it!
Spotlight > architectural > wall projection.
-
Looking into this as well - drawing on top of a .pdf plan of a venue and the walls are all sorts of different widths - is it possible to do this same function in Spotlight? Thanks in advance.


Clip cube section viewport has a black mask
in Entertainment
Posted
@DBCOVW sorry for the lateness of reply and no, I didn't get to the bottom of the problem. I haven't upgraded to 21 yet (end of feb) and am going to be playing with point clouds again at this time - so if you come across a solution/work around, I would greatly appreciate you sharing.
Sorry I can't be of more help