JeremyLondonRMLA
-
Posts
16 -
Joined
-
Last visited
Content Type
Profiles
Forums
Events
Articles
Marionette
Store
Everything posted by JeremyLondonRMLA
-
Point size control for Point Clouds
JeremyLondonRMLA replied to JeremyLondonRMLA's question in Wishlist - Feature and Content Requests
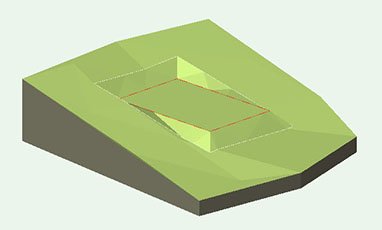
I think the '3 lines' The Hamma is referring to are the 3 axes of the 3D locus itself (see image attached), rather than a display error. There are workarounds for sure, but it would be an excellent feature if the displayed point size could be adjusted. At present it appears to be fixed at 1 pixel per point regardless of the zoom. If a free program like CouldCompare can implement point size adjustment, then I'd assume it's well within the capability of Vectorworks programmers to introduce something similar. If we get enough support for it on this thread perhaps it will make the shortlist for VW 2021!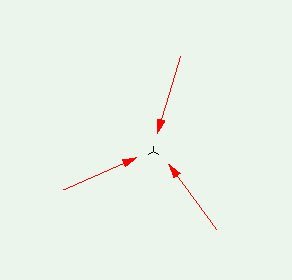
-
An update to this thread: Vlado has confirmed that the issue I encountered, where in VW 2020 Shapefile imports weren't lining up with previous centered DWG imports as they had done in prior versions, was a bug that will be corrected in SP3. He kindly supplied me with a copy of the replacement GIS plugin file for testing, and it works perfectly. With this resolved, previous workflows (and drawings) remain valid, the Geolocate and Geoimage tools offer enhancements, and it sounds like the Align User Origin with Georeferenced Coordinate System tool described by Tamsin will introduce a new and improved workflow for coordinated CAD and GIS file sharing going forward. Thanks again to everyone for your input.
-
You're absolutely right. There are a number of default revision markers available in the Vectorworks library, if you select Replace... in the Style: dropdown menu on the OIP and navigate to the Data Tag > Revision Marker.vwx file. I must confess I didn't even look for any presets, as I was taking the opportunity to learn how the Data Tag worked. I'm not sure if these presets are connected to revision cloud objects in any way, they seem to be independent. Thanks for the info!
-
Hi Chris. You've probably mastered the Data Tag by now. I've just had to work this out myself, so am posting my findings here for anyone who needs it. *Edit - there are default revision marker objects available in the Vectorworks Libraries, see comments below. Thanks E|FA for pointing this out. Read on if you're interested in learning how to create your own* To re-create a triangle revision marker with the Data Tag tool: 1) Place a Data Tag object on the page 2) Un-check Use Leader in the Object Into Palette 3) Click Edit Tag Layout... 4) Place a Text object centered on the insertion point, with a capital letter or digit in your preferred font & point size (eg. 8 pt), with Horiz. Align and Vert. Align both set to Center. * see note below 5) Place a triangle around the text object using the Regular Polygon Tool with Number of Sides set to 3. (for 8 pt Arial font, a 5mm wide triangle with its centre point aligned with the centre of the text object seems to work well) 6) Select the Text object, tick Use Dynamic Text in the OIP, and click Define Tag Field... 7) Change Field Label to 'Revision Letter', 'Revision Number', '#' or whatever you prefer (this is what will appear in the resource browser preview, so # looks tidier because it fits inside the triangle) 8) Click User-entered field near the bottom of the window (which disables the Calculated field option above) 9) Leave Field Type: set to Text, or change it to Integer, and next to Default: enter the letter A or number 1 10) Click OK (the text will change to whatever you chose as your field label in step 7) 11) Click Exit Tag Layout Edit in the top right corner of your screen (the text will change to the default value you entered in step 9) 12) With the newly created Data Tag selected, in the Object Info Palette choose New Plug-in Style from Un-styled Plug-in from the Style: drop down menu 13) Select or create the destination folder where you want to save the new resource, and click OK 14) Beside Style Name: enter a name for the resource, eg. 'Revision Marker', leave all other settings and click OK. The new resource will appear in your resource browser, and you can add it to your library files. 15) When placing an instance of the revision marker, it will appear with the default value entered in step 9. To change the revision letter/number of the placed instance, click Edit Tag Data... in the OIP, and enter the required value. * If you use a lettering system, make the text object in step 4 a capital 'M' to ensure that the triangle created in step 5 fits all possible letters of the alphabet. If you use a numbering system, you'll need to decide if you want to accommodate double digits with your triangle, or create separate larger revision marker resource for revisions 10 and up. The same goes for revisions beyond Z in a lettering system, which typically start again with double letters. Hope this is useful to someone
-
Hi Vlado, thanks very much for your reply. I see what you mean with the previous reliance on the User Origin potentially causing errors. I've always used the User Origin to maintain the true coordinates of received CAD files that adhere to our various regional coordinate systems. I try to always be aware of my User Origin settings, and have instructed others accordingly. But it's true that if the User Origin is moved manually after importing DWG's or Shapefiles (either intentionally or unintentionally), the georefencing of both the CAD and Shapefile exports will be affected. Yes this is precisely the issue I've encountered. A tool/script for Vectorworks 2020 that accurately aligns the georeferencing coordinate system with the existing User Origin would solve it. To be 100% accurate, the re-alignment would need to be based on the exact vector from the Internal Origin to the User Origin, and not introduce any of the rounding that occurs with my manual methods described above. (The values displayed under Geographical location and orientation of Internal Origin might still be rounded, but this rounding shouldn't affect the true position of the georeferenced data's origin). I'll email you shortly. Thanks also Tamsin and Lisa for your input.
-
Hi Tamsin. Thanks for your feedback. For the benefit of anyone following this topic, see my points below The options for Shapefile Import are the ones we're familiar with, but the User Origin has only become irrelevant to the Shapefile import in Vectorworks 2020. In Vectorworks 2019 and prior versions it was recognised, which allowed imported shapefiles to align with previous DWG imports and appear at the correct drawing coordinates without any additional steps. For a drawing/workflow that begins with a Shapefile import and/or georeferencing of the document, followed by a DWG import, the workaround you describe works well and the new tool coming in SP2 will be an excellent feature that makes the process simpler. However neither address the issue of an existing drawing from an earlier version of Vectorworks that began with a DWG import (with the default Center first import ... setting), followed by the subsequent import of a Shapefile, or perhaps the requirement to generate a Shapefile from the drawing data. In the office I work in alone, there are many hundreds if not thousands of existing drawings on the server which were created as above. Shapefiles were subsequently imported into many of them, and/or exported from them simply by georeferencing the relevant layer and exporting. It is entirely feasible that further work and future shapefile exports will be required from this large body of existing .vwx files. As I've described in an above post, the process for generating shapefiles that worked previously will result in incorrectly projected shapefiles from Vectorworks 2020, and the best fix I can come up with generates small inaccuracies. This process requires the document georeferencing to be set up correctly as a first step, prior to any DWG imports, which is perfectly possible going forward, provided the user has a good understanding of georeferencing and coordinate systems and is disciplined in following the process. My understanding is that it's been possible for many years to move the georeferenced geometry toward the Internal Origin by manually entering coordinates under Geographic location and orientation of the internal origin in the document/layer georeferencing tab, and that the Geolocate tool is simply a new, user-friendly method of doing this. Yes that is my understanding also. Up until now the coordinate system was automatically aligned with the user origin for the purposes of import and export (provided that Adjust origin and orientation of georeferenced data to match document coordinates was un-checked), which is what allowed the drawing coordinates and the shapefile coordinates to match. The process you've described for aligning the user origin to the coordinate system will achieve this going forward. It's mainly an issue for existing drawings brought into Vectorworks 2020, and for long-standing workflows based on DWG import (with data centered on IO) as a first step. Thanks again for your time on this. I'm currently liaising with our regional tech support to further investigate how the transition of existing drawings can best be handled.
-
Hi Tamsin Thanks for taking the time to look into this and provide your feedback. I've read through the linked thread and it all makes sense from the perspective of a primarily GIS workflow, i.e. importing, creating, and exporting GIS data, and perhaps subsequently importing and working with CAD files of the same coordinate system. For a purely GIS workflow such as the one you described, I imagine that adjusting the User Origin in step 4 isn't even required, as long as you set the Stake object to display lat/long values instead of document units in step 8. However in either case I don't think it offers a solution or workaround to the issue I'm describing, where an imported CAD file generates an offset user origin, which subsequent shapefile imports and exports adhered to by default in previous versions of Vectorworks, but no longer do. One significant effect of the change is that a drawing with an offset User Origin created in VW 2019 or prior, which previously exported correctly georeferenced shapefiles (without requiring any use of the Adjust origin and orientation of georeferenced data to to match document coordinates function), no longer does so if the drawing is opened in Vectorworks 2020 and the same shapefile export is attempted. Furthermore, if the user re-imports their generated shapefile back into VW 2020 to double-check the data, it will appear to be correct as it is now being both exported and imported by VW 2020 relative to the Internal Origin. However when imported into a GIS program such as ArcGIS or QGIS, the data exported from VW 2020 will be in the wrong place. In theory this could be manually corrected by taking note of the document coordinates at the Internal Origin, converting them to lat/long in an outside program, activating the Adjust origin and orientation of georeferenced data... option, and manually entering the lat/long values. Alternatively, if your georeferencing in the original file was done through shapefile import, and you still have access to that shapefile, you could work out the lat/long by importing it into a new .vwx drawing, drawing a reference line in the original drawing from an identifiable point on the shapefile to the internal origin, copying the reference line into the new drawing and snapping it to the same point, and placing a Stake object set to lat/long mode on the other end of the reference line to obtain the required values. However, both approaches introduce multiple new steps to what was previously a simple process, and also introduce minor rounding errors resulting in slightly misaligned shapefiles, when compared with shapefiles generated from the same drawings by previous versions of Vectorworks. In step 4 of your workflow in the linked thread you describe an Align User Origin with Georeferenced Coordinate System option. Out of interest, can you please direct me to this tool, as I can't seem to find it, or any reference to it on the Help website. To maintain the workflow and functionality offered by previous versions, and allow smooth transition of older drawings into VW 2020, I believe what's needed is an option that does the inverse of the one you describe, i.e. aligns the georeferenced coordinate system with the User Origin. Or alternatively, restore the 'old' system which handled GIS data this way by default. Kind regards
-
Hi Team. In previous versions of Vectorworks Landmark the User Origin is recognised by the shapefile importer & exporter as the 0,0 point for GIS data. This allows shapefiles to be generated directly from drawings which have an offset User Origin through a previous CAD file import (eg. from a civil engineer or surveyor). You simply georeference the layer to the coordinate system of the received CAD file, and export. It also allows a shapefile imported into an existing drawing based on a previously imported CAD file to appear in the correct position, provided that the shapefile and the CAD file share the same coordinate system. In Vectorworks Landmark 2020 I've found so far that both the shapefile import and export functions ignore any User Origin settings, and handle GIS data relative to the Internal Origin only. This prevents a shapefile from being correctly exported from a drawing with an offset User Origin (through previous import of a surveyors CAD file), and results in shapefile data imported into drawings with an offset User Origin appearing at the wrong numerical coordinates within Vectorworks. Perhaps for technical reasons the introduction of the new Geolocate and Geoimage tools required this separation of GIS and CAD workflows, but it certainly seems like a step backwards in terms of CAD/GIS integration. I'd be interested to hear other's thoughts.
-
Point size control for Point Clouds
JeremyLondonRMLA replied to JeremyLondonRMLA's question in Wishlist - Feature and Content Requests
Hi Andrew. Nice work. Hopefully we see the point size adjustment functionality added to Vectorworks sometime in the near future. Regarding the workflow I described above, the point clouds I've used in the past also had millions of points. I use CloudCompare to identify only the subset of points that are important/relevant to my work, give them descriptive names, and export them to .txt file for import into Vectorworks as stake objects. (They can be displayed concurrently with the original point cloud for reference if required). If I find that I need the coordinates of additional points, I go back to CloudCompare and add to my existing list, or create a new one, and export again. -
Point size control for Point Clouds
JeremyLondonRMLA replied to JeremyLondonRMLA's question in Wishlist - Feature and Content Requests
Hi Andrew. No unfortunately not, I'm running Vectorworks 2019 SP3 and there still seems to be no control over the point display size. As a workaround, the CloudCompare software I mentioned in the above post allows you to select points and add their coordinates to a custom spreadsheet, which can then be exported as a .txt file and imported into Vectorworks using the Landmark > Survey Input > Import Survey File command. I hope this is helpful. -
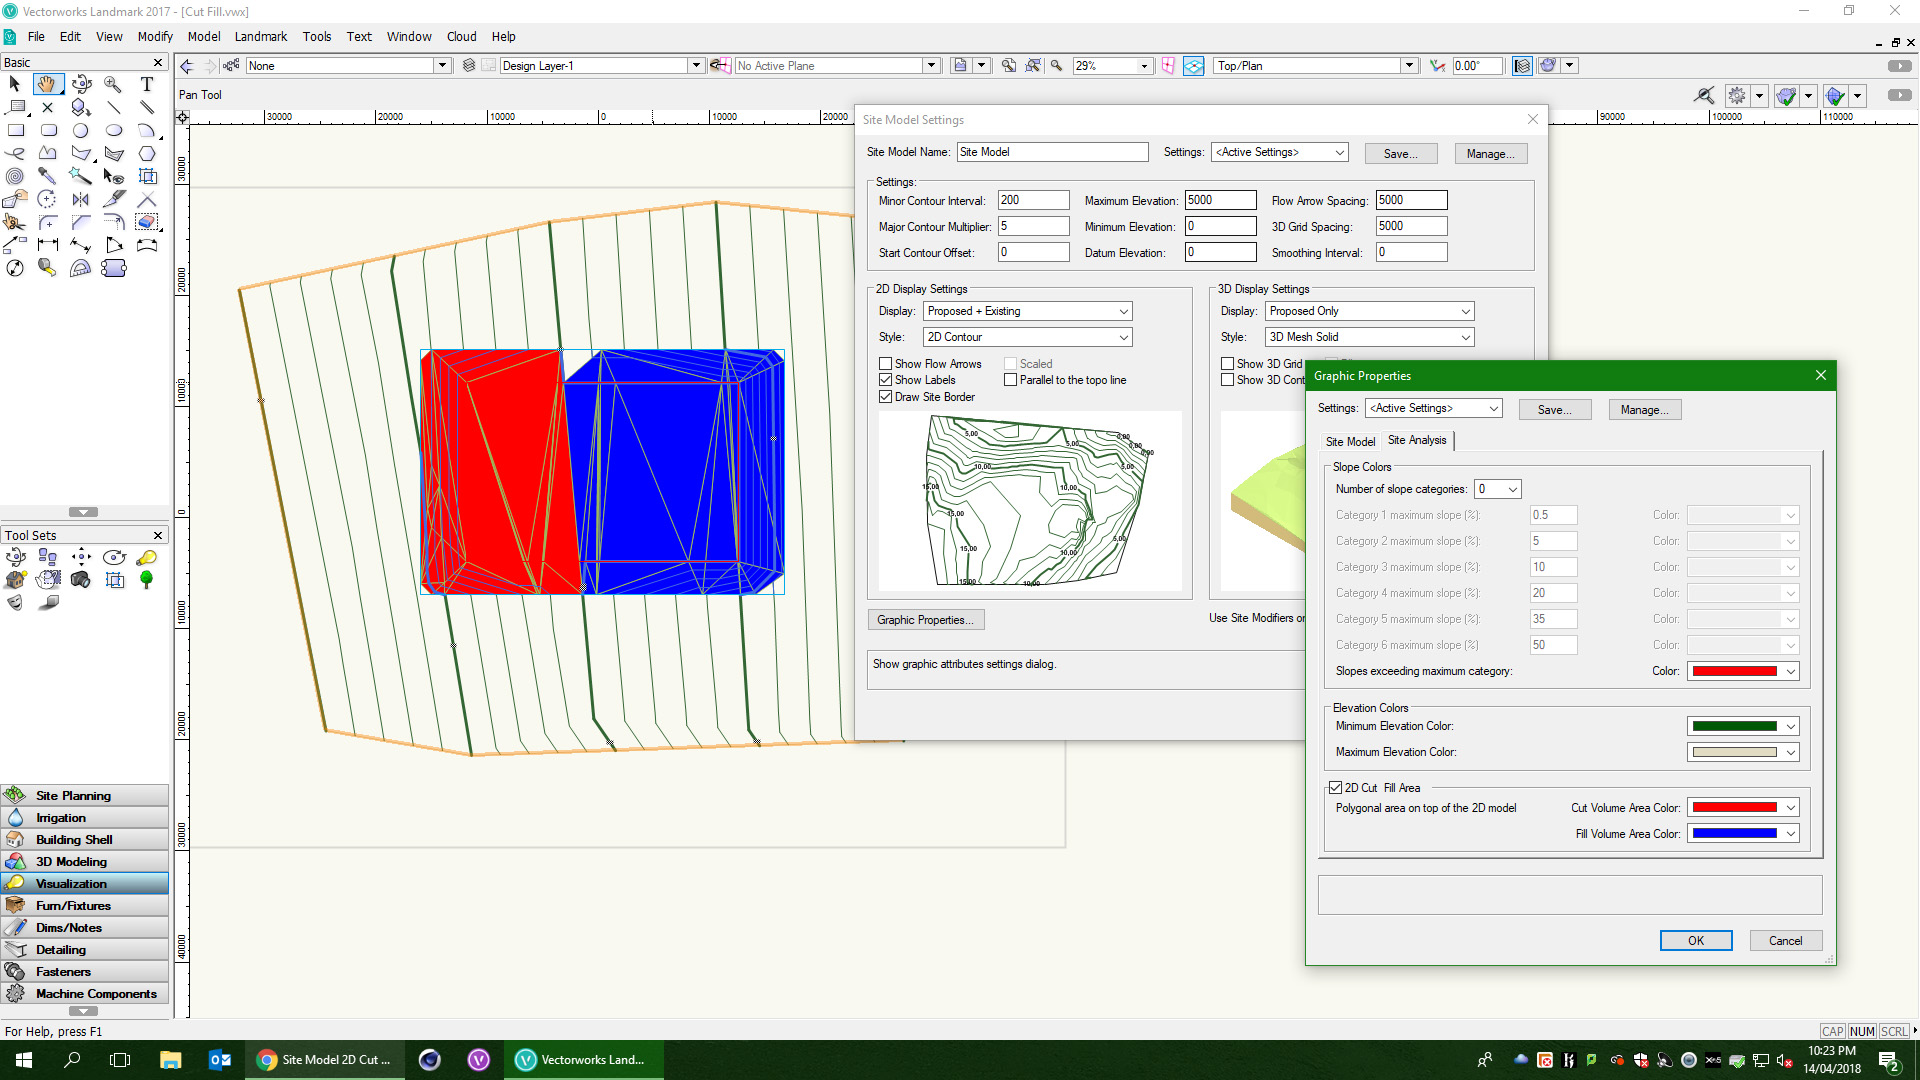
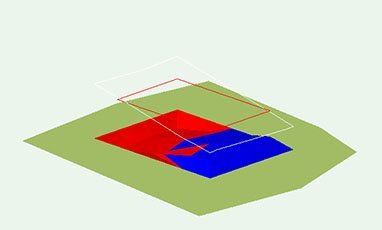
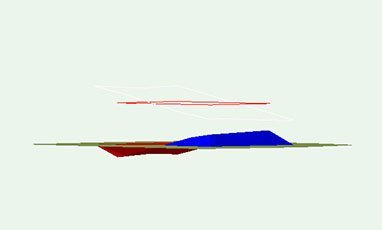
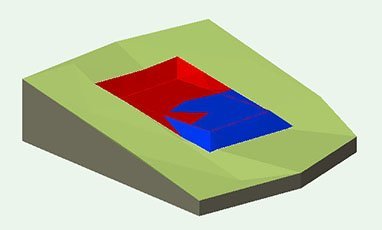
At present the Cut and Fill 3D Display option for site models shows areas of cut & fill relative to the zero plane only. See below screenshots of a basic site model with 3D Display set to Proposed Only > 3D mesh, and the same site model with 3D Display set to Cut and Fill (one view from the same angle, and a flatter view to show more clearly what's happening). With 3D Display set to Cut and Fill, the un-modified terrain surface is flattened and cut & fill volume are shown as projections below & above it, while the site modifiers (and any other 3D objects in the scene) are left floating above it at their true heights I realize that this is intentional, as a tool for visualizing the volume of cut & fill. However, I don't find very helpful for visualizing where areas of cut & fill are located in relation to the topography, and other proposed features eg. buildings, roads, trees etc. I'm aware of the 2D Cut Fill Area function located in Site Model Settings > Graphic Properties > Site Analysis, but I think it would also be very useful to have the option of displaying areas of cut & fill in context on the surface of the proposed 3D terrain, see example below. As far as I can tell this display option is not currently an option anywhere in Site Model Settings. I created the below image manually by duplicating the site model, activating 2D Cut Fill Area, converting the site model to a group in Top/Plan view, extracting the red & blue polygons, and converting them to texture bed site modifiers. Currently this process would need to be repeated each time the site model is modified. If this functionality was to be added to to the Vectorworks Site Model, I'd suggest that the Style: selection box (which is currently grayed out when Cut and Fill is selected above), includes two options such as 'Relative' or 'Volume' mode (volume displayed relative to 0), and 'Area' mode (area displayed on terrain surface). At present texture beds and textures applied to the site model are not shown when 3D Display is set to Cut and Fill. The site model reverts to the 3D Triangles colour specified in Site Model Settings, and it could remain this way with the addition of the Area mode described above. If it was also possible to add an option to display cut & fill over the top of textures and texture beds it would be extra useful, preferably with an opacity slider for revealing the texture beds beneath.

-
- 2
-

-
- site model
- cut fill
- (and 1 more)
-
Point size control for Point Clouds
JeremyLondonRMLA posted a question in Wishlist - Feature and Content Requests
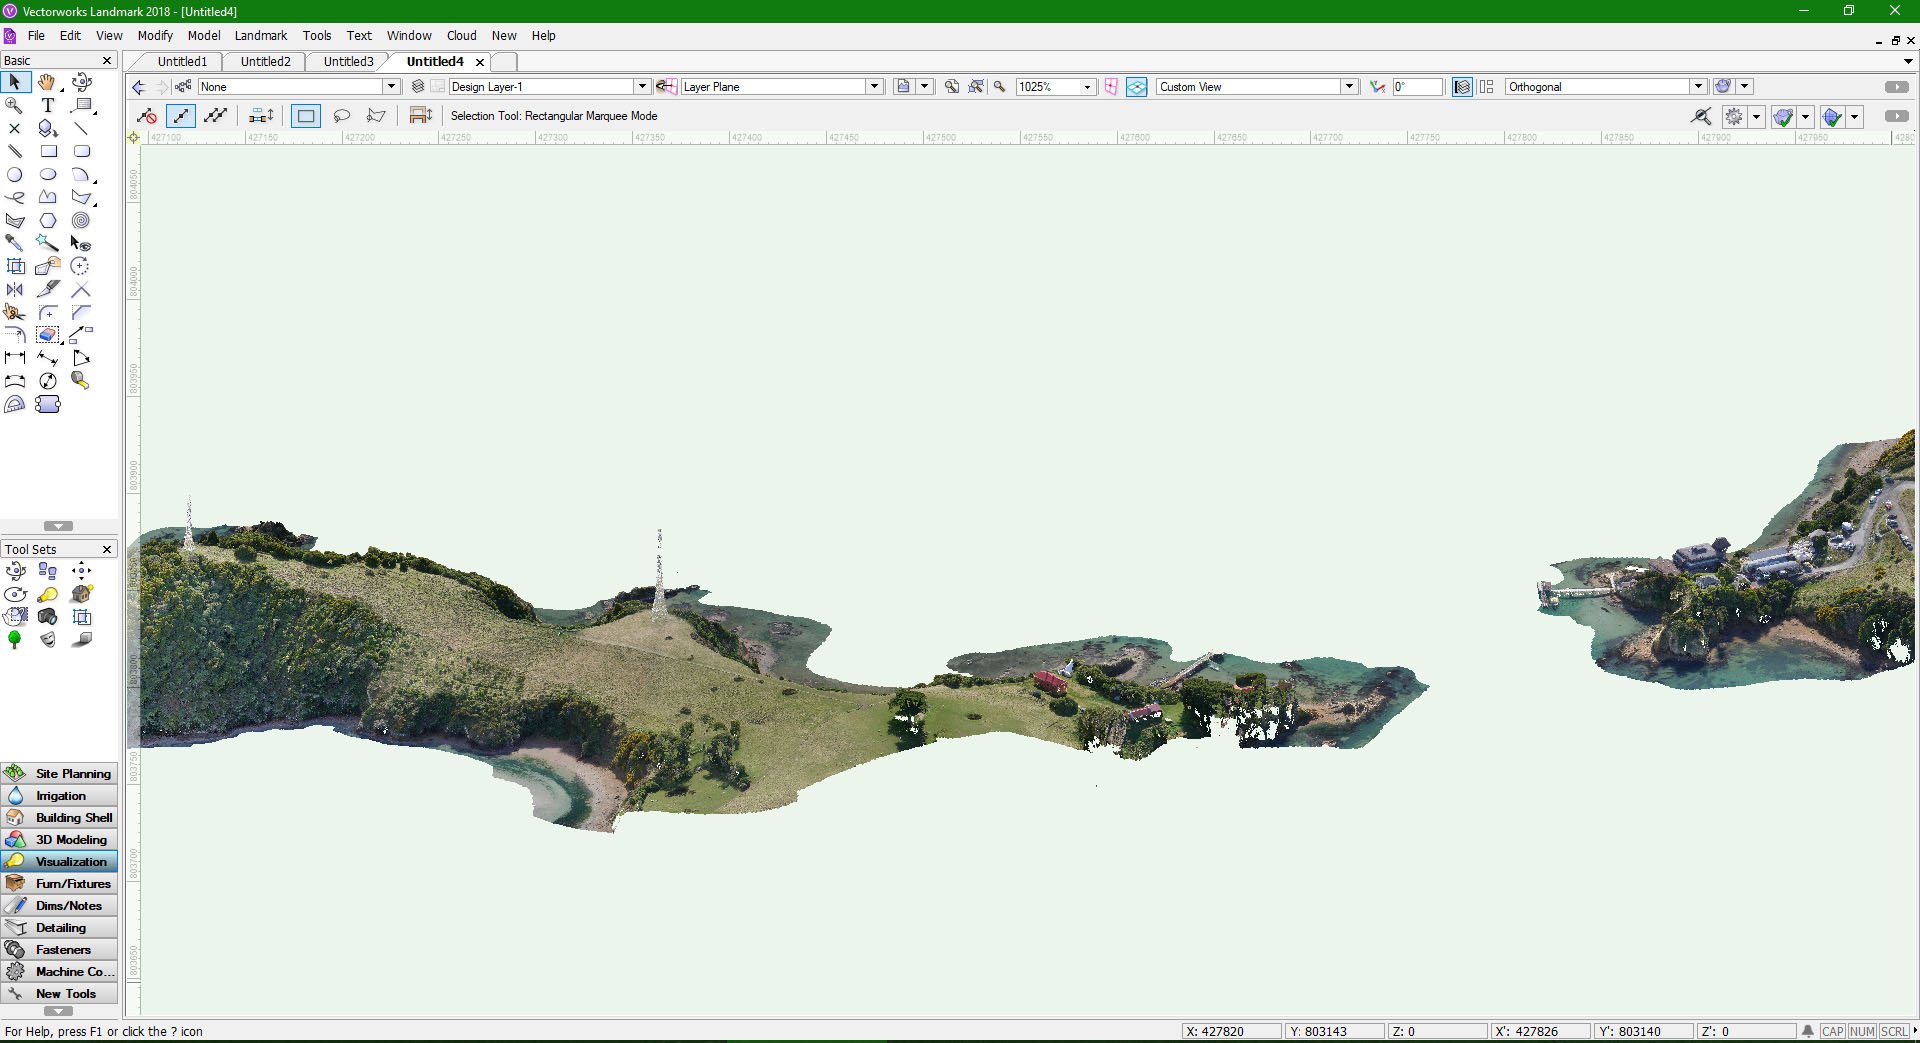
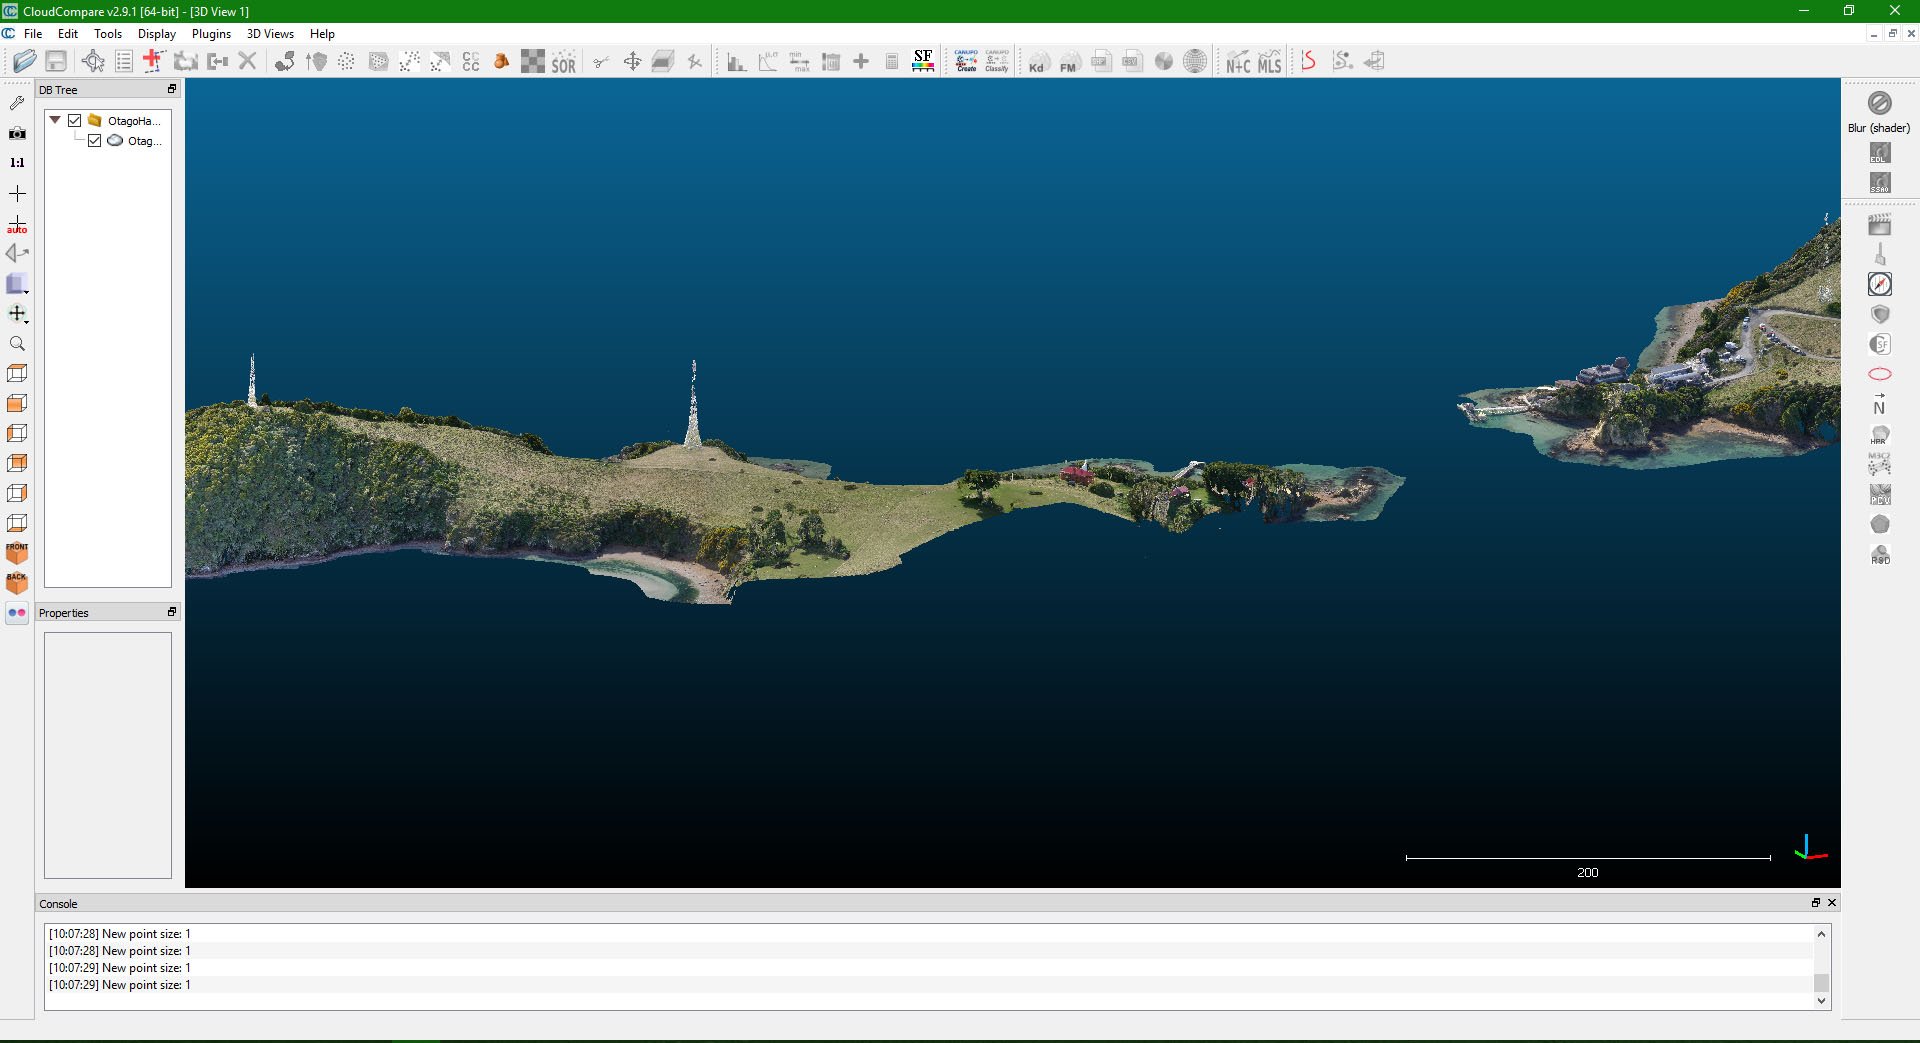
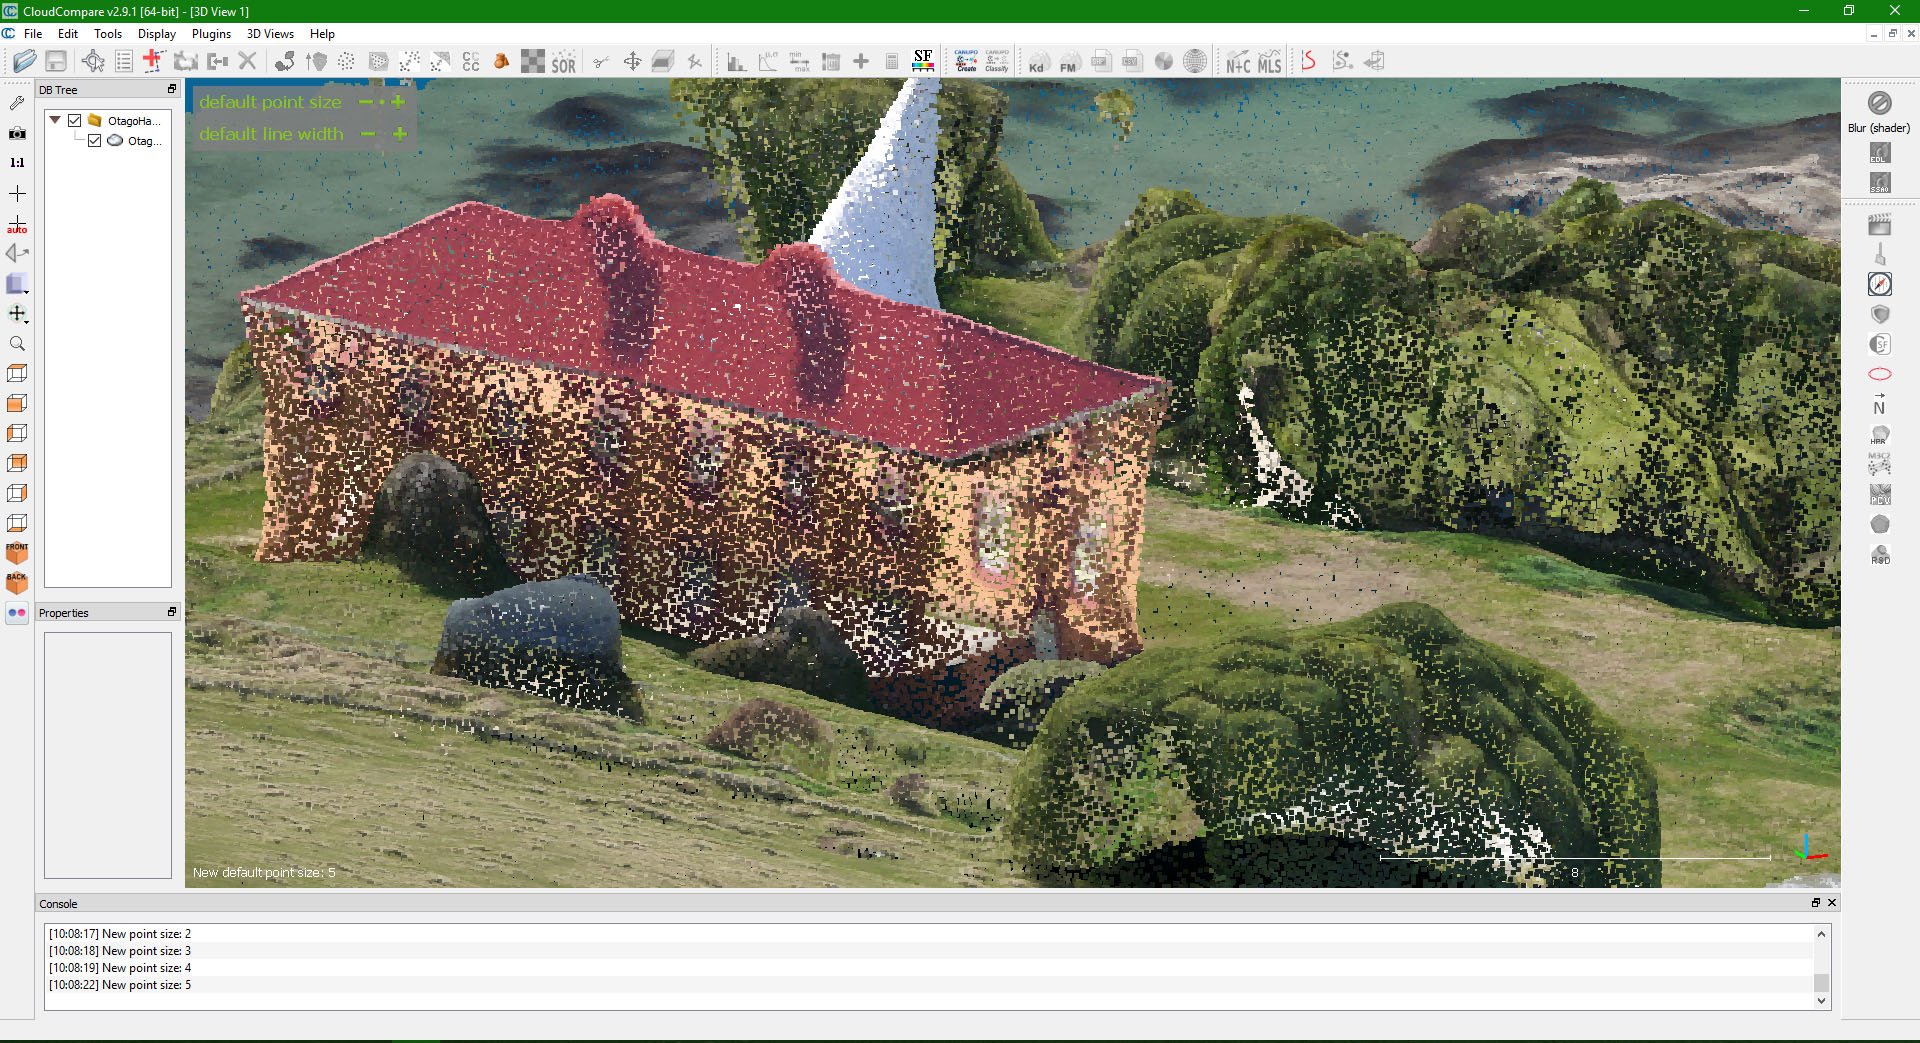
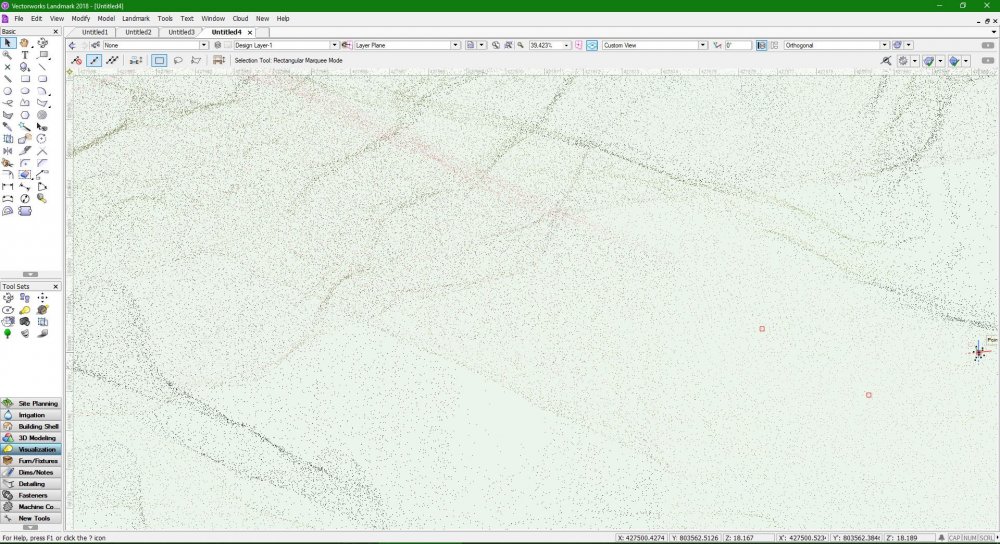
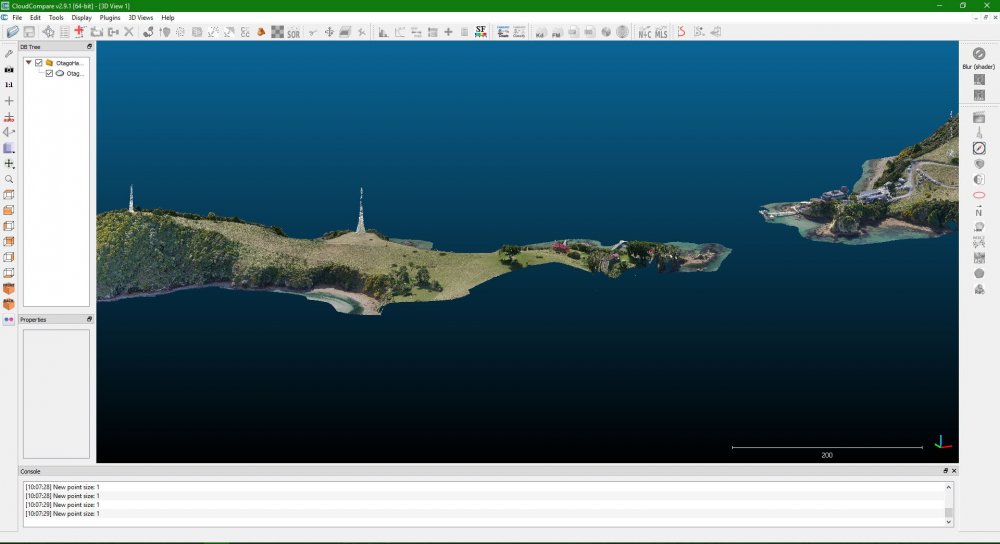
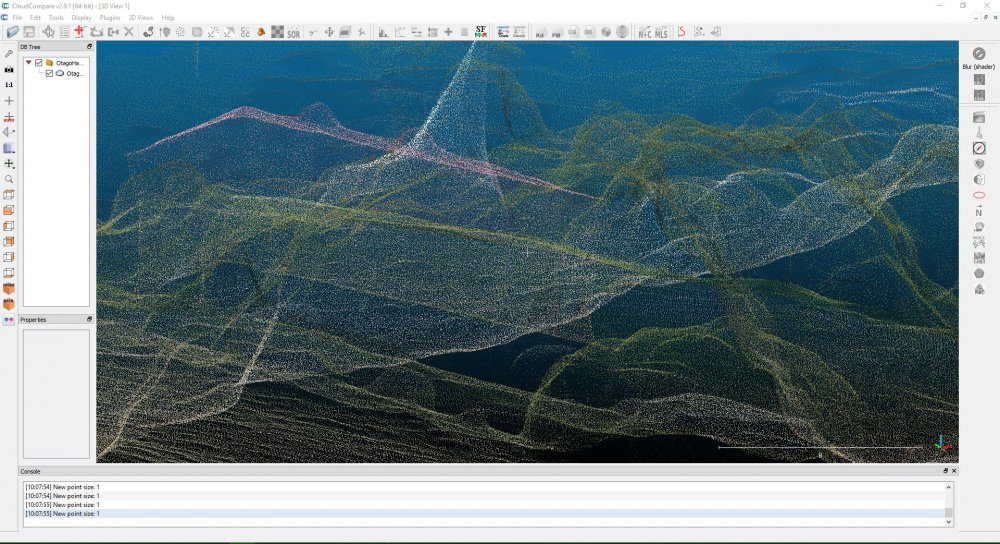
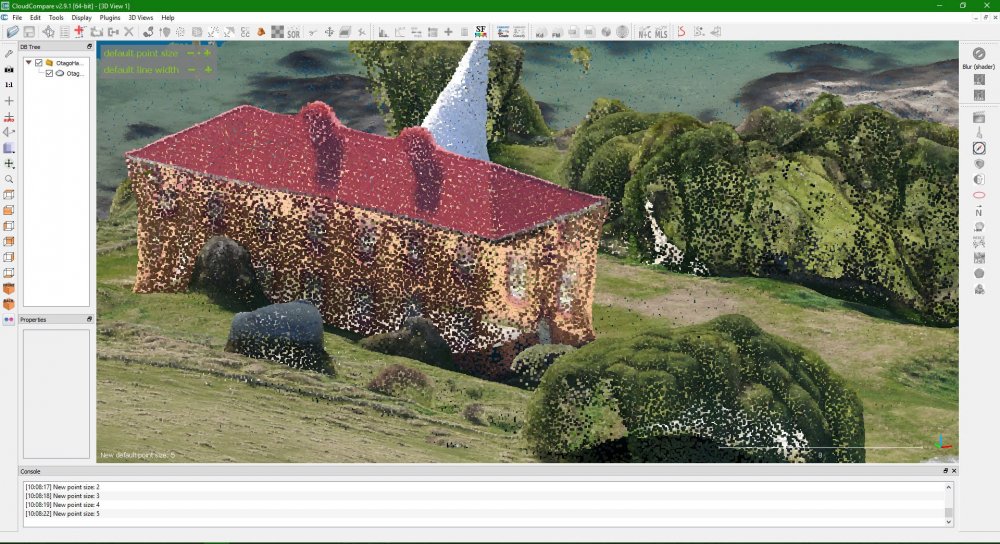
Does anyone know if there's a way in Vectorworks to adjust the point display size on imported point clouds, such as LAS files. At present I find that point clouds display well at a distance, see attached image 1, but when I zoom in to inspect closely and snap a 3D locus/stake object to a point to confirm its coordinates, the point cloud becomes very difficult to interpret due to the sparsity of points against the surrounding background, see attached image 2. I've tried adjusting the pen thickness of the point cloud object in the attributes pallette / class settings, and searched in Vectorworks Preferences for any relevant settings, but had no luck so far. I've discovered a very useful open source program called CloudCompare for the inspection of point clouds. This program allows the user to adjust point display size which really helps with interpretation at close range, see attached images 3-5. Note the 'default point size' adjustment buttons in the top left. If similar control over point size display could be added to Vectorworks I believe it would greatly improve the point cloud workflow.
-
Site Model 2D Cut & Fill Display Not Working in VW 2018
JeremyLondonRMLA replied to JeremyLondonRMLA's topic in Site Design
Hi Tamsin. 3D Cut and Fill is working fine for me also. I'm referring to the 2D Cut Fill Area option in the Site Analysis Tab of the Site Model Graphic Properties. See attached screenshot from Vectorworks Landmark 2017, showing the expected 2D site model appearance with this option selected. It appears there may currently be a bug preventing this option from being activated in VW 2018.
-
Hi Team. I've encountered an issue with the Site Model 2D Cut & Fill display in Vectorworks Landmark 2018. When I tick the 2D Cut Fill Area option under Site Model Settings > Graphic Properties > Site Analysis, and exit the settings window by clicking OK, nothing happens. When I open the Site Model Settings window again 2D Cut Fill Area has been automatically un-ticked. In Vectorworks 2017 and previous versions this doesn't occur. Following the above steps adds red & blue cut & fill areas to the Site Model 2D display. Has anyone else encountered this same problem? Regards Jeremy
-
#1 - The current workflow for editing the Roof Edge Shape of a massing model roof (switching between eave/gable/dutch hip) involves ticking Use Custom Roof from Profile in the OIP, and then selecting Edit Massing Model from the Modify menu, and entering an isolated editing view where the building itself isn't visible. This workflow would be greatly improved if the Roof Edge Shape could be directly edited on the massing model, with the context (ie. building walls) remaining visible, and without having to navigate a separate menu. #2 - A custom roof on a massing model currently remains floating at the height specified when the massing model was first created, and needs to be manually raised / lowered to match any changes in the massing model height. This occurs even if the massing model height is adjusted prior to ticking the Use Custom Roof from Profile box for the first time in the OIP. To improve workflow efficiency the height of a custom roof should be automatically controlled by the height parameter of the massing model it is attached to. If suggestion #1 above was implemented, this problem would also be resolved. #3 - The height parameter in the massing model object currently relates to the height of the walls only. The total height of the building (including the roof) cannot be directly specified, nor is it displayed in the OIP as an automatically generated field. Total building height is unknown, and for any given Height value, it varies depending on Roof Thickness, Roof Slope, & custom roof configuration (see #1 above). In urban design situations, both Architects and Landscape Architects frequently need to work to maximum building heights determined by councils, consent rulings etc. At present, to confirm the total height of a massing model (including the roof) one must switch to front view, manually measure the height of the massing model, and make incremental adjustments to Height, Roof Thickness and Roof Slope to achieve the target building height. My suggestions to remedy the above, and make the Massing Model Object useful for Urban Design applications, would be as follows: 1) At the very least, OIP to display the following information: ‘Floor Height’, ‘Roof Height’ and ‘Total Building Height’, so that manual adjustments to building height can be made far more efficiently than at present, by referring to the OIP. 2) Ideally, add the ability to control the Massing Model geometry with the following parameter combinations: a. Floor Height & Roof Pitch (total height determined automatically) – available at present, but total height not displayed in IOP b. Total Height & Roof Pitch (floor height determined automatically) c. Total Height & Floor Height (roof pitch determined automatically) *Roof thickness remains independent and influences the automatically generated fields, as it presently does in scenario a.
-
- 2
-
-
- massing model
- editing
- (and 2 more)
-
Send to DTM Surface - Existing vs Proposed
JeremyLondonRMLA replied to willofmaine's topic in General Discussion
I've encountered the same problem over the years, and just found a solution. If the Site Model 2D Display is set to Existing Only or Proposed + Existing it seems to confuse the Send to Surface command, causing it to send some object types to the Existing surface, even when the 3D Display is set to Proposed. To resolve the issue, temporarily set the Site Model 2D Display to Proposed Only when sending objects to the surface, and then change it back again if required.