


dominijk
-
Posts
27 -
Joined
-
Last visited
Content Type
Profiles
Forums
Events
Articles
Marionette
Store
Posts posted by dominijk
-
-
@Pat Stanford Resolved with help of your other post >
-
Made sense but didn't know where to find these, for benefit of others...
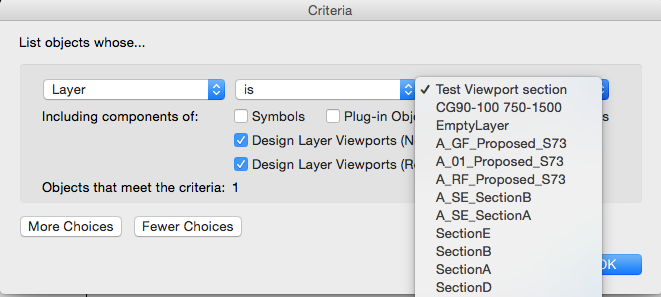
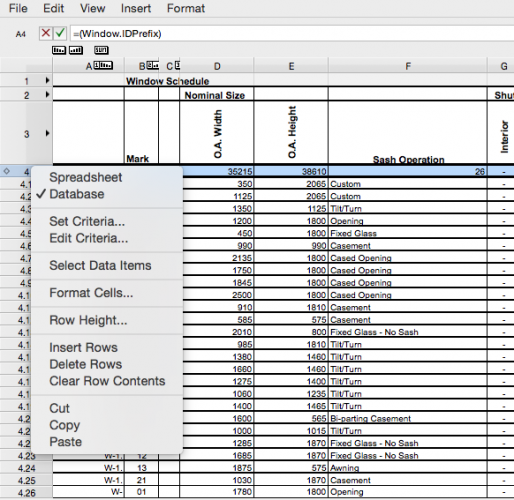
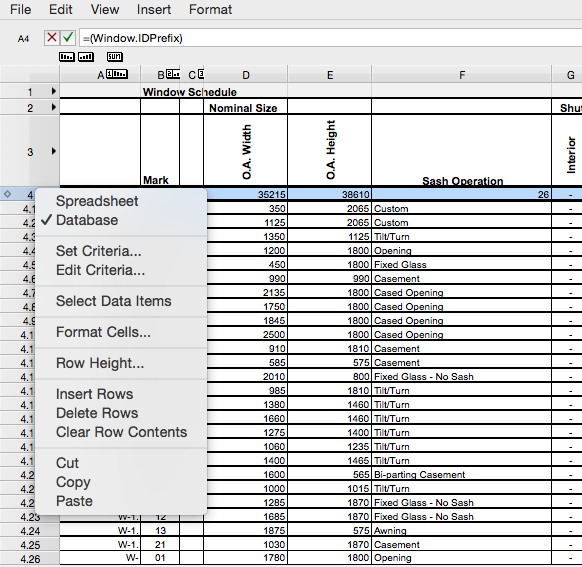
In your window/door schedule, right click on the row with the column headers. Then (as screenshot) you'll be given option to set/edit criteria this then brings up the option to choose which layers the schedule is generated from
-
@Pat Stanford How do i edit the database criteria? Im on 2016 and don't see this option using the default window schedule option from the tools menu
-
On 4/7/2011 at 1:04 AM, Pat Stanford said:
I bet it is on both a design layer and in a viewport on a sheet layer.
Edit the database criteria to specifically select the layer you want to count on.
How do i edit the database criteria? Im on 2016 and don't see this option using the default window schedule option from the tools menu
-
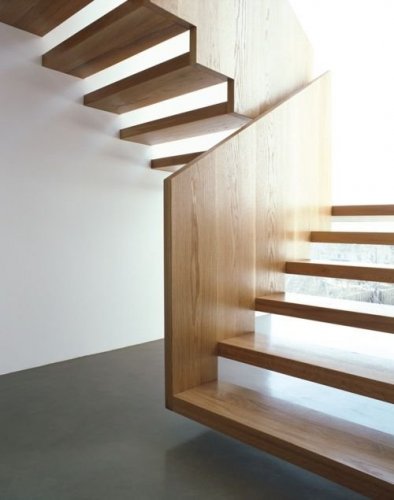
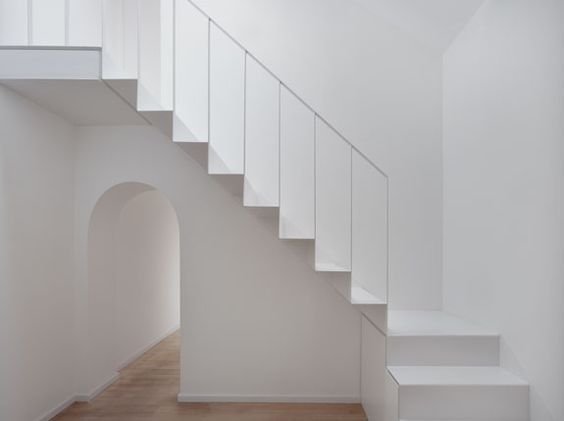
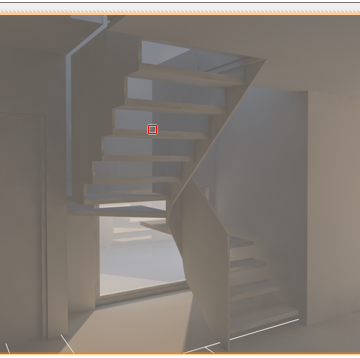
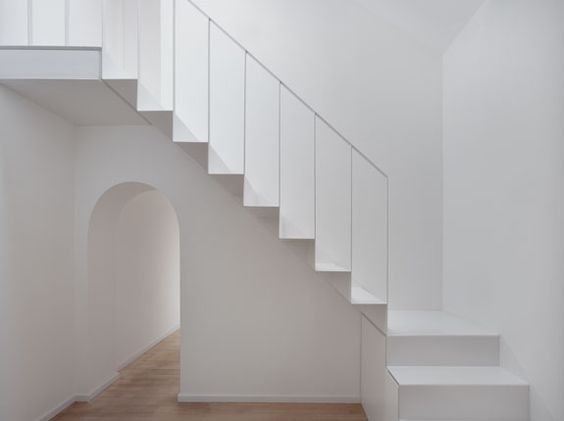
I can get part way clipping the wall to the stair but this only works in part as top flight in picture. I'm still struggling on the lower flight i could use the wall and clip it to a roof slope but that seems somewhat protracted method.

-
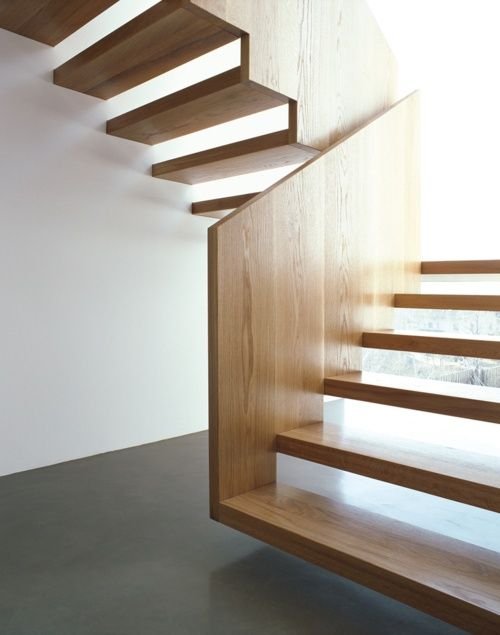
Part 1 - How might i go about getting a string to follow the riser profile as the below? I think with custom stair i could set the stringer to a class that is invisible or i turn off
Part 2 - Could i get a solid guard rail to follow the riser profile at its base?
-
 2
2
-
-
Did you find an answer to this? I have the same query
-
@Jan-Burger TROOST Thanks Jan, I understand the benefits of a presentation layer but was hoping to take this one step further with the files split. The model is already quite large and complex so my concern was that adding cameras and additional content would make the file slower with greater risk of corruption.
-
@Jan-Burger TROOST how can i select a camera from a referenced file?
-
I have a model file in which the 3D model exists and i've added some renderworks cameras for the views i want. My normal work flow for 2D drawings is to have a separate print file which references the model. Can i get a comparable work flow for renderworks through either;
Adding the renderworks cameras in the model file to viewport in a print file - i can't see how to do this
Add new renderworks cameras to a print file that references the model - have attempted but nothing shows
-
@grant_PD on the default all three are set to 0 and this works but in my example it caused an overlap, do you know why that is?
-
1 minute ago, grant_PD said:
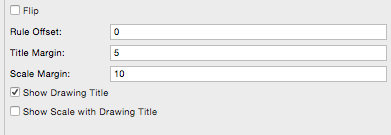
it's called the scale margin. I've had it reset itself a few times as well.
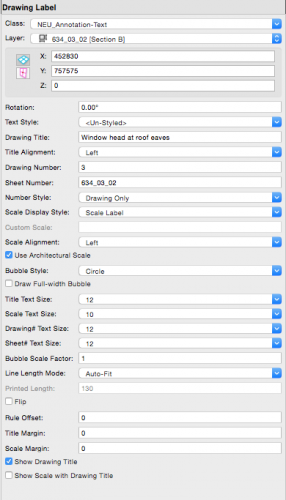
Thank you, for anyone else coming to this the three options below control the spacing of the lines of text

-
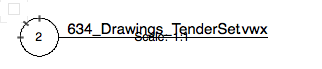
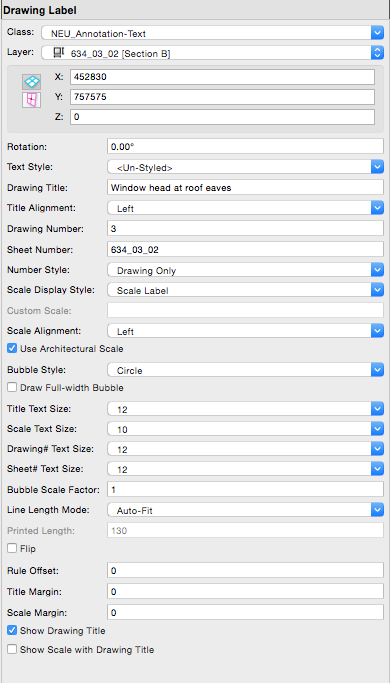
As the below when i insert a drawing label the two lines of text overlap, i don't get this in a new file but don't really want to have to redo all the sheets and viewports i have and can't seem to find how to control where the text lines are positioned. Have also provided screen grab of the label settings
-
Thank you, that works. Although i realise that as I'm referencing the model into a print file the section method is quite handy for naming drawings and managing that process
-
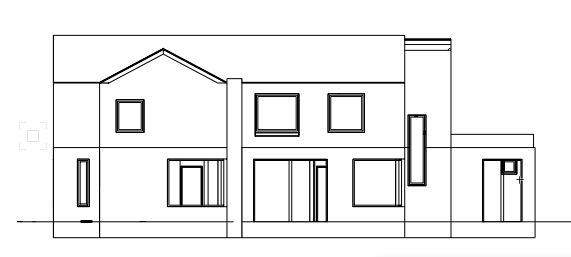
I have a model that is drawn to real world rotation, its an orthogonal building. When i set up viewports i therefore get elevations that show the true elevation with some walls in perspective, as below.
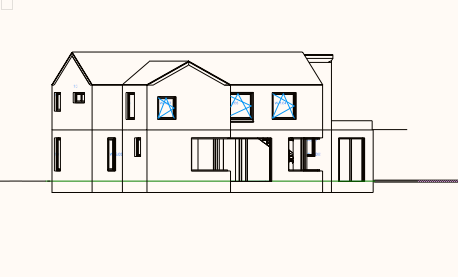
What i want however is a traditional projected elevation, as below. To get this at the moment i'm using the section tool.

My question is whether i can just use a normal front/rear view. I could rotate my model so that it is aligned with north but then any shadows will be wrong. It seems there should be a better way to do this that maybe i haven't seen. What do others do?
-
Lept before i looked this is what i was looking for, works a charm
-
I can see many posts on this subject on the forum but struggling to find one that resolves what i'm trying to do. I'm on VW 2017 Architect. I have a list of classes named
abc-part1-part2
and want to change all these
def-part1-part2.
Effectively stripping the old prefix and replacing with new, I've done this on 2016 but can't remember whether it was a plug, script or something else. Any pointers gratefully aprpeciated
-
Thanks Pat, i thought it was probably something straightforward.
-
Plus one for this, want to be able to call everything we can do and see on screen into a record
-
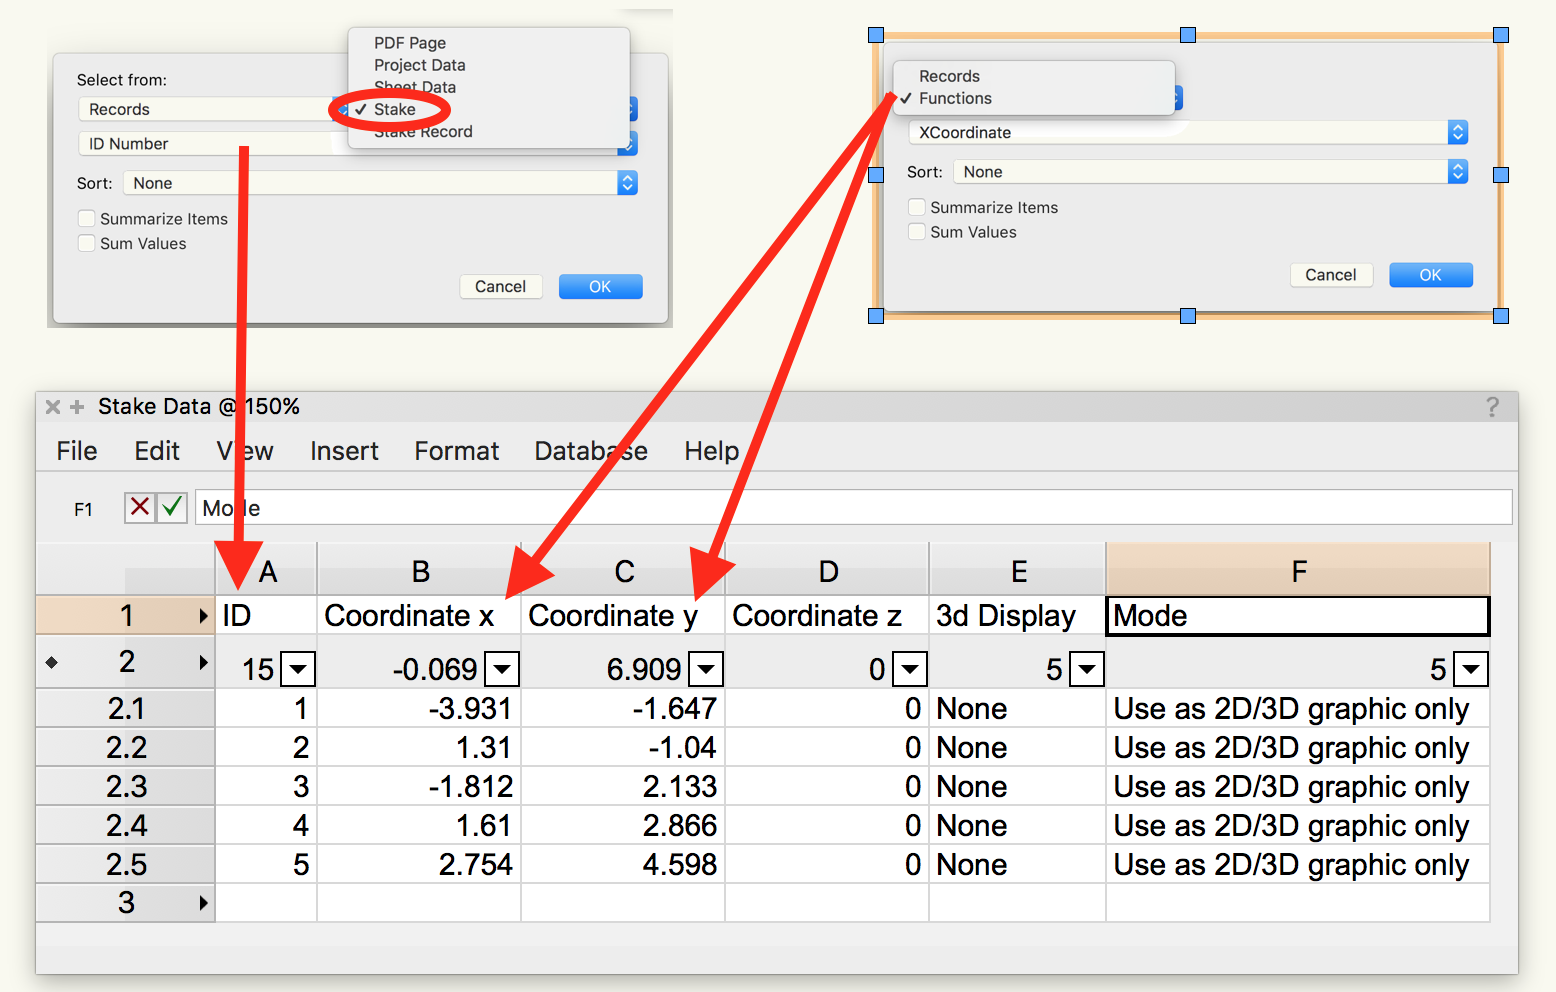
To clarfiy what you did - you added a stake then went to report function then added a column in the report using =xcoordinate?
-
On 1/30/2018 at 8:19 AM, Benson Shaw said:
Yes, confounding to me that the records for stake include z Value and many other things but, apparently, not the xy or their Northing Easting equivalents.
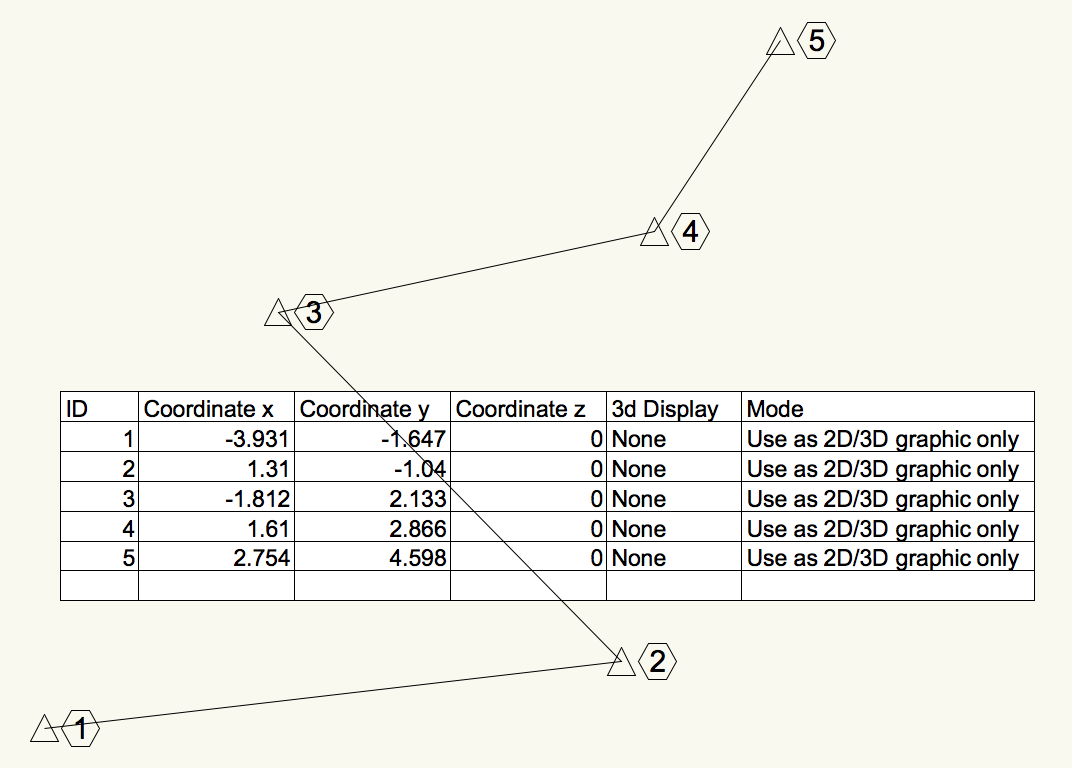
A close workaround is the x and y coordinate items in the Function list, instead of the Record list. My Row 1 is spreadsheet text. My Coordinate X and Y columns could be relabeled Easting and Northing. Everyone using the worksheet would have to agree that negative values mean the opposite direction. eg x= -3.4 means W3.4 y= -4.5 means S4.5. There may be a way to show neg values as S or W by calling the natural number rather than the integer value and a new column for the NSEW designation calculated for each stake by some "if x coordinate is less than zero, then S" etc. Others will have to provide that knowledge. Pat S? MichaelK?
If there is Northing/Easting in the Records>Stake or Records>Stake Record lists, will one of the worksheet geniuses please point it out! Pat S? MichaelK?
Anyway, HTH
-B


Could you post your file, as my question on the forum i'm having trouble with my coordinates.
-
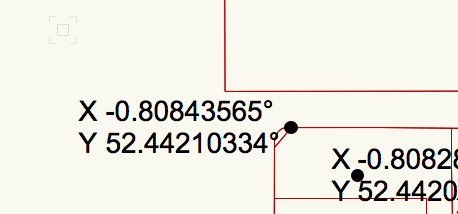
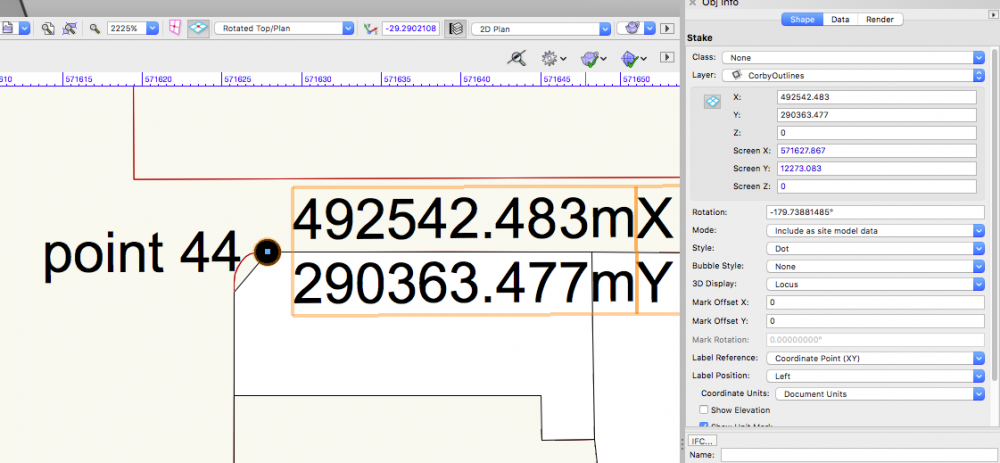
Originally i was trying to get long and lat coordinates from a stake object, which you can get the stake object to show but this information doesnt appear in any of the fields when you build a report.
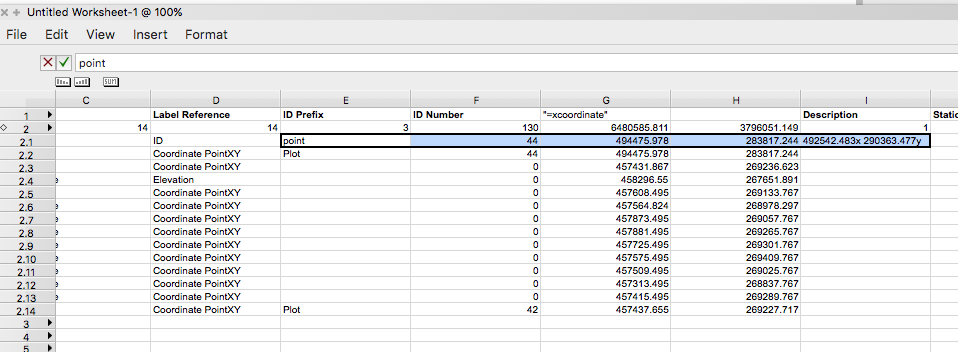
In place i can use a northing and easting coordinate in metres, which should be simple. However although (as screen shot) the stake shows the right xy position and the object info palette tells me this is where it is located within the document coordinates when i run the report (plot 44 on screen grab) the coordinate i get using formula =Xcoordinate is a different number, what's happening to cause this?

-
As described in the title. I have a sheet set up which shows only spaces objects, when i try to print / publish / export this causes vectorworks to freeze and become unresponsive. Is this a bug? I'm on mac VW 2016 Architect SP4
-
On 9/27/2016 at 8:23 PM, JimW said:
Looks like an oversight, in 2016 under "Edit" you could rename it in the Data field, but we moved the Name to a constantly visible field in 2017 and the Nav palette Edit UI wasn't updated to include that.
Submitting as a bug now.
VB-136963
Hello and thanks for response on last query, i'm confused on this as well. If i use a the built in drawing title symbol then it takes the [Drawing Title] field in the viewport OIP. However this only works if i name viewport then add title. If i duplicate a sheet and then rename the viewport the drawing title symbol does not update , is the field not a live link?


Wall Schedules - Removing unwanted walls-
in General Discussion
Posted
@Markvl When you ran the default schedule how did you prevent it from giving multiple entries for the same wall type, which is what i get..