Tim C.
-
Posts
135 -
Joined
-
Last visited
Content Type
Profiles
Forums
Events
Articles
Marionette
Store
Everything posted by Tim C.
-
@Ian M. Hi Ian, when you switch to Wireframe can you continue to work or is the render blocking you? We do have a few rare cases where the teapot can get stuck in an ON state, even though nothing is actually being rendered. You can usually continue working as normal, and I've found that switching to a sheet layer and then back will usually make the teapot go away. Does that seem to be the case for you? If not, would you mind checking your CPU usage to see if it actually seems to be processing a render when in that state? You can see this in Activity Monitor on Mac and in Task Manager on Windows. If it's actually rendering something you should see much higher than normal CPU usage. Thanks!
-
Just to clarify, you want each face of the solid to be its own Extrude with a 0" thickness? There's no way to automatically do this but if you use the Extract tool it should speed up the conversion process a lot (you may know this already). Try the tool's Extract Surface Mode mode and enable the "Create Planar Objects" option in the tool prefs, then you can just click on every face in succession and quickly create a series of 2D polys. Then select each poly and CMD+E with a 0" thickness to create Extrudes. Hope this helps!
-
@Anders Blomberg Hi Anders, glad to hear that the tool is saving you time! The alignment can be a little tricky and we're actively working on making it more user-friendly. Would you mind sending me a copy of this VW file so we can give this a try? My first thought is that the "2D PLAN" Text object may need some constraint adjustments, but it's hard to tell for sure without seeing the file. Thanks!
-
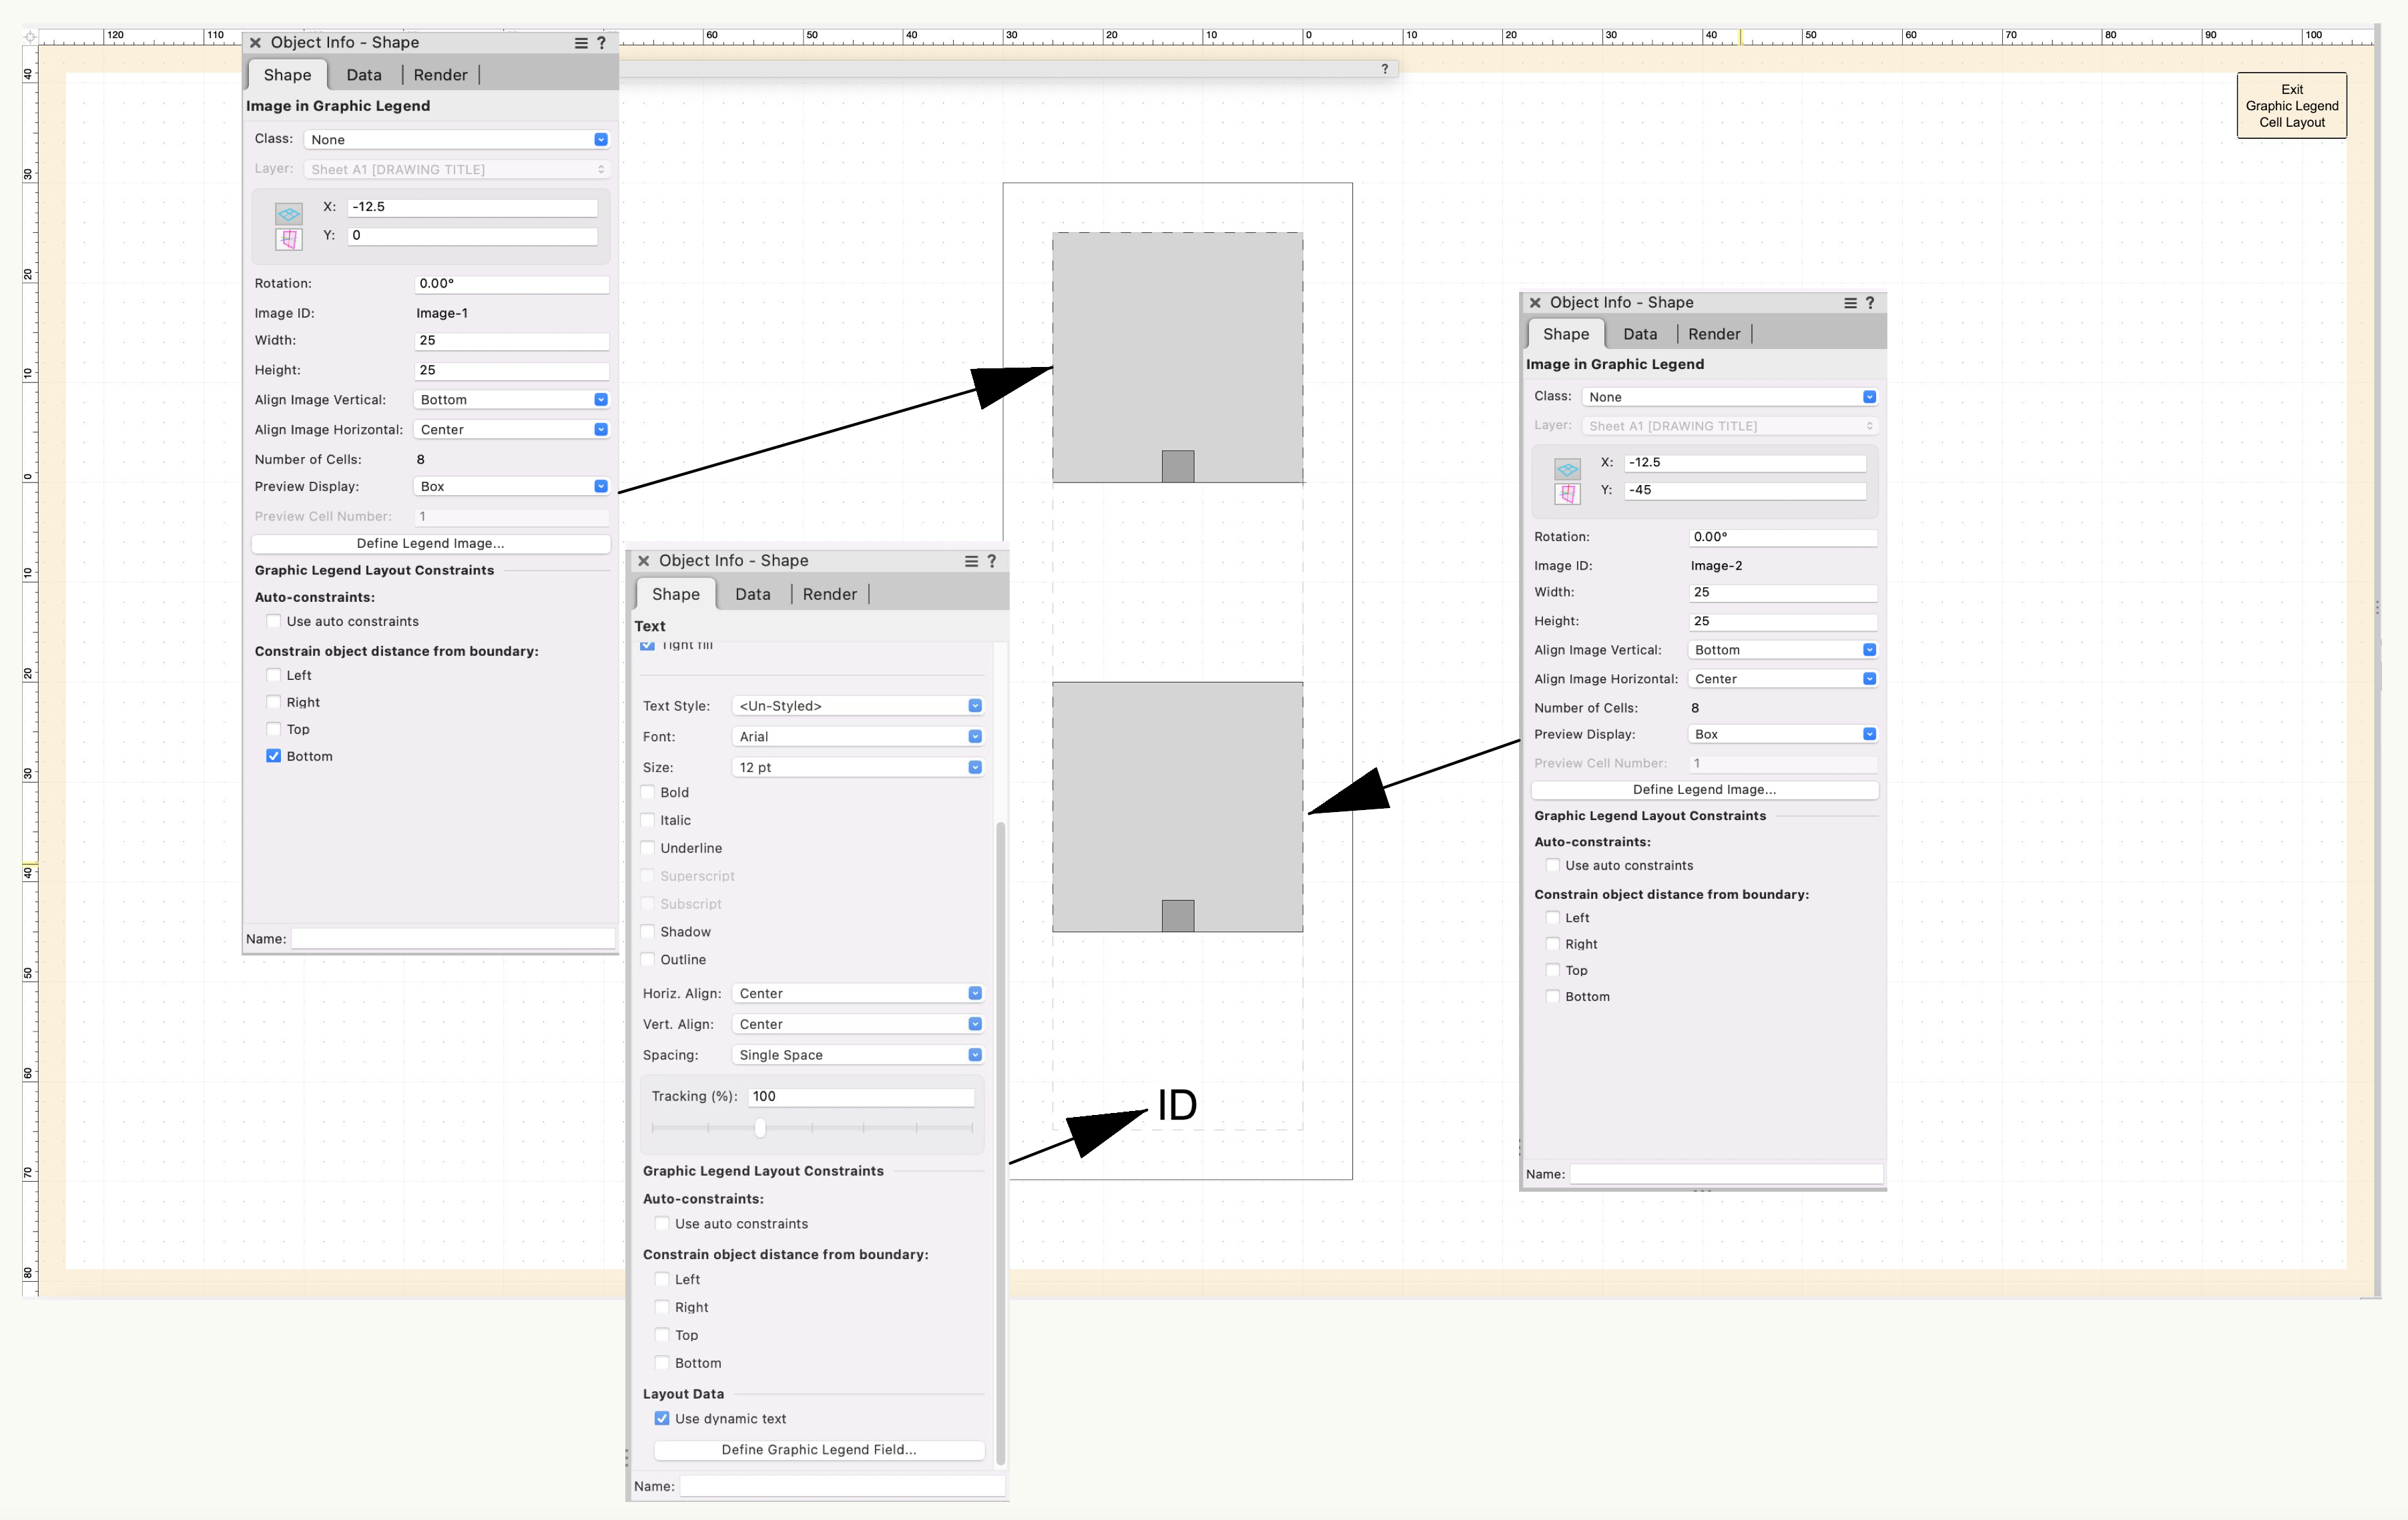
@FBernardo here's some more info from one of the engineers on how the image alignment works: “Note that if you need things to be aligned, you should avoid constraining them. The constraints in the GL layout are fixed distance constraints. They are useful if you want to maintain a fixed equal distance between objects. This isn't always compatible with keeping an alignment because some cells may have larger images than others. In this example, the middle image is being constrained by a fixed distance to the top image and to the Text below. Because all the middle images aren't the same size, some are getting pushed to satisfy the fixed distance constraint.”
-
@FBernardo after looking at this some more, you should be able to get the alignment you're looking for using this setup: Note that only the top-most object in the Cell Layout has constraints enabled, and all of the objects have "Use auto constraints" disabled. This will give you this result: Hope this helps!

-
@FBernardo and @BG thanks for the feedback! We're looking into this...
-
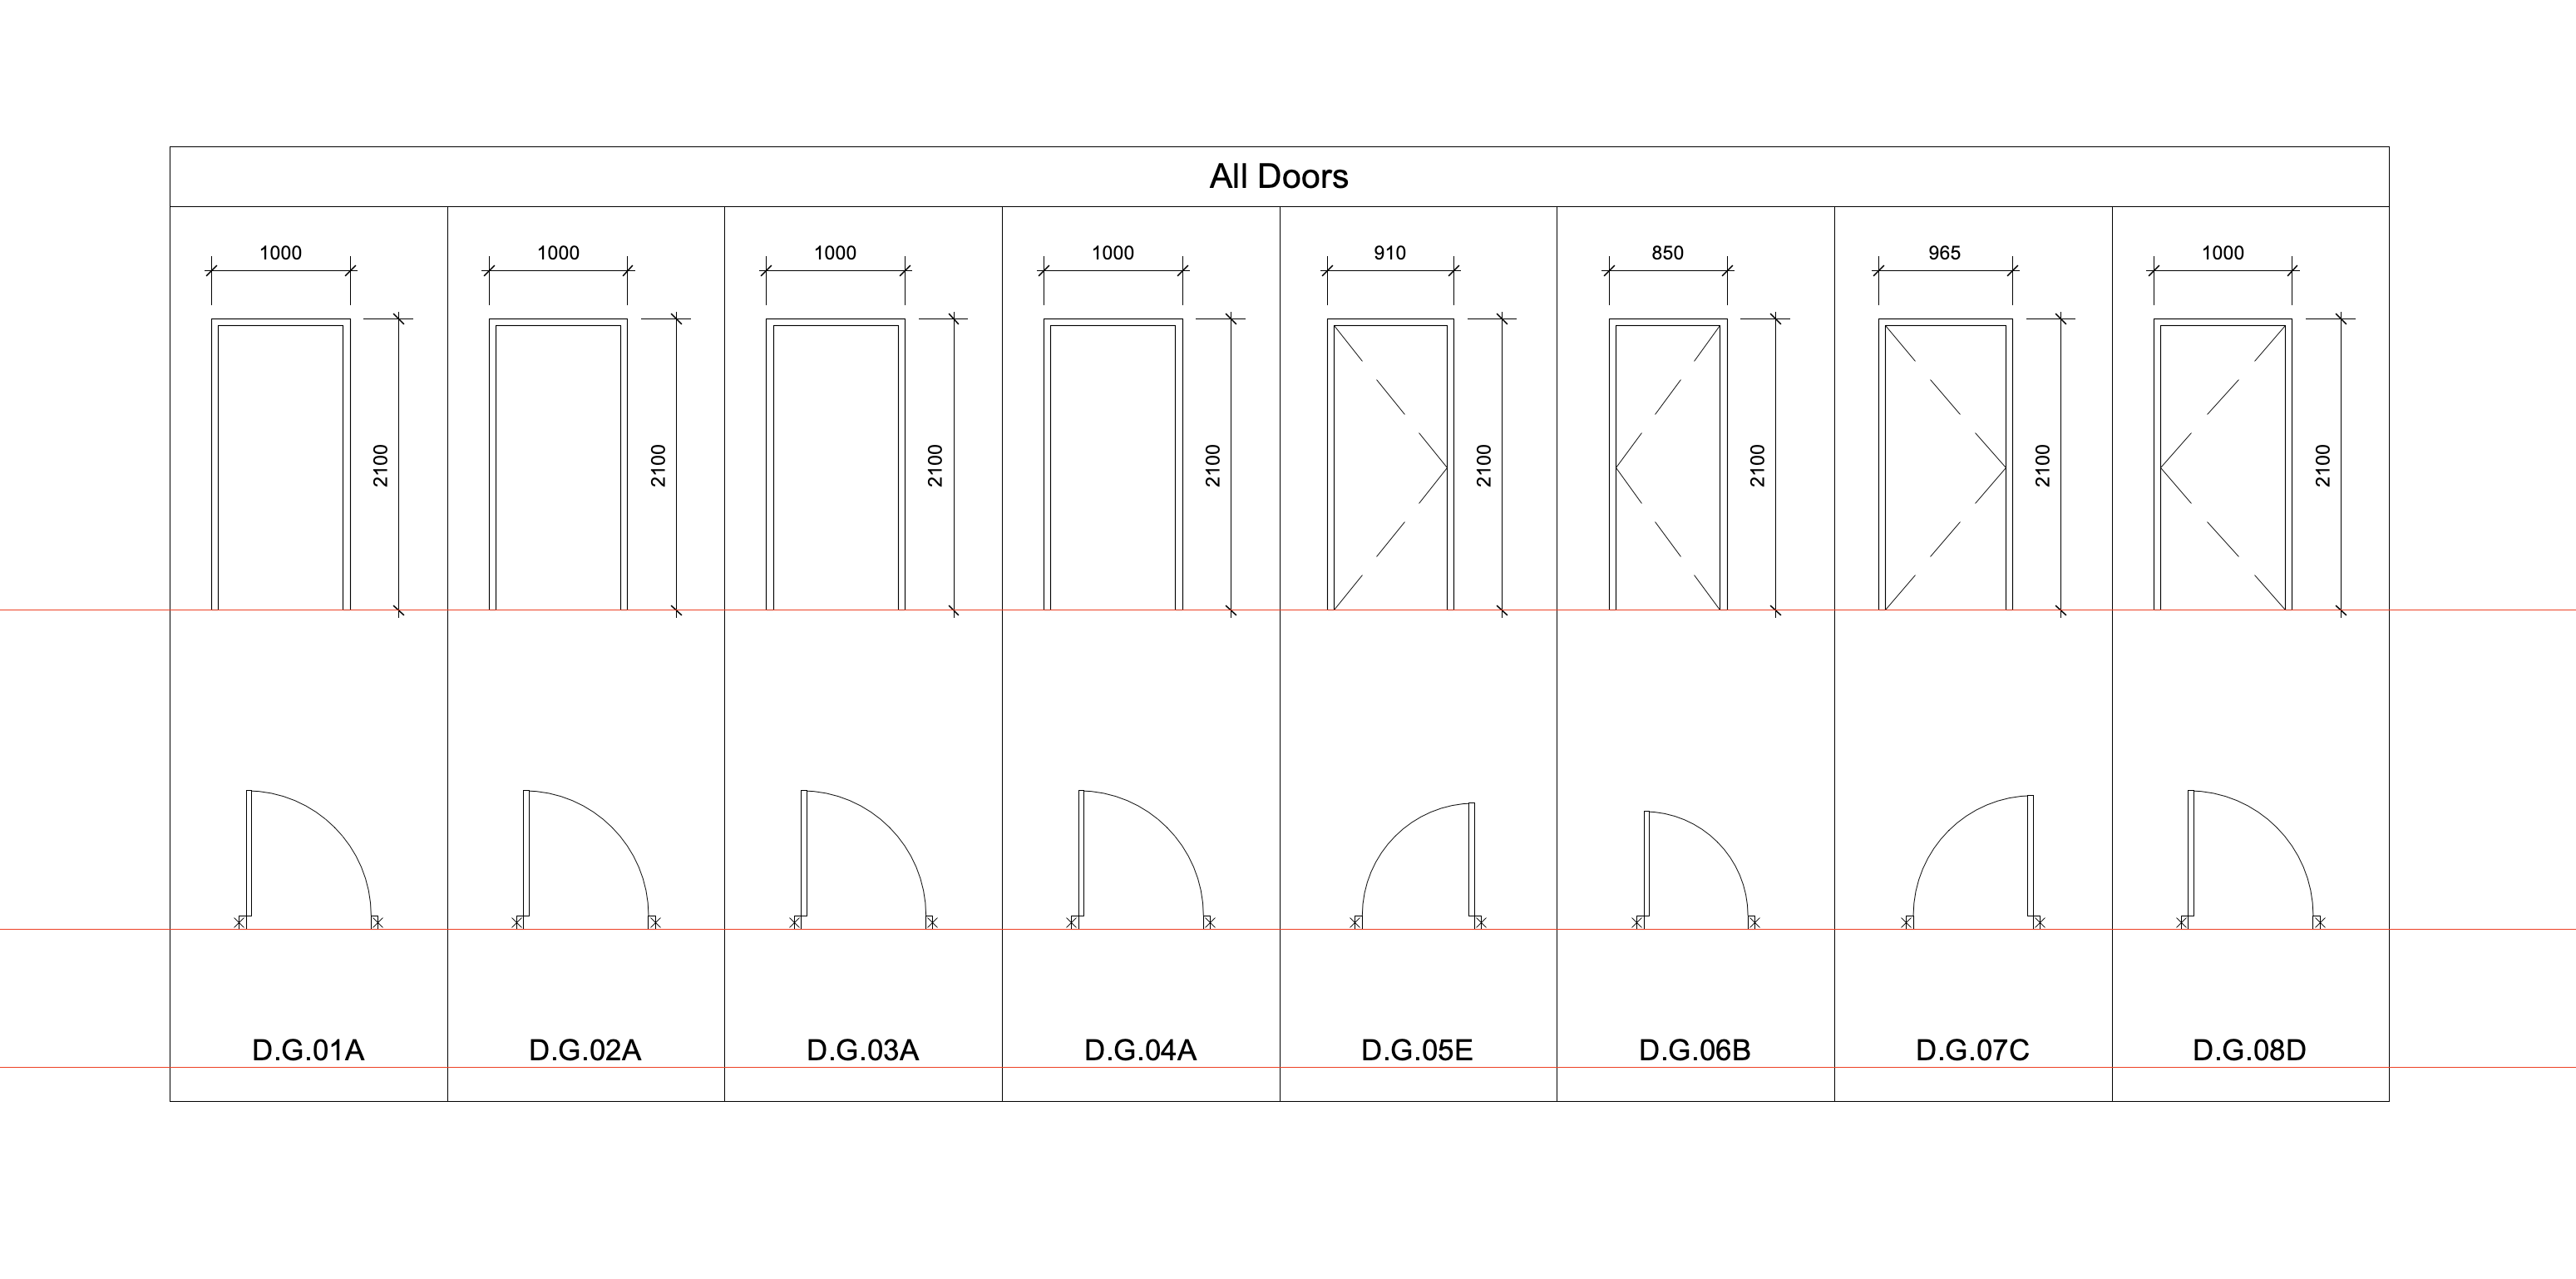
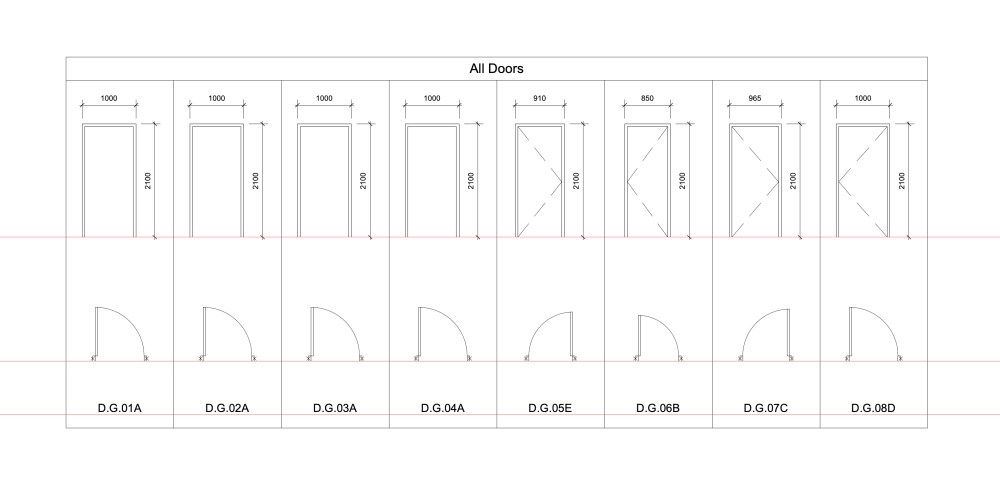
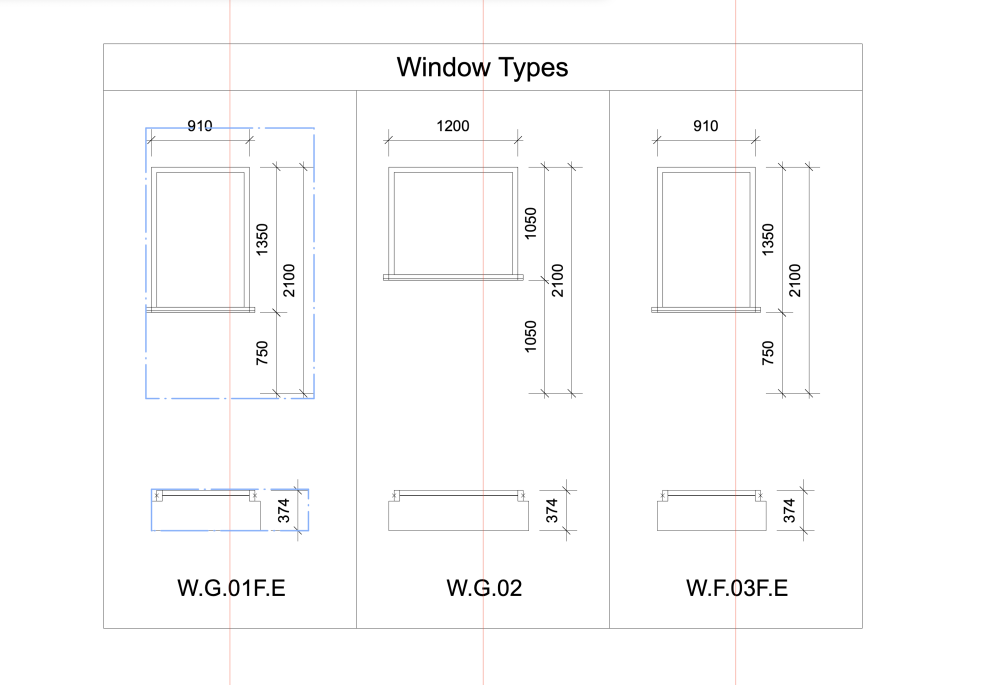
@FBernardo the alignment of the images within a cell is based off the width of the image plus the dimensions. So if you have no dimensions the Window/Door images should all be centered in their cells, but when the dimensions are included it changes the centering (see below). We intentionally set it up this way based on input from users, but would appreciate your feedback. Does it seem like an option is needed to let you center on just the image while ignoring the dimensions? For the door legends in your file, I'm also not having any luck getting things to align cleanly, so I'll put in a report for that. Thanks!
-
@BG this does look like it only happens with WinDoor objects and not with regular Window or Door objects. This is partially-fixed in the upcoming service pack but I'm still seeing the problem with some objects, so I'll log a bug report for it. Thanks for the info! @FBernardo is the issue with your file that you can't get the images/text to align along the red lines?
-
@BG We think this is already fixed in the upcoming service pack, but it's hard to be sure that the bug we fixed is the same one you're seeing. Would you mind uploading a VWX file that shows an example of this, so we can make sure it's fixed? Thanks!
-
Hi Mark, do you get better results if you apply the colors using the Truss Record instead of the "Symbol Name" function? That function works a little differently and may not reliably locate symbols embedded within plugins. So instead of choosing Objects using Function: Symbol Name, choose Objects using Record: Truss Record: Model Name and apply the same colors there. I think that'll give you better results. Hope this helps! Tim
-
Ability to map graphic to a swept path is gone in VW 2020
Tim C. replied to rjtiedeman's question in Troubleshooting
@rjtiedeman did you ever try just replacing the Line with a thin poly in 2020? That seems to be the easiest workaround. -Go into the Sweep -Activate the Offset tool with a really small offset distance and the "Close Open Curves" tool pref enabled -Offset the Line and give it a solid fill The texture should then show on the Sweep and it should have the same mapping as 2019. -
VW2019 spinning wheel when editing text in view port
Tim C. replied to 912345678's question in Troubleshooting
@archdaly are you using VW 2019 or VW 2020? Some of these problems still exist in later versions of VW 2019, but this should be fixed in VW 2020. Did you ever try the un-docking and re-docking of the OIP? This usually fixes the problem for the rest of the session. Hope this helps, Tim -
Ability to map graphic to a swept path is gone in VW 2020
Tim C. replied to rjtiedeman's question in Troubleshooting
@rjtiedeman yes this looks like the problem that Andy mentions above, where Line objects aren't supporting a fill in 2020 and that's spilling over to any solids (Extrudes, Sweeps, etc) that are made from the Line. This is already fixed in a newer service pack but for now you'll just want to replace that line with a thin polygon and the fill should then show. Sorry for the inconvenience. Tim -
VW2019 spinning wheel when editing text in view port
Tim C. replied to 912345678's question in Troubleshooting
@sixthflick thanks, I'll pass this info on to the engineering team that's looking at this.- 12 replies
-
- 1
-

-
- drawing label
- vw2019
- (and 1 more)
-
VW2019 spinning wheel when editing text in view port
Tim C. replied to 912345678's question in Troubleshooting
@sixthflick can you try something on your end which will help us diagnose the problem? -Launch the Console app (in Applications/Utilities) -In VW, select the Callout or do whatever operation is causing the lag -While the lag is occurring, look in the Console app and note what messages are showing Do you see lots of consecutive messages that say "EXCEPTION" or something along those lines? If so, this looks like the same Mojave problem we've been running into. From my understanding, Apple made a change to how exceptions are handled in 10.14, and this causes issues with our Object Info Palette. The problem seems to be much-improved in SP3 due to some changes we made, but we're finding that it still happens for some users in certain cases. If this is the problem you're seeing, un-docking and re-docking the Object Info Palette will typically fix the problem for the rest of the session. If this isn't the problem you're seeing, the next step would be to get a sample of the slowdown. This can be done through the Activity Monitor application. While the lag is occurring, highlight the VW 2019 app in Activity Monitor and choose "Sample Process" from the utility menu at the top. This will create a Sample file that we can look at on our end. Thanks for your help!- 12 replies
-
- 1
-
-
- drawing label
- vw2019
- (and 1 more)
-
@Kevin McAllister would it be possible to PM me the file so we can take a closer look?
-
@bjoerka next time you see this can you check the RAM usage and see if you're maxing out your RAM when the slowdown occurs? Once the RAM gets used up your machine will start offloading data to the hard drive or SSD, which can really slow things down. On Mac you can check the RAM usage through the Activity Monitor, and on Windows you can do it through the Task Manager. Best Regards, Tim
-
Good to hear!! We're working on a fix for this so that you can keep the OIP docked, but this should help out a lot in the meantime. Let us know if you still see any problems.
-
@Alan.AHA are you using Mojave (10.14) on Mac? If so, can you try undocking the OIP and see if that helps at all? Best Regards, Tim
-
VW2019 spinning wheel when editing text in view port
Tim C. replied to 912345678's question in Troubleshooting
@912345678 it looks like we have other reports of this problem and are working on a fix, but I'd like to add your example if you wouldn't mind messaging me a copy of the file? From what I'm seeing the problem is worse if you update the viewports and then edit the Annotations. So one workaround might be to get the viewports in an updated state, then save/close/reopen the file, and then edit the VP Annotations. I'm not sure how much it'll help, but it might be the best approach until we can get this fixed. Best Regards, Tim -
@Brittany I'm thinking this has something to do with using page-based units (for either the Hatch or the symbol itself), but it's hard to be sure without seeing the file. It's been awhile since you posted this but if you're still looking for a solution please message me a file containing the 2D objects that are being converted to symbols. Best Regards, Tim
-
@Jeremy Best @mjm we're looking into this bug, but you should be able to cancel the RW render by changing the active render mode. For example if you just choose Wireframe from the rendering menu, the RW render should stop immediately. HTH
-
@Alan.AHA as you experience the slowdown can you create a sample file from the Activity Monitor? This will give our engineers something to look at so we can investigate. It should take less than a minute: -Launch the Activity Monitor -While the slowdown is occurring in VW, highlight the Vectorworks 2019 app in the Activity Monitor and choose "Sample Process" from the pull-down menu at the top -This will generate a text file that you can save and upload Thanks for your help! Tim
-
Unable to Install Updates 2019 on Windows 10
Tim C. replied to Asemblance's question in Troubleshooting
@Asemblance we're looking into this now and will get back to you asap. Best Regards, Tim -
@twaikin Thanks for the info, I've submitted bug reports for both issues. Best Regards, Tim