
ericjhberg
-
Posts
581 -
Joined
-
Last visited
Content Type
Profiles
Forums
Events
Articles
Marionette
Store
Everything posted by ericjhberg
-
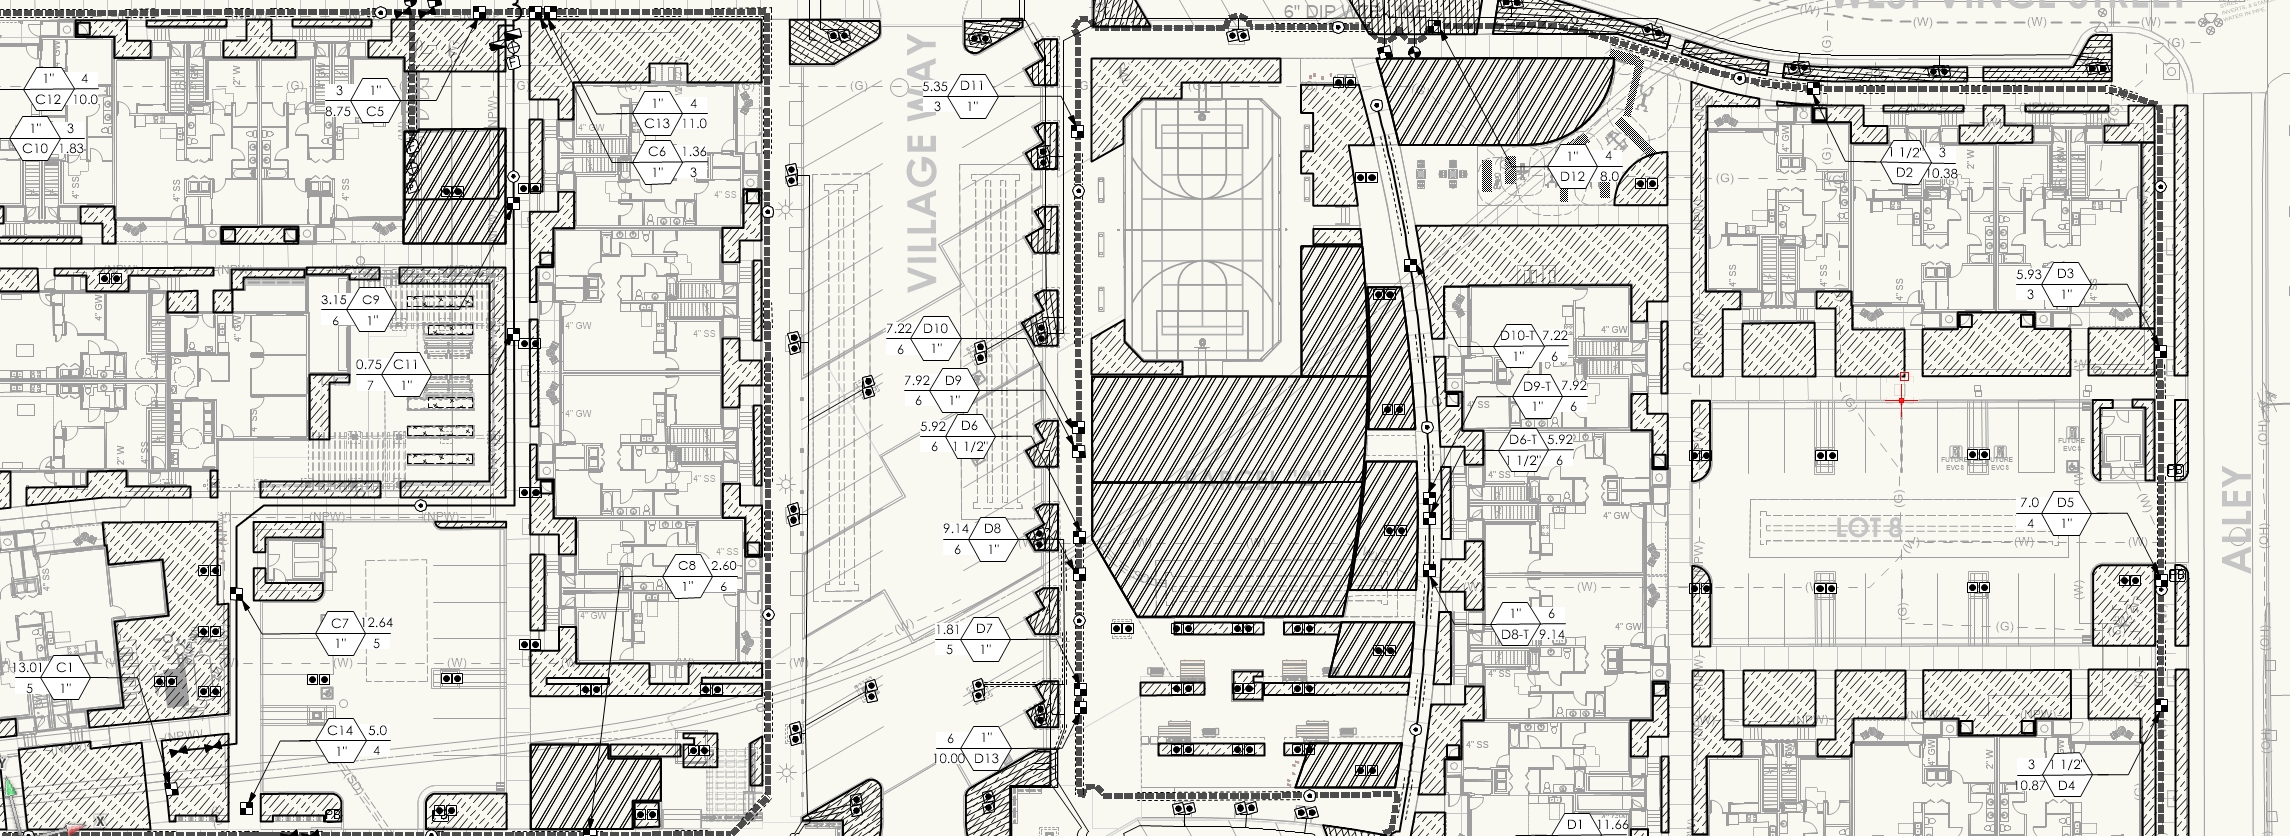
 I love the functionality of Data Tags, they have completely changed our documentation workflow and data tracking, for the better. That said, I wish there were a few functionality upgrades. I'll post them in separate posts, so for this one...how data tags work on sheet layers in recognizing objects. It is clear that when adding a data tag in Viewport Annotations that it is designed to find the geometric center of the object, which may be fine for small or relatively "square" objects. Where this gets challenging is for objects that often span multiple viewports or asymmetric objects. For example, if you applied a Data Tag to the letter 'C', the Data Tag would be positioned in the void of the letter, not on the edges. The best practical example I have is a trail project where a long, linear trail is broken into several (10-20) different viewports with matchlines. To adequately identify the trail object (a single, closed polygon), the Data Tag tool will only find the object in the viewport that contains the geometric center point...not every viewport where the object is visible. To combat this, you have to break the object into a separate polygons per viewport. This is less than ideal becuase you have to break up geometry that should be simple, which enters opportunity for error in multiple ways. Even then, if multiple competing long, linear objects exist in one viewport, Data Tags defer to stacking order in the Design Layers to select which object to apply a tag to...making application of Data Tags almost impossible. You can use the Select Eligible Objects Mode to place all the Data Tags, but then positioning the leaders/arrows to accurately point to the correct object becomes an exhausting effort. Instead, Data Tags should be designed to recognize the edges and/or the fill of objects, not the geometric center point.
 -
Object Intersection Calculation
ericjhberg posted a question in Wishlist - Feature and Content Requests
I wish there was a way (maybe there is?) to format a calculation to return the area in common between two intersecting objects. I know that it is possible to calculate this area after performing an Intersect Surface command, but that workflow doesn't support iterative design very well. If the objects move, the area intersection changes, and you have to redo the entire workflow. This would be an amazing calculation for things like Tree Shade calculations, often required by permitting jurisdictions (and now integrated into the CalGreen Building Code). The calculation is essentially an intersection of the Graphic Tree diameter with areas of paving divided by the entire area of the paved surfaces. If the trees move around or you need to add/subtract, there is no way to easily re-perform this calculation without a bunch of duplication and destructive actions. -
Site model Cut/Fill Depth contours
ericjhberg replied to Steve Riddle's question in Wishlist - Feature and Content Requests
I actually don’t know. Another consultant/contractor provided it for one of our projects and I didn’t get to ask. -
Site model Cut/Fill Depth contours
ericjhberg replied to Steve Riddle's question in Wishlist - Feature and Content Requests
Maybe I missed the point, but the exhibit I shared is a way of visualizing the depths of cut/fill, not specific to contours. This is a functionality I wish VW could perform, but currently cannot. if you’re looking for a way to show both contours and cut/fill, then yes, duplicating the site model or using a site model snapshot is the only way. -
Site model Cut/Fill Depth contours
ericjhberg replied to Steve Riddle's question in Wishlist - Feature and Content Requests
@jpccrodriguesUnfortunately no. I just posted this as an example of what we would love to produce if Vectorworks had the capability. -
Site model Cut/Fill Depth contours
ericjhberg replied to Steve Riddle's question in Wishlist - Feature and Content Requests
I'm not sure that this is with contours, but rather as a gradient of more cut, to more fill. Something similar to the attached rough site plan where deeper reds = more cut and deeper blues = more fill. Ingore the green overlay.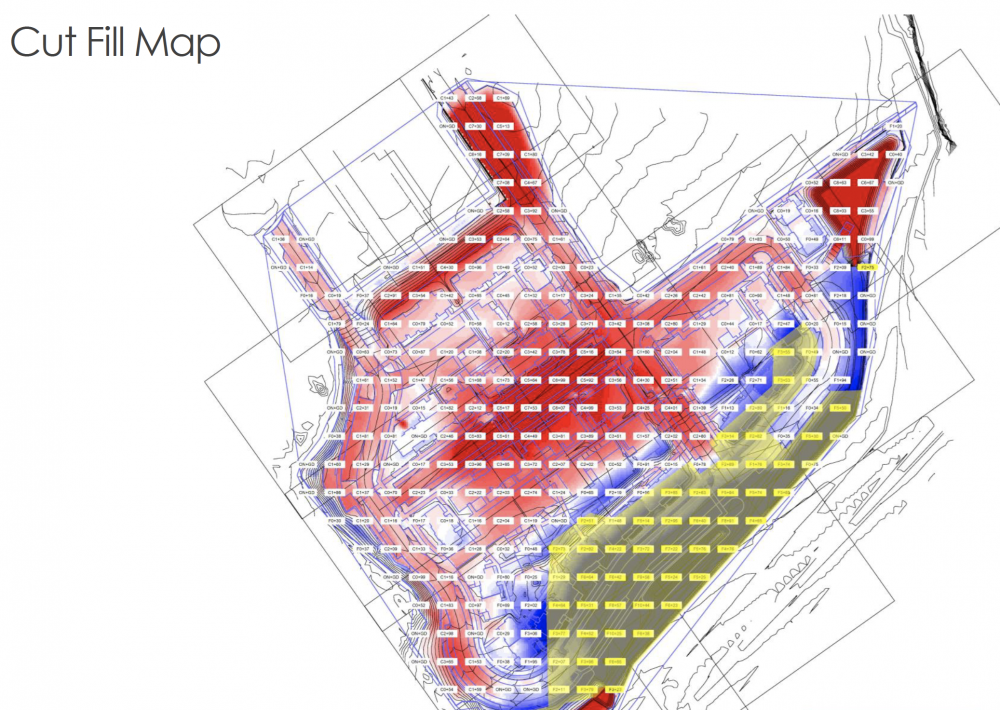
-
Grade Tool Unit Control
ericjhberg replied to EricK's question in Wishlist - Feature and Content Requests
Ugh...this request has been made over and over again for not only the grade tool, but the site model and site modifiers as well. Unfortunately, no fix in sight. @Jess_J, the font size is changable by the general font size control under the Text dropdown. -
And yes, while this is a great place to store your visibility settings, we have learned that applying the settings will NOT inherently create any missing classes pre-defined in your settings that are not currently in the active file. Instead, those classes have to be created or imported from a template file either before or after applying the saved settings to the Site Model. I wish they automatically stored the classes and imported them with saved settings once the saved setting is applied. And also...to be clear, there are two settings to save within the Site Model object...there are the 'Site Model - Settings available from the main Site Model Settings dialog box and the Graphic Properties...Settings available from the Graphic Properties sub-dialog box. We don't manage saved settings through the first Site Model Settings because those settings apply similar Maximum, Minimum, Datum, Contour Interval, Contour Multiplier, etc. settings to all site models, despite the fact that those parameters change widely across different projects. Rather, we use the Graphic Properties sub-dialog box Saved Settings to control visibilities of site models based on specific class assignments/visibilities, but we have to remember to import specific classes from our template files before applying the saved settings to get the desired result. Another question/idea. Is there a location to store these saved settings in a Workgroup library for office wide sharing? I haven't found this location yet, and rely on manually saving the same settings on each machine in our office for universal collaboration, but a workgroup library location would be awesome. Lastly, regarding Contours, contour labeling as a whole needs to get much better. Contour labels should be allowed to be set independent of document units. That way I can set my contour labels to be in Feet with 0 decimal places, and read appropriately while staying in Feet and Inches for my document units, which is typical for the work we do. Without this, my contours ready 406'-0", which is just plain terrible. This functionality is already available with Stake Objects...just use it for Site Models (and Site Modifiers, Grade Objects, any other site modeling tool). Contour label positions automatically set by the site model are often in terrible locations with way too many instances. To make things worse, if you go through the process of updating the site model...even once...the manually set contour label locations revert to their original, terrible locations. Pointless. It is easier, but potentially error prone, to just manually place text contour labels on a finished site model than to use them from the plug-in. Fix this!
-
That's too bad. Thanks for the info @Antonio Landsberger
-
Gradient Cut Fill Site Model Visualization
ericjhberg replied to ericjhberg's question in Wishlist - Feature and Content Requests
Honestly, whichever is easier to develop and use. That said, I feel like all of the Site Model visualizations are currently only accessible via the Site Model graphics, so that seems like the most logical. -
This post was from over 2 years ago with no answer, and I'm still curious. Any ideas?
-
Gradient Cut Fill Site Model Visualization
ericjhberg posted a question in Wishlist - Feature and Content Requests
It would be awesome if you could generate a 2-dimensional visualization of a Site Model's cut/fill, but instead of just static Cut = Red and Fill = Blue...you could assign a gradient for each that could color the site model based on cut severity or fill severity. For example a White to Red gradient for cut that the greater the value of cut, the deeper the shade of red. Additionally a White to Blue for fill that the greater the value of fill, the deeper the shade of blue. This would be an extremely useful way to visualize site models. @Tony Kostreski @Eric Gilbey, PLA @Vlado @bgoff- 4 replies
-
- 4
-

-
- site model
- landmark
- (and 2 more)
-
Yes please, all great suggestions, by style and custom!
-
Thanks @Pat Stanford! pSet_StairCommon does store data regarding the Stair object, but width is unfortunately not one of them and I am really looking for a global location to universally change stair widths at one time. The pSet doesn't appear to have that capability, unless I am missing something.
-
Ugh...that was what I was afraid of @Pat Stanford. Any other ways you can think of to report/control this information? Marionette? Custom Script?
-
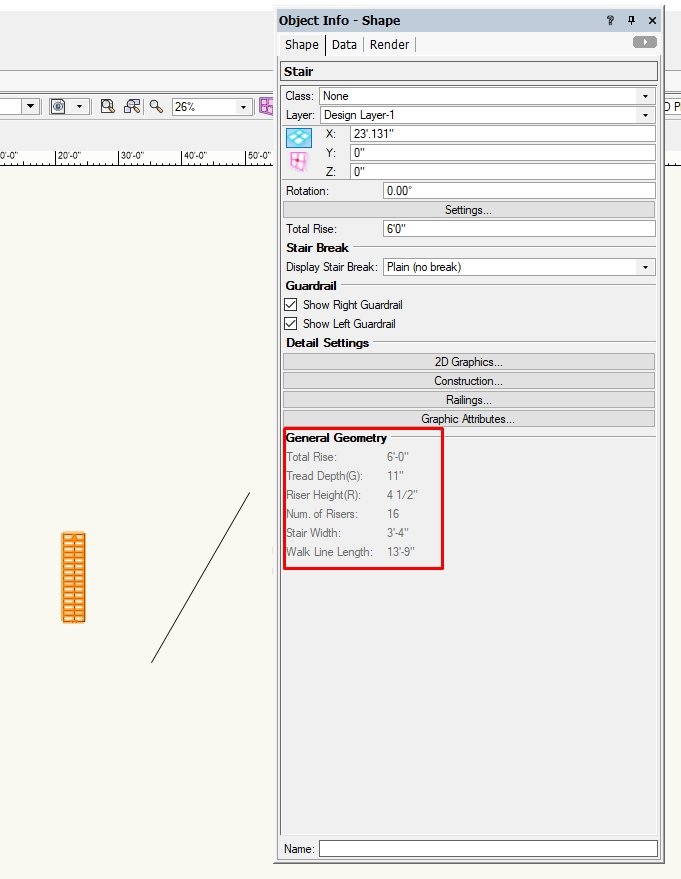
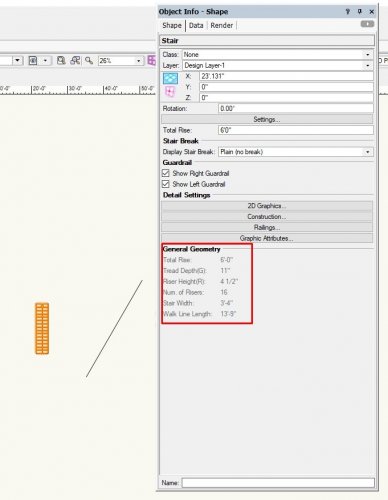
Is it possible to pull in/edit stair General Geometry (i.e. Tread Depth(G), Riser Height(R), Num of Risers, Stair Width, Walk Line Length) into a worksheet? If not, why? I noticed that Total Rise can be queried and edited, but not other geometries. I have a project where I need to edit 50 stair objects to ALL be the same, albeit different than originally drafted, dimension. It would be so awesome if this was available in a worksheet, with the ability to change them all from 4'-3" to 4'-0". Otherwise, the only way to change these all is to go through them individually and change the width because they all have different total rises, and riser heights.
-
@TDimov...I would like to piggy back on this thread and ask if it is possible to build a Data Tag that pulls in some of the OIP data from Wall objects, like Height and Top Offset? I cannot seem to find the data point to add to my data tag and it doesn't appear possible using your step-by-step above.
-
Nope. All levels are at 0. I find it strange that symbols work find with the send to surface, but Plants do not? I have had a troubling history with the send to surface command. Sometimes it won't work for one object, but will for another right next to it. Usually, I have found that the more complex the site model, the more "holes" present where send to surface or even Stake objects won't accurately read the surface. This is not one of those models. Everything else works fine.
-
Plants are on a different layer, out of necessity. No site modifiers, simple site model built from 3D geometry. Symbols sent to surface register correct Z-values. Plant objects do not and in 3D, their 3D representations all appear at Z=0 no matter if they are sent to surface or not. Luckily, we are not rendering in VW anymore, and using Lumion instead. I was just trying to get proxy nodes in place for a quick Lumion replacement with the correct Z values. That said, I did learn that I can just send them as proxies in Lumion at Z=0, raise them all en-masse above the Lumion version of the Site Model, and then conform them to the surface. Works like a charm with no bugs...unlike VW. Thanks @Jonathan Pickup for your assistance.
-
It would be awesome if Vectorworks was able to easily export and coordinate proxy nodes for easy/quick replacement in Lumion. This functionality appears extremely simple with the other programs supported by Lumion, but I will tell you it is almost impossible in Vectorworks. With this functionality, we could save countless hours placing objects between the two softwares. Perhaps there is a workflow I am missing though, so I am happy to hear others experiences and hopefully success stories.
-
I'm having difficulty sending plant objects to the Site Model elevation using the Send to Surface command. Meanwhile, simple symbols send to surface in replacement of the Plant Objects without problems. I'm in VW2020 and it's been awhile since I've tried this command with plant objects...long enough to question if Plant Objects lost this functionality in VW2020 going forward? Thanks.
-
Site Model - Lock in Place
ericjhberg replied to ericjhberg's question in Wishlist - Feature and Content Requests
Completely agree. -
Worksheet function (=Image) and lineweight
ericjhberg replied to The Hamma's topic in General Discussion
Ugh...I hate to say it, but this is a huge problem with the =IMAGE function within VW worksheets. The function actually takes a raster image of the symbol that is most commonly a vector based symbol and the resulting image is incapable of capturing lineweight. For us it is Plant symbols (Trees) with thick outlines. The plant schedule, regardless of the DPI does a horrible job of translating those symbols into the legend legibly. We actually have resorted to a workaround of double-stacking two identical worksheets on top of each other. It kinda works to darken the images, but is a far cry from how it SHOULD work. -
Problem with Orientation of North Arrow in a Viewport
ericjhberg replied to ashot's topic in General Discussion
@Tony Kostreski...I am seeing this in 2020 SP5. Haven't tried it in my testing of 2021 yet. Could be particular to a specific file? I don't even have a Heliodon in the file I am working in and when I go to rotate the North Arrow...nothing. Does it have to do with Georeferencing? Screen Recording 2020-11-23 - VW North Arrow.mov -
Problem with Orientation of North Arrow in a Viewport
ericjhberg replied to ashot's topic in General Discussion
This doesn't work. No matter which settings are enabled, it is impossible to rotate the north arrow within the viewport annotations layer. The only way to make it work is to actually "Explode" (covert to group) the north arrow, or create a dumb 2d symbol, which is a REALLY, REALLY bad workflow considering the intent of the north arrow tool. We actually ONLY put north arrows within viewports in case we do have multiple viewports on the same sheet with different north arrow orientations (not often and try to avoid, but occasionally). We never put north arrows in the titleblock.