Samuel Derenboim
-
Posts
472 -
Joined
-
Last visited
Content Type
Profiles
Forums
Events
Articles
Marionette
Store
Everything posted by Samuel Derenboim
-
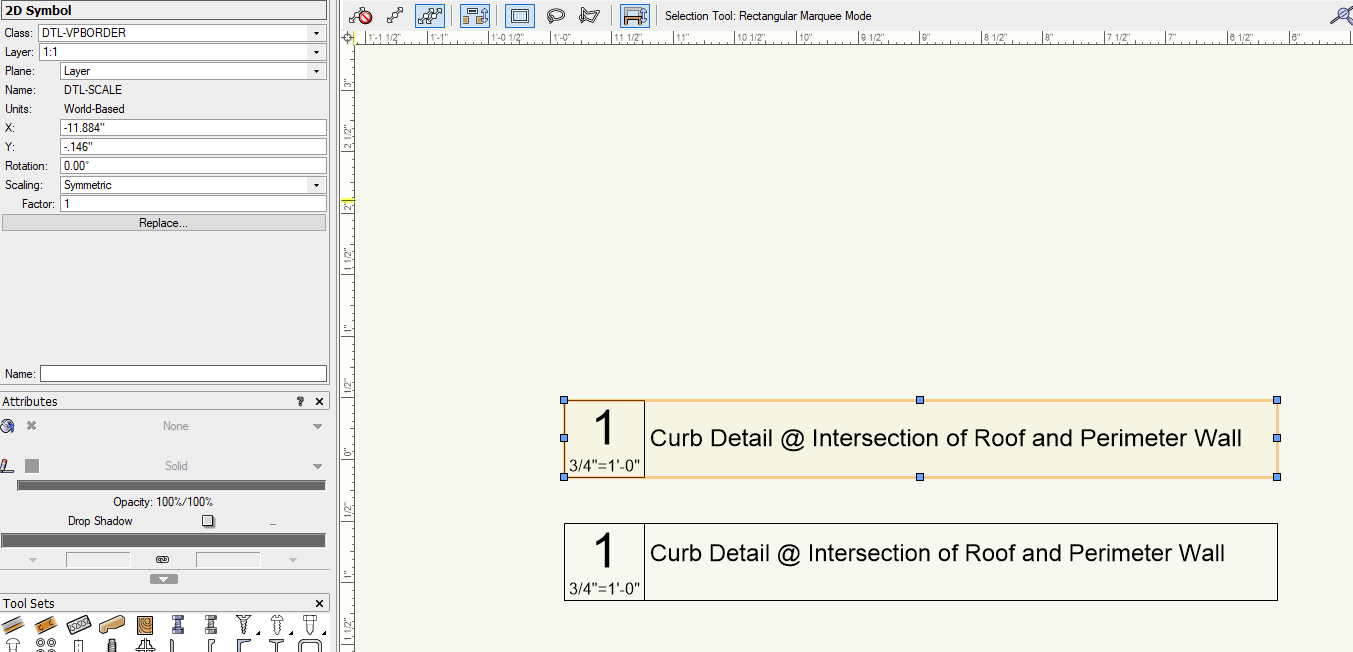
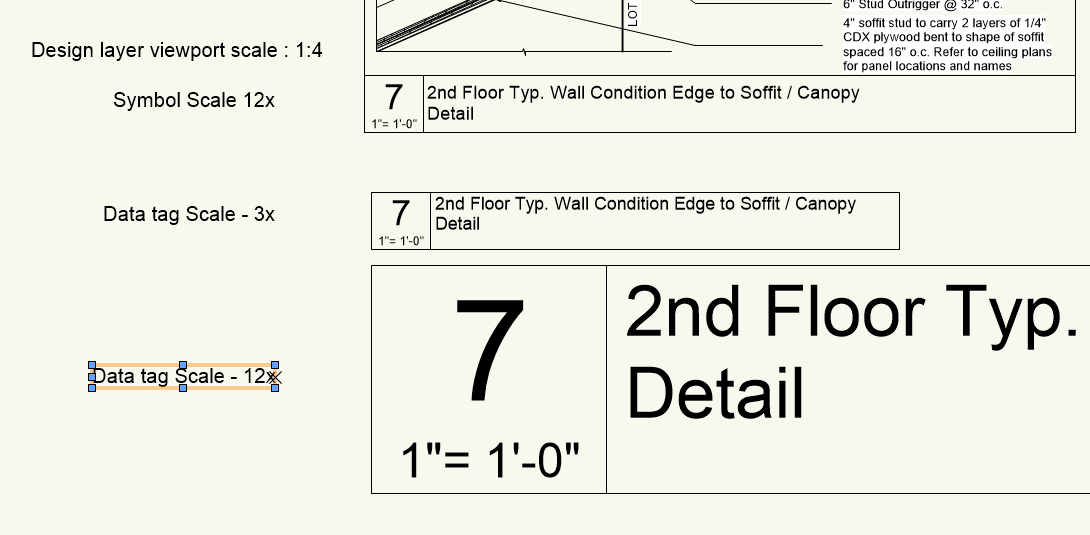
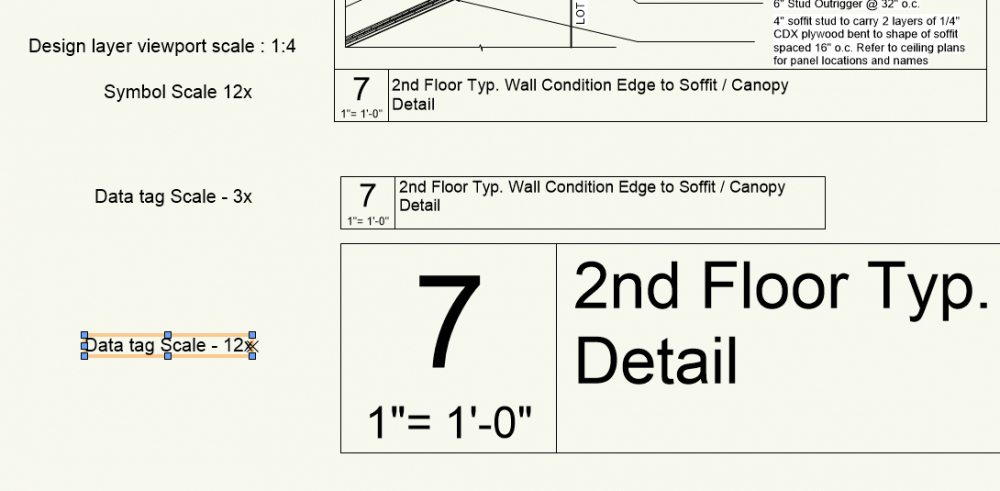
Don't know if anyone has run into this issue before, however, data tags with text for some reason scale differently than symbols do. From what I understand, data tags scale at page scale, where as symbols scale at world scale. When I take a symbol, and at 1:1 scale w/ size 10 text, the true size of the text inside symbol at 1:10 would be 1 instead of 10. Data tags automatically adjust its size based on text size according to design layer scale, and as a result cannot be truly scaled based on its world size. Is it possible to give data tag a world scale so that the text would adjust based a 1:1 ratio in the design layer view port irregardless of the design layer view port scale? Data Tag @ 1 : 1 scale representation Real world scales

-
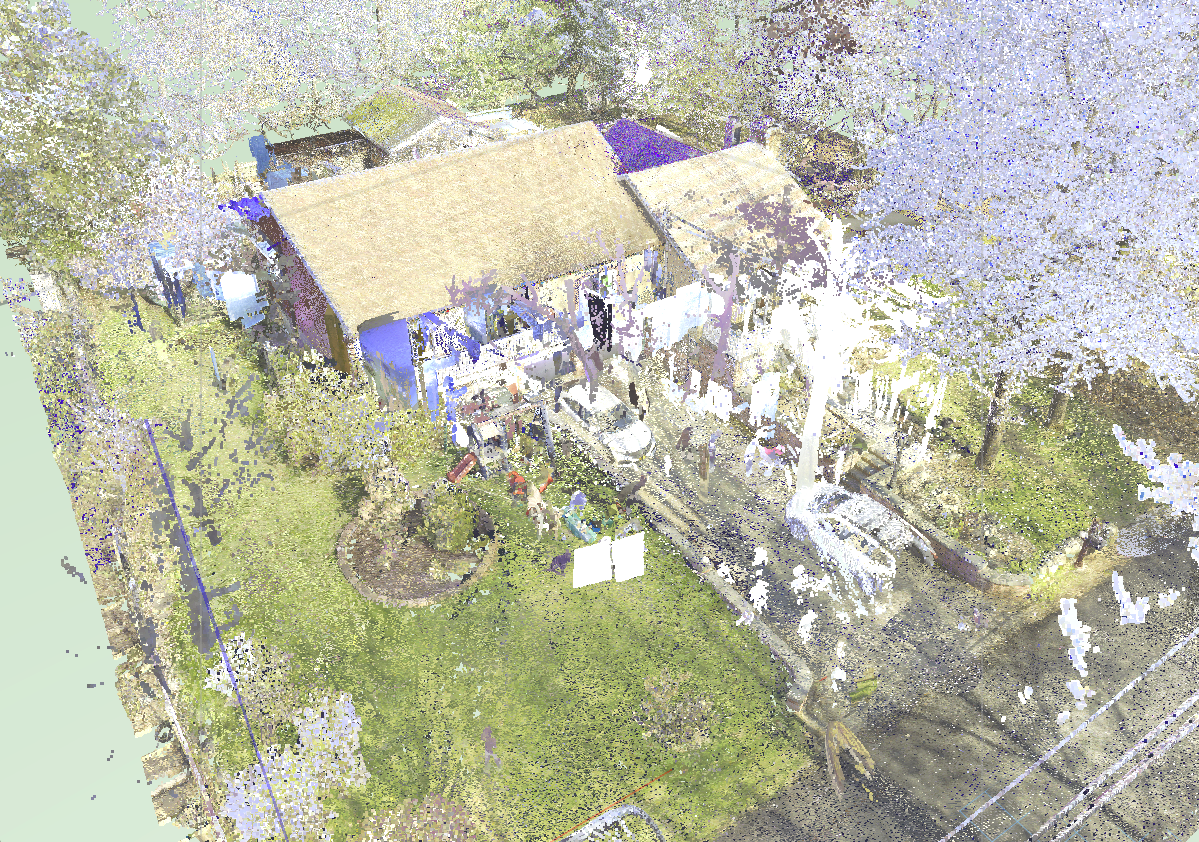
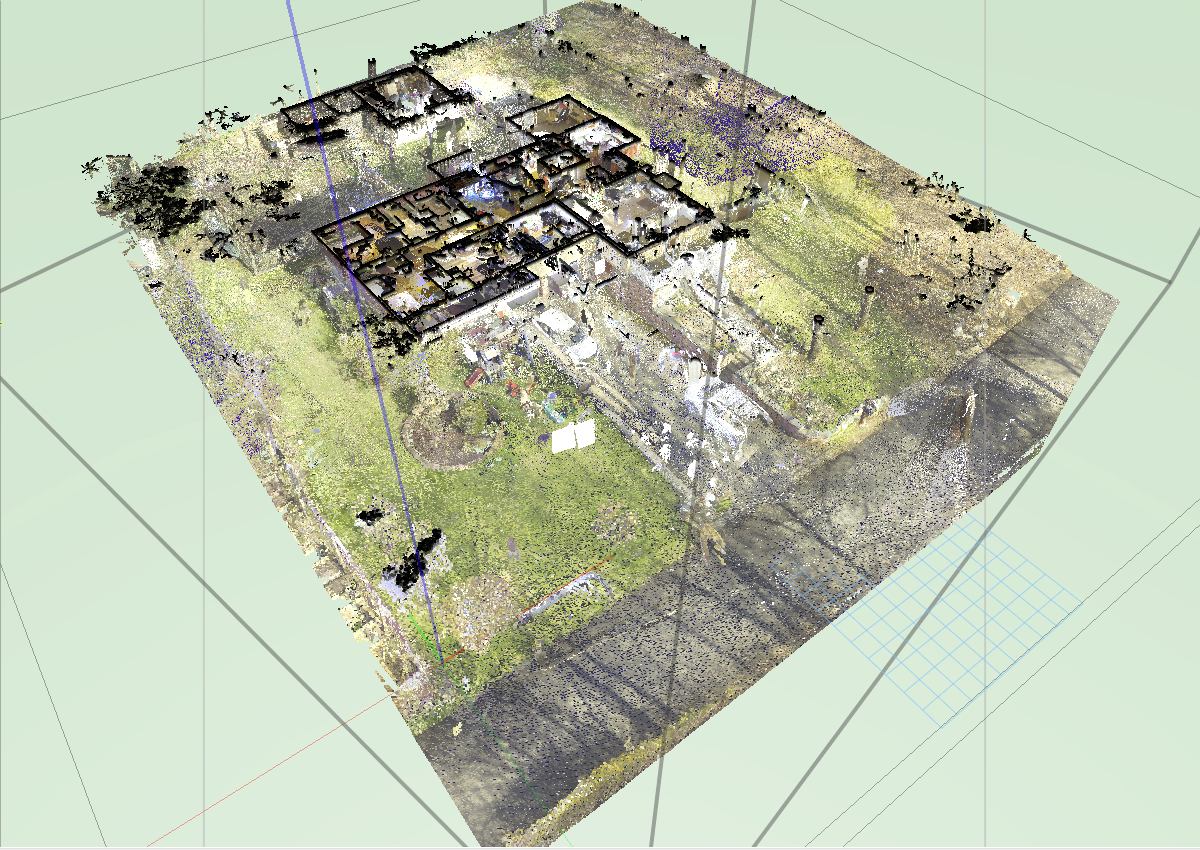
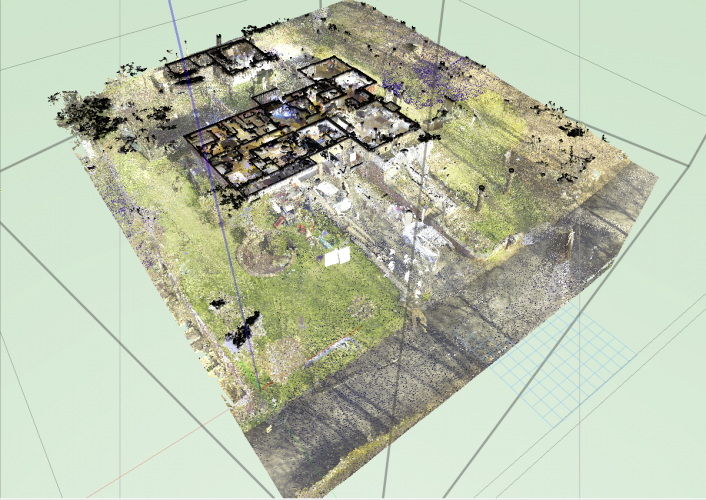
Hi everyone, Don't know if anyone works with point clouds here, but it's definitely the future of surveying. There is a feature i wanted to enhance. Currently, there is only one right click option for extracting loci from a point cloud model, however it extracts from the entire point cloud model. My feature request enhancement is to selectively show where in the point cloud model I would like to extact the loci. If using the clip cube, it would be great to extact only the loci in the clip cube. If its a section for example, that has been generated from the point cloud, perhaps the same feature, extract loci from point in viewport (i.e. a viewport that has a min and max setting for below and above clipping points.) It is great to use if someone needs to model a terrain of some sort without having to regenerate the model itself. Another feature would be to generate a 3d model from a series of loci, or a 3d terrain, but it would not generate the object if it has overlapping elements / loci in it. So i.e. to generate a model from a point cloud set of points that are spherical, or vertical. Just a thought. Thought Id share these ideas in the forum in case anyone runs into similar requests in the future. Versus

-
@Tamsin Slatter Your suggestions for the tag tool regarding the bounding boxes is an excellent idea, don't know if you already submitted this enhancement, but I second the motion to add that feature (along with @Michal Zarzecki I presume). I agree that the tag tool needs multiple additional functions in order to use some of these things properly. Particularly, the feature that is sorely missing is simply getting the tag to read the Z in reference to the story. It should also understand what level in the story it might be referencing. This pertains to one of the questions you ask - how would you do it in plan mode? In my opinion there are two ways - either copy the z value of the symbol in reference to the floor elevation (not absolute zero), or copy the elevation of the level the symbol or PIO is on - i.e. - ceiling elevation, FFE elevation, T.o. slab elevation etc.. in both a numerical format and perhaps also callout the level itself, that way if it needs to be changed from the tag level, it can easily be done so. These two things can be done in plan mode without going into 3d or providing a working plane for the object you are referencing. This might be particularly useful since i have a feeling you guys might be integrating levels in symbols as well (or so i presume) Just a thought. What do you think?
-
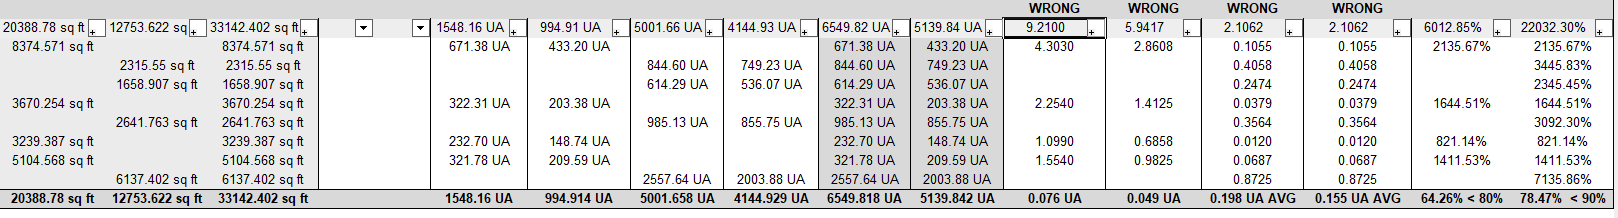
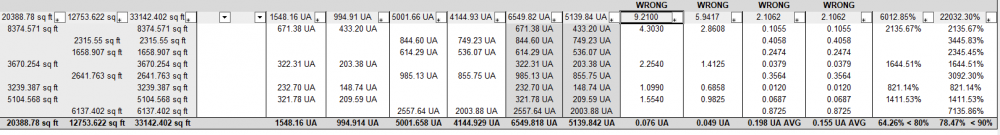
Hi everyone, I know there is a simple fix to do this, but wanted to inquire within. The chart below shows Areas UA and UA averages. In order to get UA average formula looks like UA / Area. The bottom (totals) row returns the correct value, however the table cells in the database return the incorrect value. I know a conversion must be made or something like =value () or num2int or something. Does anyone know the correct formula to do the math properly ? (the UA column are summarized by sum) Here is another example. The Table columns showing wrong are doing the math in the table cells because they are summarizing and adding the values. Formula under the 1st (from left) column with the word wrong above should calculate 433.2 / 8374.571 = .0517. It shows 4.3038 because it summarizes and sums all the criteria for the values. The same issue is the other columns. The totals cell at the bottom has the correct answer because it is not using a database header.

-
3d poly - move by edge mode
Samuel Derenboim posted a question in Wishlist - Feature and Content Requests
Would it be possible integrate an option to modify edges of 3d geometry ? Seems like a standard option in various 3d programs. Though it could be useful here. Now it is only possible with taper edge, which can be quite confusing to use. What does everyone else think? -
separate database column
Samuel Derenboim replied to Samuel Derenboim's question in Wishlist - Feature and Content Requests
No problem. Here is a sample file. They try to do the same thing, but the format by which the table is laid out from the above excel file would not be possible. If you set up columns for each of the cardinal axes, they will return 0 because each record is counted only once per row. Thank you again @Pat Stanford Test Worksheet_Geometry Method.vwx -
Import stories / levels from another file
Samuel Derenboim replied to Samuel Derenboim's question in Wishlist - Feature and Content Requests
Thank you @Pat Stanford You're right, I didn't get into detail of how it worked and checking part of the file. My concern is if there is a single crash or problem on one computer, how would the information be saved and would it affect the integrity of the master file that is being worked on. I also noticed that the larger a file gets (annotation + BIM model), the harder it is to work on because more ram is required not withstanding any other unknown conditions. The more gears involved ,so to speak,, the easier to cause problems. Hence the solution for referencing information and using reference files to do annotation in a separate one. -
@jmanganelli What you say makes 100% sense. That is why i bypass the guess work and do the calculations from wall areas and other tricks with different types of geometry with records referenced in the file. However, even the areas of exterior walls are very difficult to get given different conditions of wall types and walls. Wall surface areas still cannot be calculated properly (curtainwalls in particular). I would even go so far as to say I'd be happy if VW got out of the energy modeling department, and simply fixed the current toolbase in order for the community to assemble together and make one that suits our needs.
-
Import stories / levels from another file
Samuel Derenboim replied to Samuel Derenboim's question in Wishlist - Feature and Content Requests
@matteoluigi no, was referring to project sharing (where two users can work on the file simultaneously. I thought that was what you were referring to. -
Import stories / levels from another file
Samuel Derenboim replied to Samuel Derenboim's question in Wishlist - Feature and Content Requests
We haven't implemented that yet as I've head many complaints about projects not getting saved, problems assigning layers, etc... How is your experience with sharing a single file with multiple users? -
I came across this problem recently and I think adding these two functions into tags would be the solution. Let me explain : There are numerous times when we as professionals need to provide information on construction documents that reference a specific element inside a unified workspace. I have been trying to unify various different code references to a single type of space object reference system without re-creating the their ID's from scatch all over again. Let, for example, take building code and lighting areas. 1. For building code - in order to analyze any spaces, i have come to the conclusion that a space would be described the envelope the building code dictates. In commercial spaces, this can be resolved by creating a space of all tenancies into the design layer, or into another design layer overlaying the plans. However, this is where the challenge comes in. Let's say you need to calculate the number of fixtures (i.e. takeoffs) by space. Or more importantly, let's say you need to provide a tabulation of the individual spaces for energy code - note by tenancy, but by rooms. What do you do? a. Option 1 - provide a single space for every room. That is the easier solution to showing on a worksheet the number of objects in a room. But, what if you also want to use those spaces to calculate occupancy for every tenant for the building code? You would essentially have to provide a record tenancy for every room that is in said tenancy space. However, for buiding code purposes, you would eliminate the ability to create a unified tag that summarizes the occupancy for the entire tenancy. Instead, you would only be able to do it room by room. Overall tenancy would then have to be on a worksheet level. Unifying and combing different elements like building code, energy code, zoning, and program would be easy on the one hand, on the other, checking the number from a plan examiner standpoint - would be a nightmare - the worksheets would be tremendously long. b. Option 2 - provide an overlay of spaces governing their own functions. If you need to provide an overall area for a space in building code - and given that the space would provide the area, it is easy to calculate the number of people for that tenancy. If you need to show the number of fixtures for each room, another space overlay would be created that can summarize the number of symbols and what symbols are in that particular room. The problem becomes - room id's. Tenancy would have one id. Space by spaces would have another, and there is no way to link them - except for location in space by ID and location in space by Name (as the function used in worksheets). This would ultimately join the complexities of different spaces that need to be shown on various drawings into a single coherent package - because these spaces ultimately overlap each other. Tags - is something that can be shown on drawings automatically, and adding just those two function would prove to be very useful especially when overlaying and unifying many different elements of construction drawings.
-
I don't know if this was proposed earlier, and if that's the case, just putting it up again. Wanted to request the ease of importing stories and levels from another file, or as a template, or choose to import part of stories from a different file more easily. This is especially the case if a referenced file uses stories, but the annotation file requires them to be added once more.
- 10 replies
-
- 3
-

-

-
- imported settings
- stories
- (and 2 more)
-
separate database column
Samuel Derenboim replied to Samuel Derenboim's question in Wishlist - Feature and Content Requests
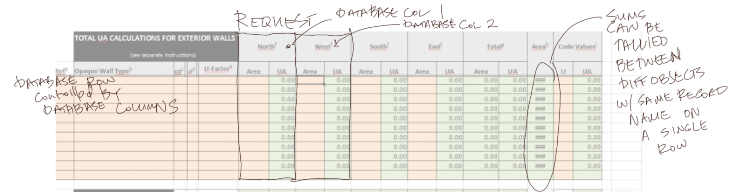
Thank you @Pat Stanford Not sure how a script would work if there are a number of database rows that would be generated for the number of records in the document per column. It's not simply a summary of one item in a database row. If that was the case, maybe there can be some kind of field entry into a worksheet that describes the criteria and the record and field information summary you are trying to pull out. My hunch though is that that information would be summarized in one table cell. (unless I'm misunderstanding something) In this case, a column could generate multiple records, maybe even dozens, the only detail is the output of database rows that it would be limited to a specific number of columns (or simply just that column). The only way (I think) it would work is if a column had a similar hide feature for database rows that would function like new type of database header for that column, or a series of columns. That way, that dummy column can set the database criteria to be pulled out and the column limit (in case you wanted the criteria to control multiple columns rather than just one). Once you set that information, then you can generate and populate the record and field name call outs in the database row header just like you normally would in a worksheet. The only difference is, it limits the information to only two columns (or the number of columns that you specify limiting the database row criteria to be populated) See below for a diagram :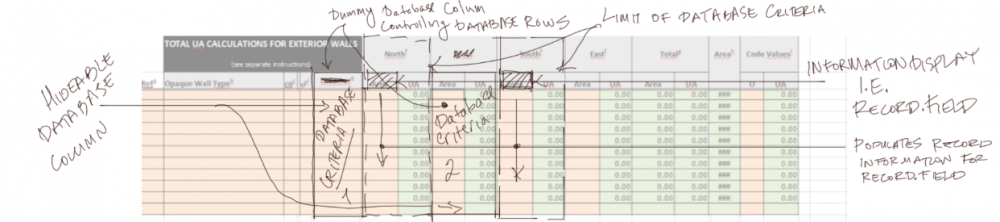
-
Good afternoon everyone! @ericjhberg @lgoodkind @twk @EricK @Pan.Gad @jg@swcm Why cannot we do the same thing, only with the datatag tool? Same thing, but flexible in the way the output is written. The only problem - the current datatag tool cannot callout elevations, Z distance from elevations, and levels in stories (which is what you want). The flexibility of the datatag tool is that you can arrange the information any which way you want without using the stake datatag information. The stake tool is only useful in this case if you were to use GIS information, is this something that's also integrated into the workflow?
-
Why are roofs calculated from the bottom?
Samuel Derenboim replied to NickMac's question in Wishlist - Feature and Content Requests
Nick I totally agree with you. I've been having similar issues. My request would be to convert an inclined plane or 3d polygon into a roof object based on its incline slope, etc... that can be derived from 3d loci or the stake tool. Would be super handy in that case. -
separate database column
Samuel Derenboim replied to Samuel Derenboim's question in Wishlist - Feature and Content Requests
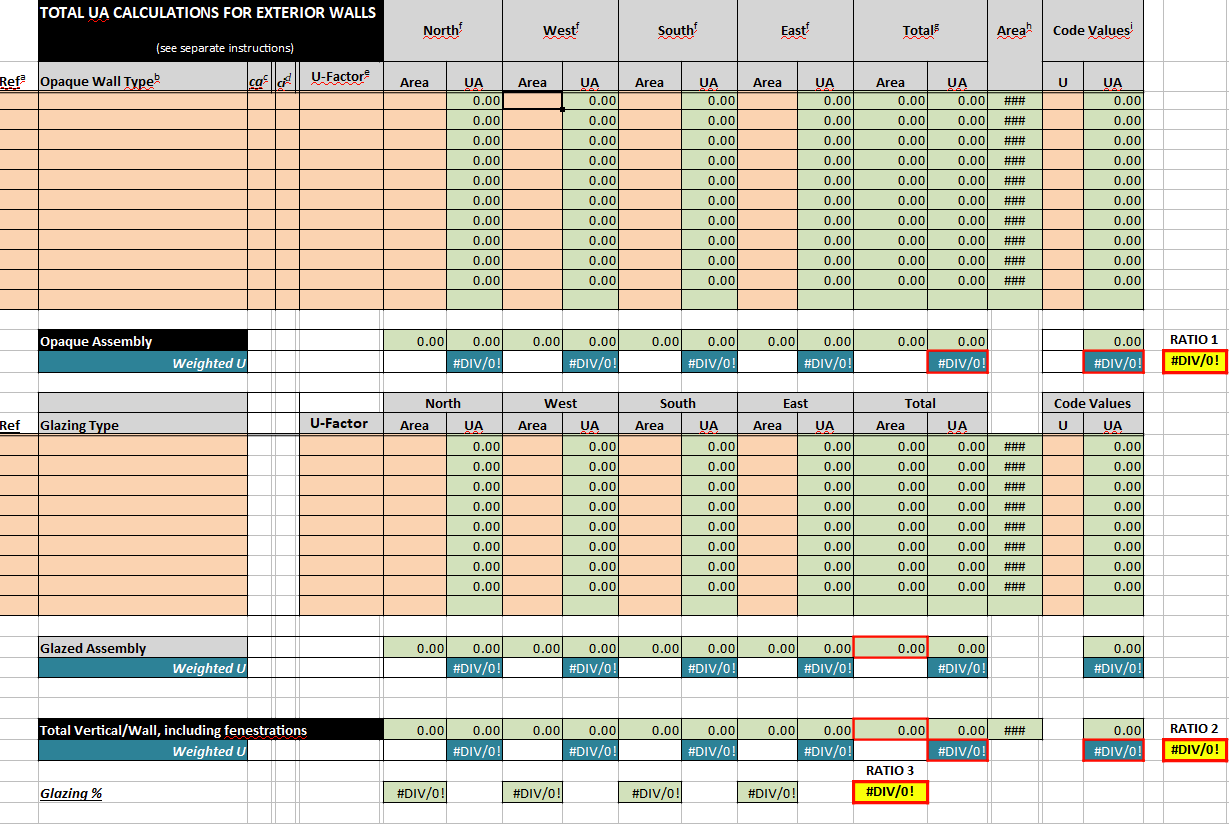
@Pat Stanford If a number of objects have a different orientation, it would leave all the other records empty that are in the latter fields. So when callout out a record, you can only call one out at a time since a single object can have one record. So 2 objects cannot be in the same database row, hence the request for a database column with a separate database query. For example, in the chart above calling out objects currently would look something like this : each row is a database row, and can be applied to a single record. In this case, the record is north, west, east, etc... If it fills up only that row for that specific information, all other orientations are namely 0, and the summations would need to be charted differently, not withstanding the fact that the chart itself would be 4 times larger than it should because a database row cannot describe two different objects at the same time in a single row The example that I'm requesting would look something like this The database columns would function the same way callout out record information in table rows. The only difference is that the information can be cut off at the column level as well, that way, multiple objects with same database records for ID's but different values for orientation can be described on a single row (in this case it would be 4 database columns). It can additionally be handy if the records were different, and you needed to multiply, add, divide two different objects with different records on a single worksheet row. The latter would get very tricky because I don't know how the worksheet would react if one database column had more rows than another database column, and consequently aligning information could get tricky or tedious. (In essence though, it would be very useful in summaries of database rows, that way information with relative records is summed up) Hope it makes sense 🙂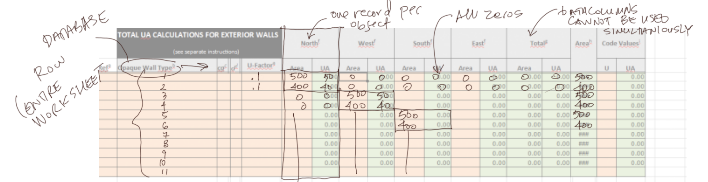

-
separate database column
Samuel Derenboim posted a question in Wishlist - Feature and Content Requests
In order to align several databases along the same row, I believe we need to provide the ability to reference a separate database formula for different columns (using if statements). It could prove to be useful when managing different datasets that don't have related record information, or have the same record information, but isolated extraction methods. Example below illustrates something that currently isn't possible in vectorworks that is driven by databases because each orientation would require a separate database callout with the rows controlled by an if statement. If they were controlled only by one datase record request, every orientation would be blank and distributed onto later database rows (rather than the same database row). Is something like this possible?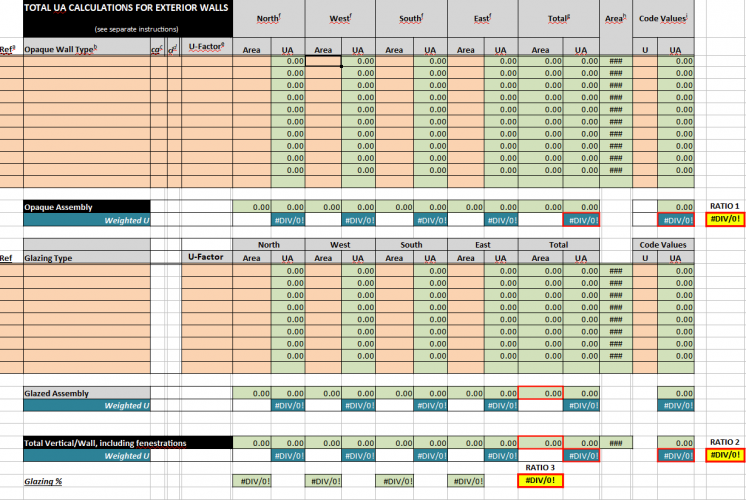
-
Our requirements have been much more rigorous as of late. There have to be areas for every fenestration and opaque wall face on the building per wall type for every floor each with their designated orientation (east, west, north, south). If we need to do something like performance values, we have to do average UA calculations for opaque wall types and total average UA calculations for total building areas in order to determine performance. The math itself is quite easy, just extracting the information out of energos and Vectorworks is the challenge.
-
Gester, thats interesting. I know that you are regulated by a different code in Europe (could be something like PASIVHAUS). Do those 4 sheets include calculations, areas, and visual summaries of the building? I'm sure there are performance approaches and prescriptive approaches to energy compliance / performance. I know here in America, the IBC (international building code) shows 2 different requirements that allows for flexible wall design based on a performance method, and a typical wall design based on a prescriptive method. Which one does the Polish legislature require from you?
-
Add levels option to tags
Samuel Derenboim posted a question in Wishlist - Feature and Content Requests
Can we add story levels and/or "Z above story" tag that way we can control the height of objects on a particular object measured from the story it is on? -
I've been having a great amount of trouble getting geometric information from polygons due with respect to different orientation. Among those options are : #ΔX#, #ΔY#, #ΔZ#. Upright polygons do not display length, height or width unless they have a thickness. Sometimes it is easier to calculate areas of surfaces rather than geometry because of the way it can be pulled from larger geometry
-
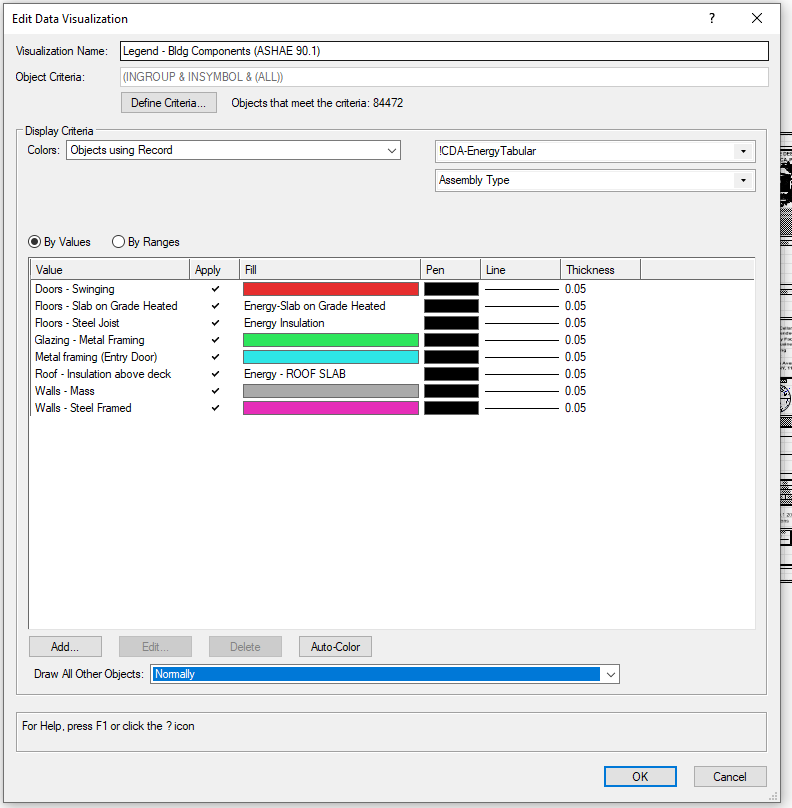
Good afternoon, After tinkering around with the data visualization feature, it has become extremely hard to tag objects like walls or windows that are behind the desired objects to be viewed. In this case, in the image below, I am trying to tag walls, curtainwalls windows and doors by orientation, but all other objects behind it get in the way. Tag all objects doesn't work anymore in the viewport for some reason (it doesn't align the tags). Additionally, on older machines, the amount of processing required is substantial, and takes a long time to render. Not only that, its extremely unresponsive when adding annotation to the annotation layer. In an effort to save memory, improve memory efficiency and not have objects being tagged that are behind the desired objects in the viewport with the same record or OIP, I wanted to request an option to not render the objects that either do not have certain information (like hide all other objects, rather than greying them out) or hide objects based on field value etc... I think it would be a very welcome addition for efficiency of using the visualization feature without expending an extreme amount of memory. (This is referring to the option all the way at the bottom of the screen - instead of see normally or greyed out, add "Do Not Show" or "Do Not Render")

-
Hi everyone, Noticed that WallArea_Net for Curtain walls with windows / doors returns the same area as Wallarea_gross. Is this intended to work this way? Or do the doors have to be 'curtainwall' doors in order to get true net area? Thanks in advance!
-
@michaelk Yep, a lot of it makes sense. A lot of these problems could be simply solved by using the #ΔY#, #ΔX# or #ΔZ# in the worksheets like they do in tags. My question is, why wouldn't the information in the tags match the same information in the worksheets? I mean, one could link the fields to the #ΔY#, #ΔX# or #ΔZ# functions via tag, but it only updates it when the object is tagged. If it didn't have that information before, it has to be re-tagged. If the geometry is updated, the same thing. :/. Its a little frustrating. 🙂 Few questions here : 1. Based on your answer, I'm guessing #ΔY#, #ΔX# or #ΔZ# cannot be called out in worksheets? (as these functions would solve all of the above concerns regarding orientation.) 2. If I link the #ΔY#, #ΔX# or #ΔZ# Tag functions to a field, and i need to update the geometry, is there a script that can update the tag references upon updating the worksheet? 3. By the looks of it, #ΔY#, #ΔX# or #ΔZ# functions cannot be transferred via link using an integer/number function, only the text based function. Is there a way to convert them to numbers after they have been converted to text? (something like txt2num?)
-
Thank you@michaelk . I forgot to mention it was a polygon extracted from a 3d surface. So the polygon was oriented in the xz and / or yz direction. I have attached a file for you to look at. Width returns the length. Length returns perimeter. I cannot extract true height. and Area returns the correct surface area. Do you think it is a bug? I've read on other forums that even on extrusions, height width and length don't exactly work properly because of their orientation in space, i'm guessing it might be a similar issue. I've also tried subtracting topbound and bottom bound to get the height, but that also doesn't work. PolyTest.vwx