


Samuel Derenboim
-
Posts
472 -
Joined
-
Last visited
Content Type
Profiles
Forums
Events
Articles
Marionette
Store
Posts posted by Samuel Derenboim
-
-
Will VW ever use the open source vulkan drivers? Any discussions regarding that? Just curious? It's becoming very competitive with OpenGL, D3D and DX12
-
If it makes it any consolation, I'm Russian. I too have a Russian accent. Don't think we said anything insulting, on the contrary. It's good to be not so serious sometimes. Yes, she has a Russian accent. But I'm sure she's brilliant nonetheless.
PS. For the record, This is the teaser video I've watched the most thus far. These particular features seem like one of the primary reasons to upgrade.
-
 3
3
-
-
Zis vaz havy Rashan Akstent. Eet can bee onyusual ot fherst, bat, eeventshuali eet grrous on yiou.
-
2
-
 2
2
-
-
-
1
-
-
I sooooo hope they get area calculations for the surfaces right ! This would be sooooo great! (Que Tony the Tiger) That and....
1. Will the display criteria be controlled only by the view port like before? or can it be done live like its shown on the video?
2. Structure grid and detail viewport symbols look very useful. Do they also work like section tools?
And lastly
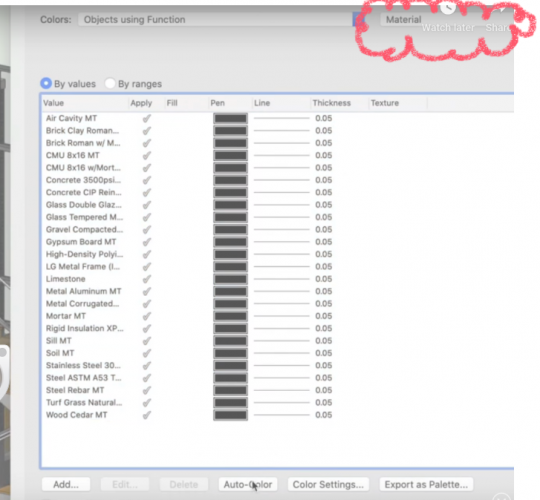
3. The Material resource, will it take over the class control of materials in door and window plugin objects????
Also...+1 for Russian Accents 😉 Love it! lol
Edit:
For those who didn't notice :
-
1
-
-
@jeff prince , I agree, the site model needs a little work. I have learned by using the site model tool ends up being problematic when using hardscapes and actual cutouts and site modifiers that I've resorted to using Nurbs surfaces, and mapping 2 dimensional geometry on the produced 3 dimensional surface. Sure, it's not parametric, but its a solution that isn't impossible to solve. I've also had many a problems before, some severe, some, not so much. (I.e. the way vectorworks calculates surface areas for walls, windows etc..., energos, the way VW tabulates records and it's inability to divide 0 into 0 without getting an error, among many others) Tech support wasn't able to help me much either. It's ok. I still found a solution.
Regarding the contour problem, let me check it out, maybe i can creatively come up with something.
Regarding export to C4d and exporting alpha channels shouldn't be such a big deal. I know in 3d max and / or in sketchup / vray - you can use a single image as an alpha and as an overlay if I'm not mistaken. VW isn't meant for that type of work. Now that Lumion, Twinmotion and Unreal Engine are on the market, real time renderers and it's entourage / foliage models should be able to replace such models. All I'm saying is that, yes, work-arounds are annoying, but it is not impossible to implement. My personal preference, I just import low poly sketchup foliage, and use that instead. Much easier to transfer to other 3d programs. If polys are too high, use a poly reducer to get the results you need.
I'm just happy I can produce a decent BIM model in VW, create a set of documents, label everything, use records for everything, and still be done on time. I can't say the same for any other program. Opting out of the service select might be a financial savings for one year, but you will end up paying for it when VW solves the problems you're talking about, or creates new tools that circumvents some of those problems. The tag tool for me was one such example 2 releases ago, I don't know how i worked without it before that point. In either case, what you pay in service select for upgrading VW upon release for 2 years is probably less than what you would pay to upgrade after missing the 2 years (depending on when you have service select). Financially, it works out for the better I think.
Additionally, I don't think they (service select customer service) will solve alot of problems you have. They're not intended for that purpose i believe, but they certainly are useful to get some ideas on how to solve something. They're also not the size of autodesk. You're still getting updates (more than autodesk produces), and its 2 times if not 3 times less expensive for a single seat. You're getting almost everything you want out of the software. If you want to stay in the same family, maybe Archicad is better for your needs? Have you tried it?
-
2
-
-
Perhaps the new material tool will be able to fix that since it is more of a material problem rather than a wall problem. Second, had they addressed that problem separately, I am sure there would be other gripes. All I am saying is that every release won't get you everything you wanted, but I know I've gotten at least one or two very useful tools or functionalities with every release.
-
DBrown, All due respect, there's only enough things they can squeeze into a year, particularly one riddled with so many problems outside of work. You see what's going on around us. At least be a little understanding. I for one, am impressed.
-
4
-
-
- Popular Post
- Popular Post
PS, just making friendly fun of the users willing to discontinue so quickly. For the service select price, and / or the permanent license price, Vectorworks to this day cannot be beat in my honest opinion. That, and at least we have direct access and contact with VW programers and representatives. Yes, not everything will be done in one sitting, but, i'm sure it will be addressed. Can't say the same about Revit or Archicad, Bricsad and others...i guess each have their pros an cons. But VW drawings sure are a pleasure to look at.
My point is, you discontinue service select to wait it out? Ok, you will pay substantially more later on to update. You want to transition to Revit? Sure, but be ready for a headache...or multiple for that matter. Here, take a look at this.
https://www.archpaper.com/2020/07/autodesk-issues-a-response-after-architects-speak-out-over-revit/
I'll be honest, this forum remind me alot of the sketchucation forum for sketchup plugins, except that the website is hosted by the company itself.
Having said that....Perhaps to satisfy the user base and get comments for free, maybe there can be a beta user team to address comments on new features? Far fetched idea, i know...but still worth a shot 🙂
I for one would sign up...if the opportunity arises
-
6
-
21 minutes ago, Mark Aceto said:
VW users: we want a maintenance update focused on performance and stability--no new features!
VW: for the first time in 20 years, every user finally has true multicore performance the entire time the app is being used
VW users: we're not upgrading because there are no new tools!
VW: there are ton of new things we haven't announced yet in these 4 Trigger Tuesdays
This is why we need better communication vis a vis a Public Roadmap. Also, just end Teaser Tuesdays. They used to be 8 min DIY BTS deep dives followed by Q&A's. Now they're just the same 3 min promo videos that drop on release day when we can dive into the new release ourselves to explore (which is extremely fun to do under those circumstances vs rage-posting in the the forum for a month straight).
LOL. But does it blend????
-
1
-
-
I think this sneak preview will be next. I certainly think this is a welcome and definitely a robust feature when textures and objects are concerned
-
1
-
-
Does this mean that you can create database files from excel to VW as well?
I.E. referential database that is used for reference for objects referencing it? That would be awesome....
-
2
-
-
Can something like this be used in worksheet mode?
-
I've been hoping to get this into the works for a while. Great for details and great for axonometric representations that are to scale. Scale is very important in architectural presentations and construction documents, and currently no isometric view can scale the presentation properly. Does anyone feel the same way?
-
1
-
-
-
@Josh Loy Does this include hidden line processing / rendering in viewports? I know that it wasn't supported for multi threaded computation. Has that changed?
-
2
-
-
Looking great!
@JuanP , Would there be a capability to move the edges of geometry as well?
-
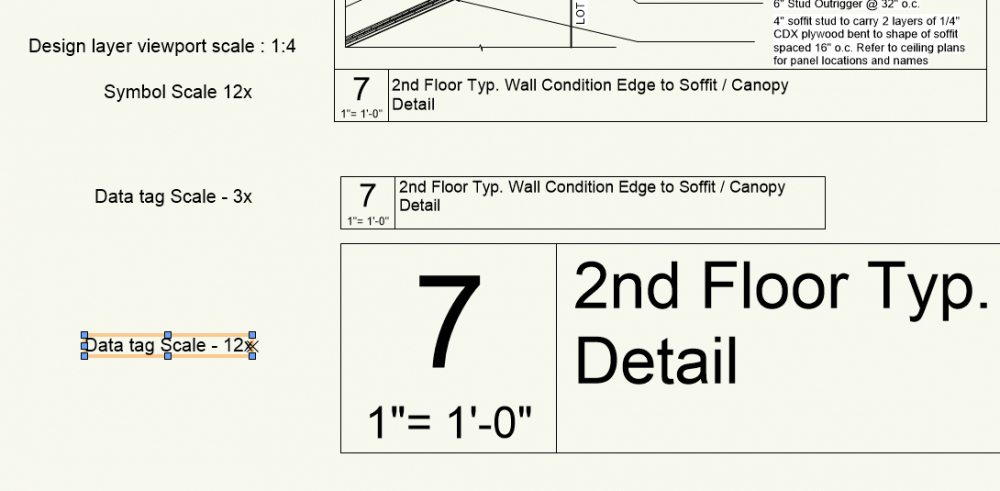
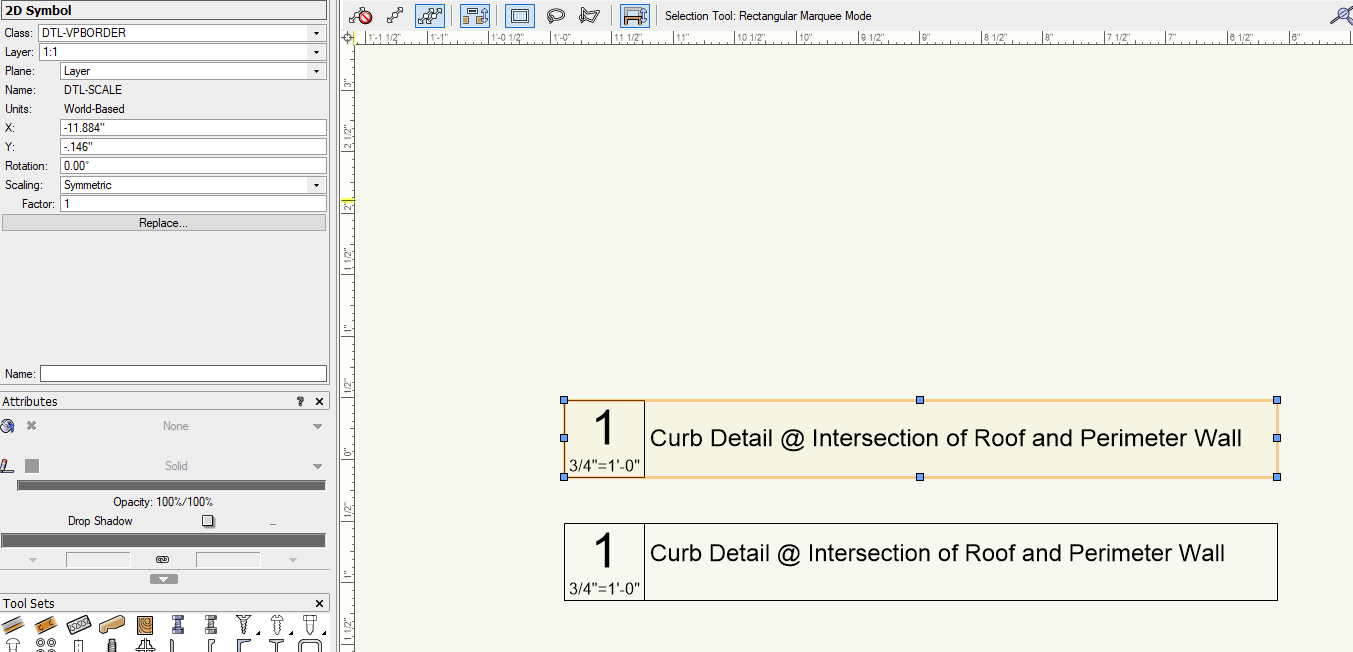
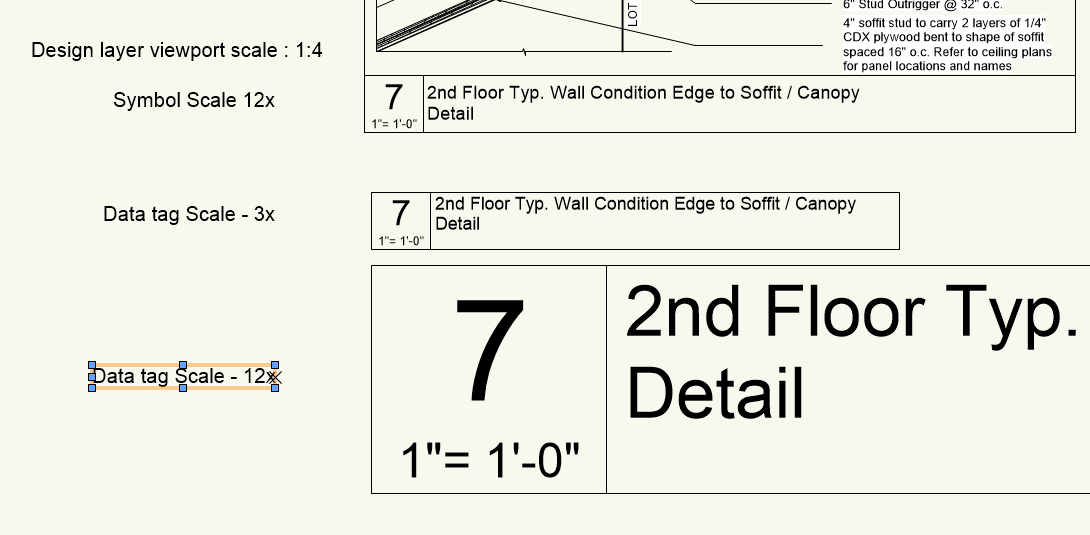
Don't know if anyone has run into this issue before, however, data tags with text for some reason scale differently than symbols do. From what I understand, data tags scale at page scale, where as symbols scale at world scale. When I take a symbol, and at 1:1 scale w/ size 10 text, the true size of the text inside symbol at 1:10 would be 1 instead of 10. Data tags automatically adjust its size based on text size according to design layer scale, and as a result cannot be truly scaled based on its world size. Is it possible to give data tag a world scale so that the text would adjust based a 1:1 ratio in the design layer view port irregardless of the design layer view port scale?
Data Tag @ 1 : 1 scale representation

Real world scales
-
1
-
-
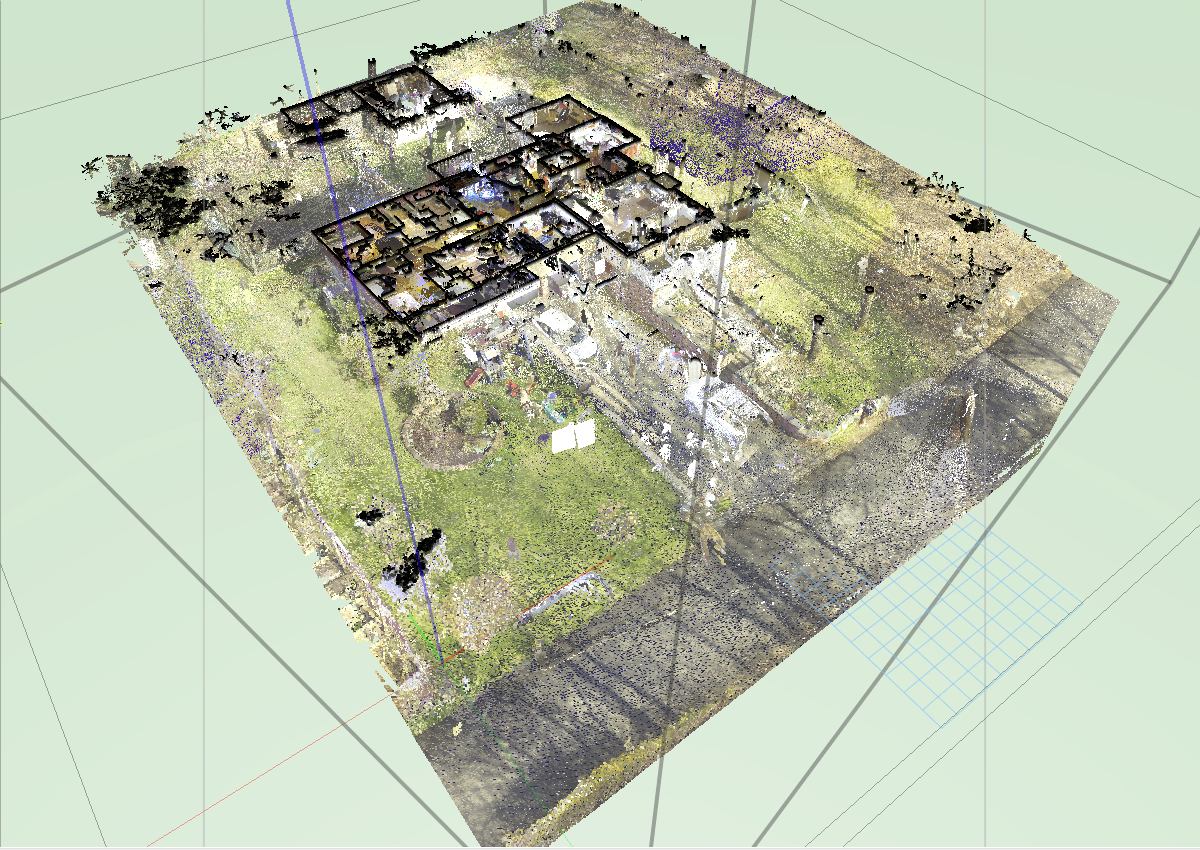
Hi everyone,
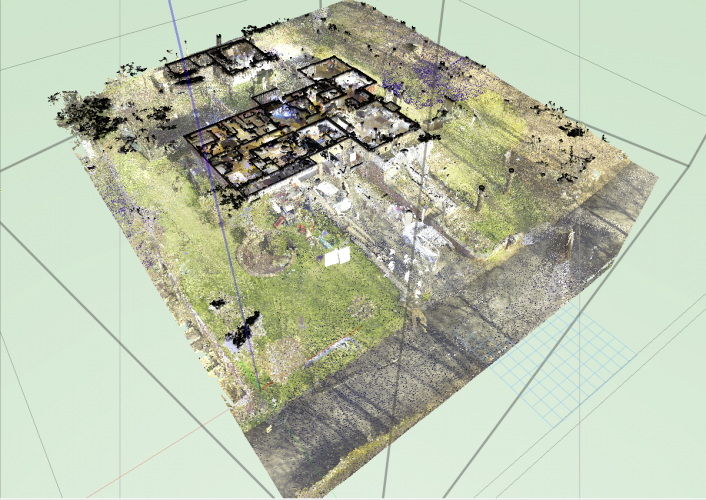
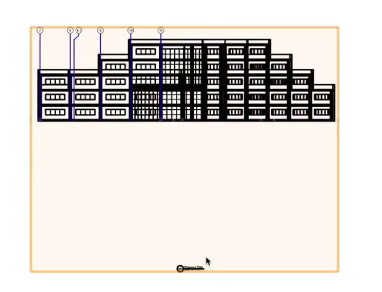
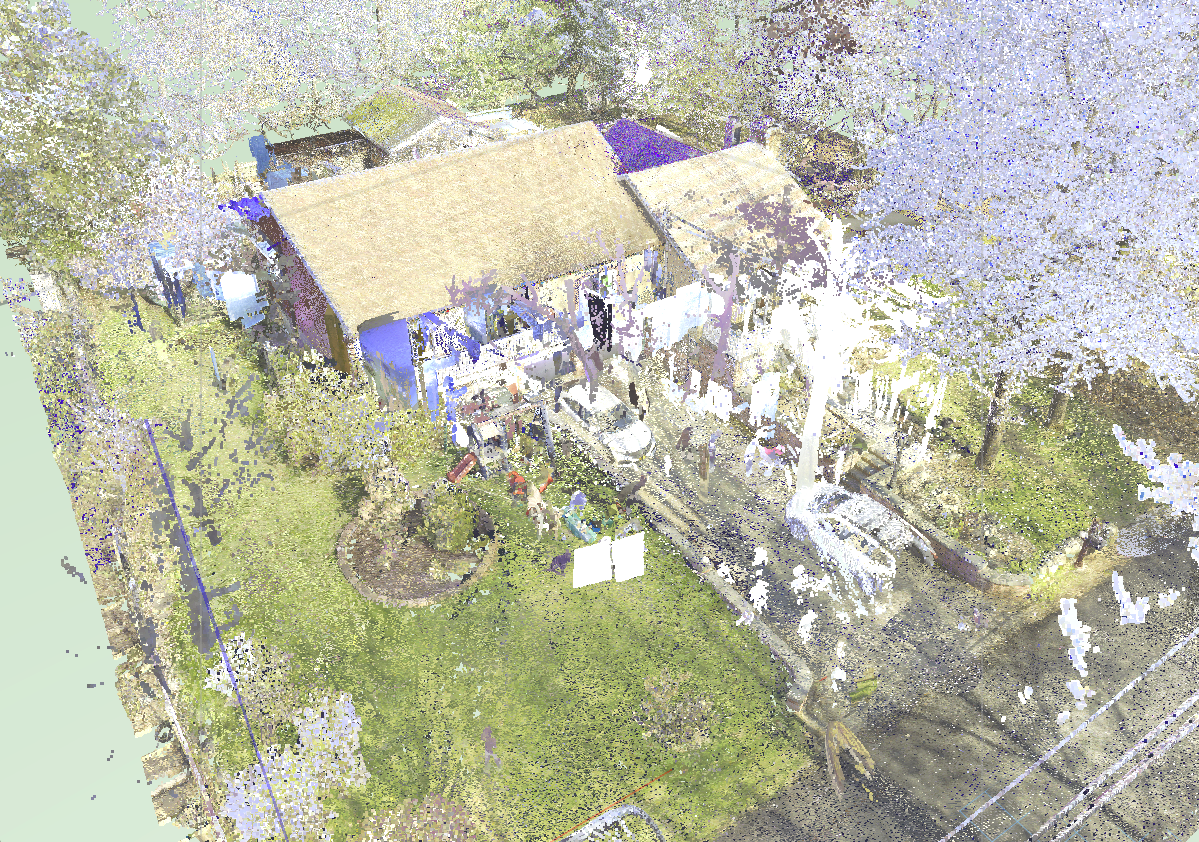
Don't know if anyone works with point clouds here, but it's definitely the future of surveying. There is a feature i wanted to enhance. Currently, there is only one right click option for extracting loci from a point cloud model, however it extracts from the entire point cloud model. My feature request enhancement is to selectively show where in the point cloud model I would like to extact the loci. If using the clip cube, it would be great to extact only the loci in the clip cube. If its a section for example, that has been generated from the point cloud, perhaps the same feature, extract loci from point in viewport (i.e. a viewport that has a min and max setting for below and above clipping points.) It is great to use if someone needs to model a terrain of some sort without having to regenerate the model itself.
Another feature would be to generate a 3d model from a series of loci, or a 3d terrain, but it would not generate the object if it has overlapping elements / loci in it. So i.e. to generate a model from a point cloud set of points that are spherical, or vertical. Just a thought. Thought Id share these ideas in the forum in case anyone runs into similar requests in the future.

Versus
-
1
-
-
Your suggestions for the tag tool regarding the bounding boxes is an excellent idea, don't know if you already submitted this enhancement, but I second the motion to add that feature (along with @Michal Zarzecki I presume).
I agree that the tag tool needs multiple additional functions in order to use some of these things properly. Particularly, the feature that is sorely missing is simply getting the tag to read the Z in reference to the story. It should also understand what level in the story it might be referencing. This pertains to one of the questions you ask - how would you do it in plan mode?
In my opinion there are two ways - either copy the z value of the symbol in reference to the floor elevation (not absolute zero), or copy the elevation of the level the symbol or PIO is on - i.e. - ceiling elevation, FFE elevation, T.o. slab elevation etc.. in both a numerical format and perhaps also callout the level itself, that way if it needs to be changed from the tag level, it can easily be done so. These two things can be done in plan mode without going into 3d or providing a working plane for the object you are referencing. This might be particularly useful since i have a feeling you guys might be integrating levels in symbols as well (or so i presume)
Just a thought. What do you think?
-
Hi everyone,
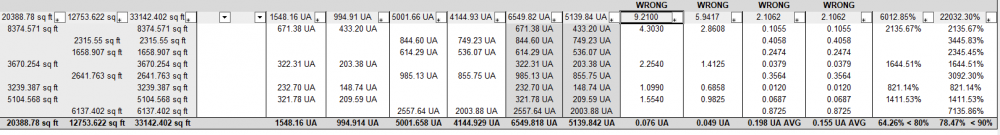
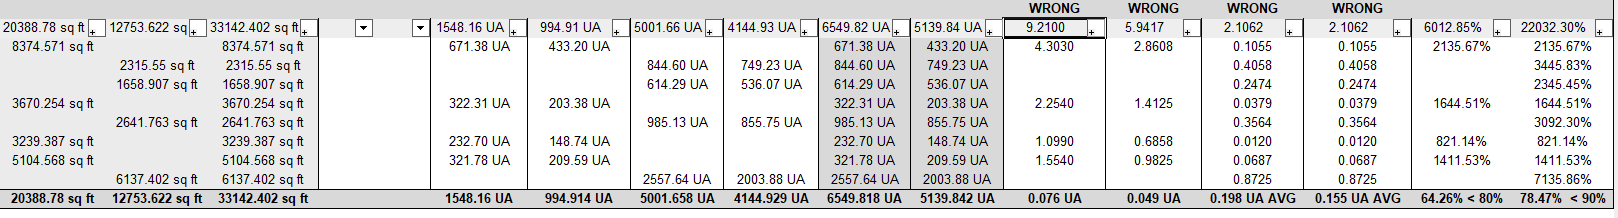
I know there is a simple fix to do this, but wanted to inquire within. The chart below shows Areas UA and UA averages. In order to get UA average formula looks like UA / Area. The bottom (totals) row returns the correct value, however the table cells in the database return the incorrect value. I know a conversion must be made or something like =value () or num2int or something. Does anyone know the correct formula to do the math properly ? (the UA column are summarized by sum)

Here is another example. The Table columns showing wrong are doing the math in the table cells because they are summarizing and adding the values. Formula under the 1st (from left) column with the word wrong above should calculate 433.2 / 8374.571 = .0517. It shows 4.3038 because it summarizes and sums all the criteria for the values. The same issue is the other columns. The totals cell at the bottom has the correct answer because it is not using a database header.
-
Would it be possible integrate an option to modify edges of 3d geometry ? Seems like a standard option in various 3d programs. Though it could be useful here. Now it is only possible with taper edge, which can be quite confusing to use. What does everyone else think?
-
No problem. Here is a sample file. They try to do the same thing, but the format by which the table is laid out from the above excel file would not be possible. If you set up columns for each of the cardinal axes, they will return 0 because each record is counted only once per row.
Thank you again @Pat Stanford
-
Thank you @Pat Stanford
You're right, I didn't get into detail of how it worked and checking part of the file. My concern is if there is a single crash or problem on one computer, how would the information be saved and would it affect the integrity of the master file that is being worked on.
I also noticed that the larger a file gets (annotation + BIM model), the harder it is to work on because more ram is required not withstanding any other unknown conditions. The more gears involved ,so to speak,, the easier to cause problems. Hence the solution for referencing information and using reference files to do annotation in a separate one.


Vulkan Drivers
in Wishlist - Feature and Content Requests
Posted
So I'm guessing this release is only concentrating on Metal API? Interesting though, how were the engineers able to speed up VW Graphics module for windows if their concentration was mostly for the Mac platform?