Jump to content

Precipitation Chart 3.0.0

   (3 reviews)

1 Screenshot

About This File

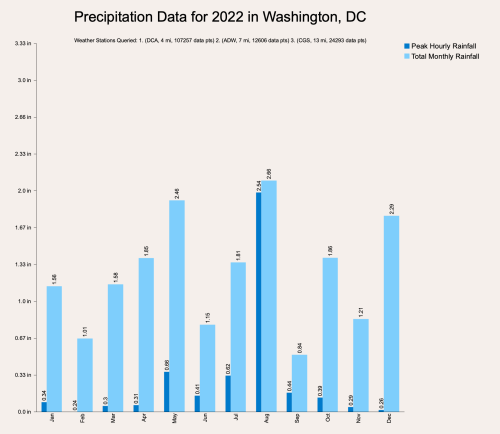
This is a Marionette Object that downloads weather data from the internet based on the address/location you enter into the OIP. The data this graphic shows the peak one hour rainfall and the total monthly rainfall per month. You must have a valid internet connection to use this MO.


What's New in Version 2.0.0   See changelog

Released

No changelog available for this version.

  • Like 4
  • Love 1

User Feedback


GatRed

   1 of 1 member found this review helpful 1 / 1 member

it seems to work only for the US…

Capture d’écran 2023-03-01 à 16.25.49.png

Link to review
KIT KOLLMEYER

   1 of 1 member found this review helpful 1 / 1 member

Thanks so much for making these. I am also getting the Index Error message. I'm on VW Architect 2020.

Link to review
Taproot


I'm unable to get this file to work.  I've downloaded both versions and in each I get an "Index Error: List index out of range" message.  I'm using the VW Designer 2019.  The object loads, but as soon as I change anything i.e. mm to inches, it lists the error.  Both the temperature and wind rose objects work, so I'm confident it isn't a network access issue.

Link to review
×
×
  • Create New...